Download to read offline


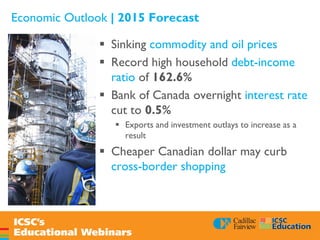
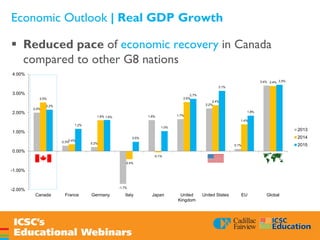


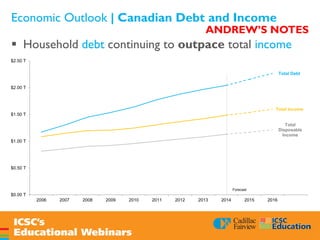
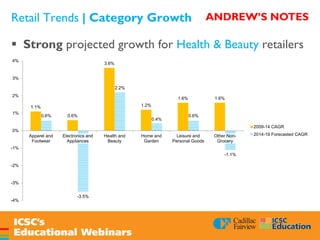
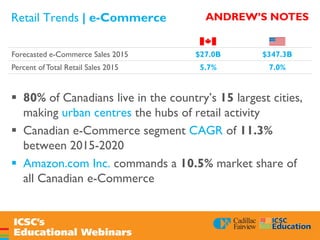

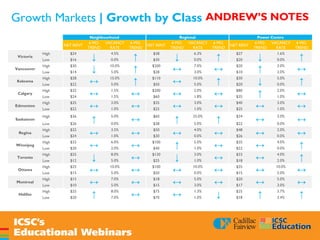

This webinar presented an analysis of market trends and the Canadian economic and retail outlook for 2015. Key points included: - The Canadian economy is expected to see slower growth than other G8 nations in 2015 due to falling oil prices and a higher household debt ratio. Real GDP growth is forecast to be 1.6% for the year. - The retail sector outlook is mixed, with luxury retailers expected to see strong growth while mid-range retailers may lose market share. E-commerce is also forecasted to increase substantially. - Regional retail performance varies across Canada, with solid growth on the west coast, especially in Vancouver, and mixed trends in other areas. Luxury expansion and health/beauty


