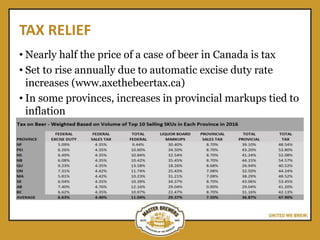
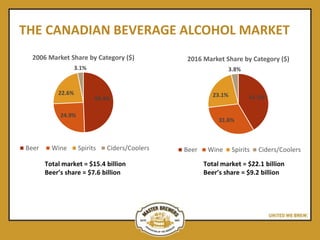
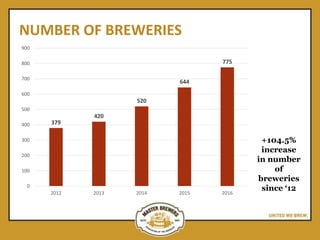
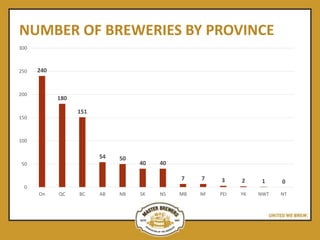
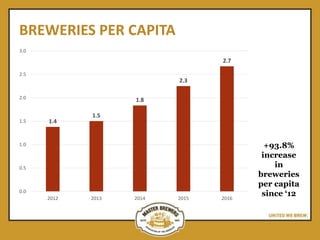
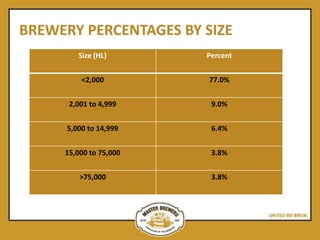
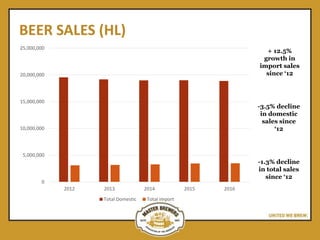
STATE OF THE
CANADIAN BEER
INDUSTRY
Luke Chapman, Beer Canada
MBAC Ontario Technical Conference
Hilton Niagara Falls
January 25, 2018
AGENDA
• About Beer Canada
• Current Issues and Trends
50+ MEMBERS OF ALL SIZES
GOALS
• Be a guiding and unifying force in advancing beer industry
positions to achieve a rational regulatory and public policy
environment in which industry members can market their
brands and grow their volumes profitably
• Be a recognized and authoritative national source of
information on all aspects of the beer industry
BEER SUPPORTS CANADA’S ECONOMY!
• Beer supports 149,000 Canadian jobs, with a labour
income of $5.3 billion
• 85% of beer sold in Canada, is made in Canada
• Canada has the third highest tax rate on beer in the world.
While contributing $13.6 billion annually to the economy,
beer generates $5.7 billion in tax and other revenues for
federal, provincial/territorial, and municipal governments
(not including provincial liquor board profits)
OUR PRIORITIES
• Tax Relief
• Updating the Federal Definition of Beer
• Legal marijuana
• Interprovincial Trade Barriers
• Data and Technical Services
TAX RELIEF
• Nearly half the price of a case of beer in Canada is tax
• Set to rise annually due to automatic excise duty rate
increases (www.axethebeertax.ca)
• In some provinces, increases in provincial markups tied to
inflation
UPDATING THE FEDERAL DEFINITION OF BEER
• Expected to be completed in 2018
• Modern definition will:
– allow for the use of innovative/traditional ingredients in beer
– maintain barley as a required ingredient in beer
– cap the amount of residual sugars permitted in beer to 4% by
weight.
LEGAL MARIJUANA
• Expected to be legal in Canada in summer 2018
• Feds have proposed strict limits on branding, use of
colours and mandatory warning labels
• Provinces rolling out distinct distribution/retail systems
• Will beer sales be impacted?
INTERPROVINCIAL TRADE BARRIERS
• Beer Canada maintains an inventory of interprovincial trade barriers
that exist for brewers: Currently over 100
• Supreme Court ruling (expected this year) in Comeau case could
change how brewers sell and consumers purchase beer
• Under the new Canadian Free Trade Agreement, a Beverage Alcohol
Working Group has been struck to identify ways to enhance trade in
beverage alcohol in Canada
DATA AND TECHNICAL SERVICES
• Industry data share program
• Syndicated pricing survey
• Media spend industry data share agreement
• Labelling toolkit
THE CANADIAN BEVERAGE ALCOHOL MARKET
Total market = $22.1 billion
Beer’s share = $9.2 billion
41.5%
31.6%
23.1%
3.8%
2016 Market Share by Category ($)
Beer Wine Spirits Ciders/Coolers
49.4%
24.9%
22.6%
3.1%
2006 Market Share by Category ($)
Beer Wine Spirits Ciders/Coolers
Total market = $15.4 billion
Beer’s share = $7.6 billion
NUMBER OF BREWERIES
379
420
520
644
775
0
100
200
300
400
500
600
700
800
900
2012 2013 2014 2015 2016
+104.5%
increase
in number
of
breweries
since ‘12
NUMBER OF BREWERIES BY PROVINCE
240
180
151
54 50
40 40
7 7 3 2 1 0
0
50
100
150
200
250
300
On QC BC AB NB SK NS MB NF PEI YK NWT NT
BREWERIES PER CAPITA
1.4
1.5
1.8
2.3
2.7
0.0
0.5
1.0
1.5
2.0
2.5
3.0
2012 2013 2014 2015 2016
+93.8%
increase
in
breweries
per capita
since ‘12
BREWERIES PER CAPITA BY PROVINCE
8.1
6.8
5.2
4.6
3.9
3.1
2.7 2.5
2.2
1.6 1.6
0.7
0
1
2
3
4
5
6
7
8
9
NB YK NS SK BC NWT QC PEI ON AB NF MB
BREWERY PERCENTAGES BY SIZE
Size (HL) Percent
<2,000 77.0%
2,001 to 4,999 9.0%
5,000 to 14,999 6.4%
15,000 to 75,000 3.8%
>75,000 3.8%
BEER SALES (HL)
0
5,000,000
10,000,000
15,000,000
20,000,000
25,000,000
2012 2013 2014 2015 2016
Total Domestic Total Import
+ 12.5%
growth in
import sales
since ‘12
-3.5% decline
in domestic
sales since
‘12
-1.3% decline
in total sales
since ‘12
BEER SALES (HL) BY PROVINCE
0
1,000,000
2,000,000
3,000,000
4,000,000
5,000,000
6,000,000
7,000,000
8,000,000
9,000,000
ON QC BC AB MB SK NS NB NF PEI YK NWT NT
PER CAPITA CONSUMPTION (LITRES)
83.4
80.9
79.5 79.3
77.1
73
74
75
76
77
78
79
80
81
82
83
84
2012 2013 2014 2015 2016
-7.6% decline
in per capita
consumption
since ‘12
PER CAPITA CONSUMPTION BY PROVINCE
128.7
103.4
96.3
83.3
78.9 78.3 77.4 77.1 76.4 75.6 74.8 72.1
21.1
0
20
40
60
80
100
120
140
YK NWT NF QC AB SK BC PEI NS NB MB ON NT
BEER SALES BY PACKAGE TYPE
43%
47%
10%
2012
Cans Bottles Keg
56%
34%
10%
2016
Cans Bottles Keg
CONSUMER PRICE INDEX – ON PREMISE
100
110
120
130
140
150
2012 2013 2014 2015 2016
Beer Wine Liquor
CONSUMER PRICE INDEX – OFF PREMISE
100
110
120
130
2012 2013 2014 2015 2016
Beer Wine Liquor
DEMOGRAPHICS
Population is growing, but…
DEMOGRAPHICS
We are getting older…
DEMOGRAPHICS
And more diverse…
FINAL THOUGHTS
Challenges lie ahead:
• Legal marijuana
• Shrinking category (on a volume and market share basis)
• Increasing taxes
• De-normalization of alcohol

Canada Beer Industry

  • 1.
    STATE OF THE CANADIANBEER INDUSTRY Luke Chapman, Beer Canada MBAC Ontario Technical Conference Hilton Niagara Falls January 25, 2018
  • 2.
    AGENDA • About BeerCanada • Current Issues and Trends
  • 3.
    50+ MEMBERS OFALL SIZES
  • 4.
    GOALS • Be aguiding and unifying force in advancing beer industry positions to achieve a rational regulatory and public policy environment in which industry members can market their brands and grow their volumes profitably • Be a recognized and authoritative national source of information on all aspects of the beer industry
  • 5.
    BEER SUPPORTS CANADA’SECONOMY! • Beer supports 149,000 Canadian jobs, with a labour income of $5.3 billion • 85% of beer sold in Canada, is made in Canada • Canada has the third highest tax rate on beer in the world. While contributing $13.6 billion annually to the economy, beer generates $5.7 billion in tax and other revenues for federal, provincial/territorial, and municipal governments (not including provincial liquor board profits)
  • 6.
    OUR PRIORITIES • TaxRelief • Updating the Federal Definition of Beer • Legal marijuana • Interprovincial Trade Barriers • Data and Technical Services
  • 7.
    TAX RELIEF • Nearlyhalf the price of a case of beer in Canada is tax • Set to rise annually due to automatic excise duty rate increases (www.axethebeertax.ca) • In some provinces, increases in provincial markups tied to inflation
  • 8.
    UPDATING THE FEDERALDEFINITION OF BEER • Expected to be completed in 2018 • Modern definition will: – allow for the use of innovative/traditional ingredients in beer – maintain barley as a required ingredient in beer – cap the amount of residual sugars permitted in beer to 4% by weight.
  • 9.
    LEGAL MARIJUANA • Expectedto be legal in Canada in summer 2018 • Feds have proposed strict limits on branding, use of colours and mandatory warning labels • Provinces rolling out distinct distribution/retail systems • Will beer sales be impacted?
  • 10.
    INTERPROVINCIAL TRADE BARRIERS •Beer Canada maintains an inventory of interprovincial trade barriers that exist for brewers: Currently over 100 • Supreme Court ruling (expected this year) in Comeau case could change how brewers sell and consumers purchase beer • Under the new Canadian Free Trade Agreement, a Beverage Alcohol Working Group has been struck to identify ways to enhance trade in beverage alcohol in Canada
  • 11.
    DATA AND TECHNICALSERVICES • Industry data share program • Syndicated pricing survey • Media spend industry data share agreement • Labelling toolkit
  • 12.
    THE CANADIAN BEVERAGEALCOHOL MARKET Total market = $22.1 billion Beer’s share = $9.2 billion 41.5% 31.6% 23.1% 3.8% 2016 Market Share by Category ($) Beer Wine Spirits Ciders/Coolers 49.4% 24.9% 22.6% 3.1% 2006 Market Share by Category ($) Beer Wine Spirits Ciders/Coolers Total market = $15.4 billion Beer’s share = $7.6 billion
  • 13.
    NUMBER OF BREWERIES 379 420 520 644 775 0 100 200 300 400 500 600 700 800 900 20122013 2014 2015 2016 +104.5% increase in number of breweries since ‘12
  • 14.
    NUMBER OF BREWERIESBY PROVINCE 240 180 151 54 50 40 40 7 7 3 2 1 0 0 50 100 150 200 250 300 On QC BC AB NB SK NS MB NF PEI YK NWT NT
  • 15.
    BREWERIES PER CAPITA 1.4 1.5 1.8 2.3 2.7 0.0 0.5 1.0 1.5 2.0 2.5 3.0 20122013 2014 2015 2016 +93.8% increase in breweries per capita since ‘12
  • 16.
    BREWERIES PER CAPITABY PROVINCE 8.1 6.8 5.2 4.6 3.9 3.1 2.7 2.5 2.2 1.6 1.6 0.7 0 1 2 3 4 5 6 7 8 9 NB YK NS SK BC NWT QC PEI ON AB NF MB
  • 17.
    BREWERY PERCENTAGES BYSIZE Size (HL) Percent <2,000 77.0% 2,001 to 4,999 9.0% 5,000 to 14,999 6.4% 15,000 to 75,000 3.8% >75,000 3.8%
  • 18.
    BEER SALES (HL) 0 5,000,000 10,000,000 15,000,000 20,000,000 25,000,000 20122013 2014 2015 2016 Total Domestic Total Import + 12.5% growth in import sales since ‘12 -3.5% decline in domestic sales since ‘12 -1.3% decline in total sales since ‘12
  • 19.
    BEER SALES (HL)BY PROVINCE 0 1,000,000 2,000,000 3,000,000 4,000,000 5,000,000 6,000,000 7,000,000 8,000,000 9,000,000 ON QC BC AB MB SK NS NB NF PEI YK NWT NT
  • 20.
    PER CAPITA CONSUMPTION(LITRES) 83.4 80.9 79.5 79.3 77.1 73 74 75 76 77 78 79 80 81 82 83 84 2012 2013 2014 2015 2016 -7.6% decline in per capita consumption since ‘12
  • 21.
    PER CAPITA CONSUMPTIONBY PROVINCE 128.7 103.4 96.3 83.3 78.9 78.3 77.4 77.1 76.4 75.6 74.8 72.1 21.1 0 20 40 60 80 100 120 140 YK NWT NF QC AB SK BC PEI NS NB MB ON NT
  • 22.
    BEER SALES BYPACKAGE TYPE 43% 47% 10% 2012 Cans Bottles Keg 56% 34% 10% 2016 Cans Bottles Keg
  • 23.
    CONSUMER PRICE INDEX– ON PREMISE 100 110 120 130 140 150 2012 2013 2014 2015 2016 Beer Wine Liquor
  • 24.
    CONSUMER PRICE INDEX– OFF PREMISE 100 110 120 130 2012 2013 2014 2015 2016 Beer Wine Liquor
  • 25.
  • 26.
  • 27.
  • 28.
    FINAL THOUGHTS Challenges lieahead: • Legal marijuana • Shrinking category (on a volume and market share basis) • Increasing taxes • De-normalization of alcohol