SlideShare a Scribd company logo
Equity Market Outlook
O v e r v i e wThe Market
Technicals (Data Source : Bloomberg)
Jul-17 Jun-17Investments by Institutions in the cash segment (Rs. Cr)
Avg Advance Decline Ratio
Valuation Ratios
Jul-17 Jun-17
Jul-17 10 Year Average
Jul-17Indices Movement Last 1 Yr
None of the aforesaid recommendations are based on any assumptions. These are purely for reference and the investors are requested to consult their financial advisors before
investing.
Global economy
The International Monetary Fund (IMF) said global economic recovery is
on a firm footing as improving growth in China, Europe and Japan offset
downward revisions for the US and the UK. The economic think-tank
maintained the global growth rate at 3.5% for 2017 and 3.6% for 2018.
The US Federal Reserve (Fed) kept the interest rate unchanged at 1-1.25%
amid inflation concerns. It hinted at winding down its massive holdings of
bonds relatively soon as a sign of confidence in the US economy.
However, the IMF lowered the country's growth forecast for 2017 and
2018 to 2.1% each from 2.3% and 2.5%, respectively.
Eurozone economy expanded 2.1% in Q2 2017 compared to 1.9% in Q1
2017. The IMF upgraded Eurozone's growth outlook for 2017 and 2018 to
1.9% and 1.7% from the earlier projections of 1.7% and 1.6%,
respectively, owing to stronger momentum in domestic demand.
However, it warned that low inflation, fragile banks and Brexit are
significant risks. The European Central Bank (ECB) kept key interest rate
unchanged at 0% and reiterated its commitment to purchase assets of 60
billion euros a month until the end of this year and longer if needed.
The UK's economic growth slowed to 1.7% year-on-year in Q2 2017
compared with 2% growth in the preceding quarter amid slowdown in
the manufacturing and construction sectors. The IMF revised down the
UK's 2017 growth forecast by 0.3 percentage point to 1.7% and left its
2018 forecast unchanged at 1.5%.
The Bank of Japan (BoJ) kept its monetary policy unchanged but lowered
the inflation forecasts for FY18 and FY19 to 1.1% and 1.8%, respectively.
The central bank, however, remained upbeat on economic growth and
raised GDP projections for FY18 and FY19 to 1.8% and 1.4% from 1.6%
and 1.3%, respectively.
China's GDP grew 6.9% annually in Q2 2017, same growth as in Q1. The
IMF upgraded the country's growth forecasts for 2017 and 2018 to 6.7%
and 6.4%, respectively, on expectations that the government would
maintain a high level of public investment.
Source: CRISIL Research
Fundamentals and economics:
Growth
India's GDP slowed down to 6.1% in the January-March 2017 compared
to 7% in the previous quarter. The growth rate for the 2016-17 was at the
three-year low of 7.1% compared to 8% growth in the previous fiscal.
Industrial growth, as measured by the Index of Industrial Production (IIP),
slowed down for the second consecutive month of the fiscal. IIP growth
fell to 1.7% year-on-year in May 2017 from 2.8% in April 2017.
Cumulatively, IIP grew 2.3% in April-May 2017, down from 7.3% a year
ago. The manufacturing and mining sectors performed poorly in the
month. While growth in the manufacturing sector halved to 1.2% in May
2017 from 2.4% in April 2017, mining sector growth slipped into negative
territory (-0.9%). It was the second consecutive month of decline for both.
The electricity segment (8% weight) cushioned the downside with 8.7%
growth against 5.9% the previous month.
According to the use-based classification, the picture was similar. Decline
in the capital goods category continued for the second consecutive
month (-3.9% growth in May vis-à-vis -2.9% in April), signaling
persistence of the weak investment environment. Infrastructure and
construction segment – the new entrant to the IIP series with 2011-12
base – remained almost stagnant. In the consumer goods category, while
consumer non-durables managed to grow a healthy 7.9% in May
(compared to 8.4% in April), consumer durables displayed negative
growth for the sixth consecutive month.
Source: Mospi.nic.in, CRISIL Centre for Economic Research (CCER)
BSE 1.17 1.05
NSE 1.10 0.96
FIIs (Net Purchases / Sales) 2488 3940
MFs (Net Purchases / Sales)* 8129 9106
MF Data till July 27
P/E ratio- Sensex 23.35 18.60
P/E ratio- Nifty 25.02 18.30
Price/Book Value Ratio-Sensex 3.06 3.00
Price/Book Value Ratio-Nifty 3.57 2.90
Dividend Yield-Sensex 1.23 1.40
Dividend Yield-Nifty 1.06 1.40
S&P BSE Sensex 5.15% 15.91%
Nifty 50 5.84% 16.65%
S&P BSE Auto 4.51% 15.99%
S&P BSE Bankex 8.02% 30.94%
S&P BSE Capital Goods 5.25% 16.12%
S&P BSE Consumer Durables 2.84% 32.75%
S&P BSE Fast Moving Consumer Goods -3.21% 15.68%
S&P BSE Healthcare 0.03% -12.91%
S&P BSE Information Technology 6.15% -3.47%
S&P BSE Metal 9.25% 32.10%
S&P BSE MidCap 5.09% 21.55%
S&P BSE Oil & Gas 7.48% 33.93%
S&P BSE PSU 7.08% 20.88%
S&P BSE Realty 7.00% 36.04%
S&P BSE SmallCap 4.43% 30.74%
S&P BSE Teck Index 6.76% -0.91%
Inflation
India's Consumer Price Index (CPI)-based inflation fell to a record low of
1.54% in June 2017 owing to fall in food inflation to -2.1% in June (against
-1.1% in May). The decline was led primarily by the pulses and vegetables
O v e r v i e wThe Market
Equity Market Outlook
None of the aforesaid recommendations are based on any assumptions. These are purely for reference and the investors are requested to consult their financial advisors before
investing.
Currency
The rupee ended stronger against the US dollar in July, with the
exchange rate settling at Rs 64.18 per dollar on July 31, 2017 as against Rs
64.58 per dollar on June 30, 2017. Periodic dollar sales by foreign banks
for foreign institutional investor inflows into domestic equities gave the
rupee support. The local currency was aided by the US Fed Chair's dovish
Congressional testimony mid-month. The dollar weakened further
following the European Central Bank's (ECB's) monetary policy decision,
thereby benefitting the rupee. Comments from US Fed officials towards
the end of the month led to diminished expectation of another interest
rate hike in this calendar year, and strengthened sentiment for the rupee.
Further rupee gains were erased by intermittent dollar demand from
state-owned banks. Gains registered by the dollar following the Bank of
Japan's (BoJ's) monetary policy decision put the rupee under pressure
briefly. The rupee was also pulled down by reports of geopolitical
tensions between India and China and by North Korea's announcement
that it had test-fired an intercontinental ballistic missile.
Source: CRISIL Research
Market sentiment
Flows
Foreign institutional investors (FIIs) continued to be buyers of equities.
FIIs bought equities worth Rs 24.88 billion in July 2017 compared to
buying of Rs 39.40 billion in June. Mutual funds also remained buyers of
equities in July 2017. They bought equities worth Rs 81.29 billion in July
(until July 27) compared with Rs 91.06 billion in June 2017.
Deficit
India's Fiscal Deficit touched Rs 4.42 trillion ($68.88 billion) during April-
June period or 80.8% of the budgeted target for the current fiscal year
that ends in March; the Fiscal Deficit was 61.1% of the full-year target
during the same period a year ago.
India's Current Account Deficit (CAD) surged to $3.4 billion, or 0.6% of
GDP, in the fourth quarter of 2016-17 as against $0.3 billion (0.1% of GDP)
in the same quarter last year but narrowed from $8.0 billion (1.4% of GDP)
in the preceding quarter. The widening of CAD year-on-year was
primarily on account of a higher trade deficit ($29.7 billion) brought about
by a larger increase in merchandise imports relative to exports. Net
services receipts increased year-on-year owing to a rise in net earnings
from travel, transport, construction and other business services.
India's exports grew 4.4% year-on-year to $23.5 billion in June 2017
compared to 8.3% in May 2017. Growth in exports of non-oil goods also
declined, to 4.5% from 6.6% in May. Export growth was negative in 15 of
top 30 commodities, the most prominent being gems & jewellery (-2.7%),
pharmaceuticals (-2.2%) and textiles (-1.4%). However, export growth
was robust in engineering goods (14.8%), organic and inorganic
chemicals (13.2%) and rice (27.3%).
Imports grew 19% year-on-year in June 2017 to $36.5 billion, compared
to 33.1% in the previous month. The largest rise in imports was seen in
precious and semi-precious stones (86.3%) and electronic goods
(24.2%). Imports of investment-related goods rose 7.6%, after declining
0.9% in the previous month. The trend of imports growing faster than
exports is expected to continue this fiscal, as domestic demand
strengthens. Accordingly, the trade deficit was $12.9 billion in June 2017
compared to $13.84 billion in May 2017.
Source: RBI
Brent
Brent crude oil prices rose sharply by 8% to close the month at $52.65 per
barrel on July 31 vis-à-vis 47.92 per barrel on June 30, 2017 on reports of
decline in US crude oil inventories. Fresh pledges from Saudi Arabia and
Nigeria to reduce crude oil exports and limit output, respectively, also led
to price gains. Some gains were erased on news that Russia had ruled out
proposals to deepen the global production cuts and reports of higher
monthly exports from OPEC.
Source: CCER
Source: Mospi.nic.in, CCER
Source: SEBI
category where inflation was down at -21.9% and -16.5%, respectively.
Excluding these categories, food inflation printed at 1.3% compared with
1.6% in May. This suggests inflation has been declining in other food
categories as well – including cereals (down 40 bps to 4.4%), eggs (down
80 bps to nearly zero), milk (down 40 bps to 4.1%), edible oils (down 36
bps to 2.3%) and sugar (down 110 bps to 8.7%).
Fuel inflation eased further in June as global crude oil prices fell nearly 3%
year-on-year and 8% month-on-month, while the rupee stayed stable.
Fuel inflation slowed to 4.3% in June from 6.2% in May. Within this
category, inflation in fuel and light fell to 4.5% from 5.5%, while in petrol
and diesel, it fell to 3.3% from 8.8%. Core inflation CPI excluding food,
fuel and light, petrol and diesel) was unchanged from the previous
month, at 4.1%. Some easing in categories such as household goods and
services, education, transport and communication was offset by higher
inflation in personal care and recreation services.
Wholesale Price Index (WPI) slipped to a 14-month low of 0.90% in June
2017 as food inflation remained negative.
Market Performance
Indian equity indices extended their record-breaking run in July. S&P BSE
Sensex hit a fresh record high of 32,515 and Nifty 50 touched the 10000-
mark for the first time in 21 years. Benchmarks gained over 5% in the
month. Easing worries over major disruption following the
implementation of the Goods and Services Tax (GST) on July 1, 2017 and
positive global cues brought in sharp gains.
-1.00
0.00
1.00
2.00
3.00
4.00
5.00
6.00
7.00
CPI WPI
Inflation
-30,000
-20,000
-10,000
0
10,000
20,000
30,000
40,000
Cr.
FII Flows
-2,000
0
2,000
4,000
6,000
8,000
10,000
12,000
14,000
16,000
MF Flows
O v e r v i e wThe Market
None of the aforesaid recommendations are based on any assumptions. These are purely for reference and the investors are requested to consult their financial advisors before
investing.
Our Recommendations
Investors may continue with their SIPs in pure equity funds. For new
investors we recommend SIP in Dynamic Asset Allocation Funds.
Volatility due to global factors may continue to stay in the near term.
Investors with an intent to benefit from volatility are recommended for
lump-sum investments in dynamic asset allocation funds. For tactical
allocation, investors could consider thematic funds which focus on
infrastructure theme.
ICICI Prudential Value Discovery Fund
ICICI Prudential Top 100 Fund
ICICI Prudential Multicap Fund
ICICI Prudential Focused Bluechip Equity Fund
ICICI Prudential Select Large Cap Fund
Pure Equity Funds
These funds are positioned
aggressively to gain from recovery in
the economy and commodity prices.
These funds aim to generate long term
wealth creation.
Our Recommendations – Equity Schemes
Asset Allocation Funds
ICICI Prudential Balanced Advantage Fund
ICICI Prudential Balanced Fund
ICICI Prudential Dynamic Plan
Theme-based funds
ICICI Prudential Infrastructure Fund Investors could invest in this thematic
fund for tactical allocation. It would be a
high risk investment option.
These funds aim to benefit from
volatility and can be suitable for
investors aiming to participate in
equities with lower volatility.
Equity valuations show that the market valuations are in the zone where investors are recommended to invest in funds with low net equity levels
within the dynamic asset allocation fund category.
Equity Valuation Index
Equity valuation index is calculated by assigning equal weights to Price to equity (PE), Price to book (PB), G-Sec*PE and Market Cap to Gross Domestic
Product (GDP)
Equity Valuation Index
Market Outlook and Triggers
MSCI Emerging Market Index outperformed MSCI Developed Market
Index by 3%. This was the seventh consecutive month of
outperformance. India with +5% had the best month on year-to-date
(YTD) driven by smooth GST implementation, good progress of
monsoons and expectations of rate cuts.
Even after the recent run-up, we continue to believe that the equity
market is in mid-cycle due to parameters such as credit growth, earnings
growth, inflation and capacity utilisation, which appear to be close to
cyclical lows. Several reforms / actions such as Goods and Services Tax
(GST), infrastructure thrust from the government and financial inclusion
are in place that is likely to support higher growth. However, the same is
subject to an earnings upgrade cycle, which is critical for the current
valuations to sustain and the volatility that may arise due to uncertainty of
global events.
The GST reform implemented on July 1, 2017, is expected to improve the
ease of doing business in India as multiple taxes reduce and further
support inter-state business. The political stability gives high visibility to
policy continuity well beyond 2019. This has brought-up India's position
on the global stage as an attractive destination for investment. The same
is also reflected in the FII flows to India.
In this mid-cycle, investors are recommended to invest in dynamic asset
allocation funds as they are well-positioned to benefit from market-cycles
over long-term. Investors looking to take exposure in pure-equity funds
for long-term could also consider investing systematically in ICICI
Prudential Value Discovery Fund. For thematic exposure, investors could
consider ICICI Prudential Infrastructure Fund.
The market was mainly boosted by hopes of interest rate cut by the
Reserve Bank of India (RBI) amid falling retail inflation and discouraging
industrial output numbers. Actions remained stock-specific owing to
quarterly earnings. More gains were seen owing to sustained buying by
domestic institutional investors (DIIs) and FIIs. Positive global cues
including dovish comments from the US Federal Reserve (Fed), renewed
interest in US technology stocks and encouraging economic cues from
China including growth in domestic product and industrial output data
augured well for the indices.
More gains were, however, capped owing to a sharp fall in the index
heavyweight after the GST Council decided to raise cess on cigarettes in a
bid to reduce profiteering by companies. Disappointing quarterly earning
numbers from some companies, emergence of profit booking after
recent gains and expiry of the July futures and options contract weighed
on the indices. Worries that the global central banks could soon scale
back some of their stimulus measures dented global risk appetite and put
some pressure on domestic equities.
Most of the S&P BSE Sectoral indices ended higher in July 2017. S&P BSE
Metal index was the top gainer – up 9.25% month-on-month (MoM) amid
strong global metal prices and positive cues from China. Interest rate
sensitive stocks rose amid expectations of an interest rate cut. S&P BSE
BANKEX, S&P BSE Realty and S&P BSE Auto surged MoM by 8%, 7% and
4.5%, respectively. Strong buying interest was seen in the oil & gas and IT
stocks; S&P BSE Oil and Gas and S&P BSE IT rose 7.48% and 6.15%,
respectively. S&P BSE FMCG was the only laggard – down over 3% after
the increase in cess on cigarettes pulled down the index major.
Source: NSE, BSE
MutualFundinvestmentsaresubjecttomarketrisks,readallschemerelateddocumentscarefully.
Disclaimer: In the preparation of the material contained in this document, the Asset Management Company (AMC) has used information that is publicly available, including information developed in-house.
Some of the material used in the document may have been obtained from members/persons other than the AMC and/or its affiliates and which may have been made available to the AMC and/or to its affiliates.
Information gathered and material used in this document is believed to be from reliable sources. The AMC however does not warrant the accuracy, reasonableness and / or completeness of any information. We
haveincludedstatements/opinions/recommendationsinthisdocument,whichcontainwords,orphrasessuchas“will”,“expect”,“should”,“believe”andsimilarexpressionsorvariationsofsuchexpressions
that are “forward looking statements”. Actual results may differ materially from those suggested by the forward looking statements due to risk or uncertainties associated with our expectations with respect to,
but not limited to, exposure to market risks, general economic and political conditions in India and other countries globally, which have an impact on our services and / or investments, the monetary and interest
policiesofIndia,inflation,deflation,unanticipatedturbulenceininterestrates,foreignexchangerates, equity prices or other rates or prices etc.
The AMC (including its affiliates), the Mutual Fund, the trust and any of its officers, directors, personnel and employees, shall not be liable for any loss, damage of any nature,
including but not limited to direct, indirect, punitive, special, exemplary, consequential, as also any loss of profit in any way arising from the use of this material in any
manner. The recipient alone shall be fully responsible/are liable for any decision taken on this material.
• Long term wealth creation solution.
• A diversified equity fund that aims to generate returns by investing
in stocks with attractive valuations.
* Investors should consult their financial advisers if in doubt about whether the product
is suitable for them.
ICICI Prudential Value Discovery Fund is suitable for investors who are seeking*: Riskometer
Investors understand that their
principal will be at moderately high risk
Low
Moderately
Low
ModeratelyHigh
High
Low High
Moderate
• Long term wealth creation solution
• A focused large cap equity fund that aims for growth by investing in
companies in the large cap category.
* Investors should consult their financial advisers if in doubt about whether the product is
suitable for them.
ICICI Prudential Foucsed Bluechip Equity Fund is suitable for investors who
are seeking*:
Riskometer
Investors understand that their
principalwillbeatmoderatelyhighrisk
Low
Moderately
Low
Moderately
High
High
Low High
Moderate
• Long term wealth creation solution
• An equity fund that aims for growth by investing in equity and
derivatives.
* Investors should consult their financial advisers if in doubt about whether the product
is suitable for them.
ICICI Prudential Balanced Advantage Fund is suitable for investors
who are seeking*:
Riskometer
Investors understand that their principal
will be at moderately high risk
Low
Moderately
Low
Moderately
High
High
Low High
Moderate
• Long term wealth creation solution
• An equity fund that aims to provide long term capital
appreciation by predominantly investing in equity and equity
related securities.
* Investors should consult their financial advisers if in doubt about whether the
product is suitable for them.
ICICI Prudential Top 100 Fund is suitable for investors who are seeking*: Riskometer
Investors understand that their
principal will be at moderately high risk
Low
Moderately
Low
ModeratelyHigh
High
Low High
Moderate
Investors understand that their
principal will be at moderately high risk
• Long term wealth creation solution
• A balanced fund aiming for long term capital appreciation and current
income by investing in equity as well as fixed income securities.
* Investors should consult their financial advisers if in doubt about whether the
product is suitable for them.
ICICI Prudential Balanced Fund is suitable for investors who are seeking*: Riskometer
Low
Moderately
Low
ModeratelyHigh
High
Low High
Moderate
• Long term wealth creation solution
• An equity fund that aims to generate capital appreciation by investing in
equity and equity related securities of companies forming part of S&P BSE
100 Index.
* Investors should consult their financial advisers if in doubt about whether the product
is suitable for them.
ICICI Prudential Select Large Cap Fund is suitable for investors who are seeking*: Riskometer
Investors understand that their
principal will be at moderately high risk
Low
Moderately
Low
ModeratelyHigh
High
Low High
Moderate
Investors understand that their
principal will be at moderately high risk
• Long term wealth creation solution
• A growth oriented equity fund that invests in equity and equity related
securities of core sectors and associated feeder industries.
* Investors should consult their financial advisers if in doubt about whether the
product is suitable for them.
ICICI Prudential Multicap Fund is suitable for investors who are seeking*: Riskometer
Low
Moderately
Low
ModeratelyHigh
High
Low High
Moderate
Investors understand that their
principal will be at moderately high risk
• Long term wealth creation solution
• A diversified equity fund that aims for growth by investing in equity and
debt (for defensive considerations)
* Investors should consult their financial advisers if in doubt about whether the
product is suitable for them.
ICICI Prudential Dynamic Plan is suitable for investors who are seeking*: Riskometer
Low
Moderately
Low
ModeratelyHigh
High
Low High
Moderate
• Long term wealth creation solution.
• An equity fund that aims for growth by primarily investing in securities of
companies belonging to infrastructure and allied sectors.
* Investors should consult their financial advisers if in doubt about whether the product is
suitable for them.
ICICI Prudentinal Infrastructure Fund is suitable for investors who are seeking*: Riskometer
Investors understand that their
principal will be at high risk
Low
Moderately
Low
ModeratelyHigh
High
Low High
Moderate

More Related Content

What's hot

Currency monthly 7th mar'17
Currency monthly   7th mar'17Currency monthly   7th mar'17
Currency monthly 7th mar'17
choice broking
 
Market and economic outlook report june
Market and economic outlook report juneMarket and economic outlook report june
Market and economic outlook report juneagniV
 
Advice for the wise August '14
Advice for the wise August '14Advice for the wise August '14
Advice for the wise August '14
Karvy Private Wealth
 
Developments in the monetary policy arena
Developments in the monetary policy arenaDevelopments in the monetary policy arena
Developments in the monetary policy arenavideoaakash15
 
Advice for the Wise October 2015
Advice for the Wise October 2015Advice for the Wise October 2015
Advice for the Wise October 2015
Karvy Private Wealth
 
Advice for the Wise: June 2013
Advice for the Wise: June 2013Advice for the Wise: June 2013
Advice for the Wise: June 2013
Karvy Private Wealth
 
Currency monthly 6th jan'17
Currency monthly   6th jan'17Currency monthly   6th jan'17
Currency monthly 6th jan'17
Choice Equity
 
The World This Week October 17 - October21 2016
The World This Week October 17 - October21 2016The World This Week October 17 - October21 2016
The World This Week October 17 - October21 2016
Karvy Private Wealth
 
Advice for the Wise November 2016
Advice for the Wise   November 2016Advice for the Wise   November 2016
Advice for the Wise November 2016
Karvy Private Wealth
 
QNB Group India Economic Insight 2014
QNB Group India Economic Insight 2014QNB Group India Economic Insight 2014
QNB Group India Economic Insight 2014
Joannes Mongardini
 
Currency monthly 9th dec'16
Currency monthly   9th dec'16Currency monthly   9th dec'16
Currency monthly 9th dec'16
Choice Equity
 
Advice for the Wise October 2016
Advice for the Wise   October 2016Advice for the Wise   October 2016
Advice for the Wise October 2016
Karvy Private Wealth
 

What's hot (20)

Advice for The Wise February 2014
Advice for The Wise February 2014Advice for The Wise February 2014
Advice for The Wise February 2014
 
Advice for The Wise March 2014
Advice for The Wise March 2014Advice for The Wise March 2014
Advice for The Wise March 2014
 
Currency monthly 7th mar'17
Currency monthly   7th mar'17Currency monthly   7th mar'17
Currency monthly 7th mar'17
 
Advice For The Wise - May
Advice For The Wise - May Advice For The Wise - May
Advice For The Wise - May
 
Market and economic outlook report june
Market and economic outlook report juneMarket and economic outlook report june
Market and economic outlook report june
 
Advice For The Wise: July, 2013
Advice For The Wise: July, 2013Advice For The Wise: July, 2013
Advice For The Wise: July, 2013
 
Advice for the wise August '14
Advice for the wise August '14Advice for the wise August '14
Advice for the wise August '14
 
Developments in the monetary policy arena
Developments in the monetary policy arenaDevelopments in the monetary policy arena
Developments in the monetary policy arena
 
Weekly Market Review - July 12, 2013
Weekly Market Review - July 12, 2013Weekly Market Review - July 12, 2013
Weekly Market Review - July 12, 2013
 
Advice for the Wise October 2015
Advice for the Wise October 2015Advice for the Wise October 2015
Advice for the Wise October 2015
 
Advice for the Wise: June 2013
Advice for the Wise: June 2013Advice for the Wise: June 2013
Advice for the Wise: June 2013
 
Currency monthly 6th jan'17
Currency monthly   6th jan'17Currency monthly   6th jan'17
Currency monthly 6th jan'17
 
The World This Week October 17 - October21 2016
The World This Week October 17 - October21 2016The World This Week October 17 - October21 2016
The World This Week October 17 - October21 2016
 
Advice for the Wise November 2016
Advice for the Wise   November 2016Advice for the Wise   November 2016
Advice for the Wise November 2016
 
Weekly Market Review - August 2, 2013
Weekly Market Review - August 2, 2013Weekly Market Review - August 2, 2013
Weekly Market Review - August 2, 2013
 
Monetary policy
Monetary policyMonetary policy
Monetary policy
 
Weekly Market Review - January 24, 2014
Weekly Market Review - January 24, 2014Weekly Market Review - January 24, 2014
Weekly Market Review - January 24, 2014
 
QNB Group India Economic Insight 2014
QNB Group India Economic Insight 2014QNB Group India Economic Insight 2014
QNB Group India Economic Insight 2014
 
Currency monthly 9th dec'16
Currency monthly   9th dec'16Currency monthly   9th dec'16
Currency monthly 9th dec'16
 
Advice for the Wise October 2016
Advice for the Wise   October 2016Advice for the Wise   October 2016
Advice for the Wise October 2016
 

Similar to ICICI Prudential AMC - Equity Market Outlook - August 2017

Factsheet for ICICI Prudential Mutual Fund
Factsheet for ICICI Prudential Mutual FundFactsheet for ICICI Prudential Mutual Fund
Factsheet for ICICI Prudential Mutual Fund
Anvi Sharma
 
ICICI Prudential AMC - Market Outlook - September 2017
ICICI Prudential AMC - Market Outlook - September 2017ICICI Prudential AMC - Market Outlook - September 2017
ICICI Prudential AMC - Market Outlook - September 2017
iciciprumf
 
E-UPDates—A Monthly Statistical Bulletin of Economic Indicators
E-UPDates—A Monthly Statistical Bulletin of Economic IndicatorsE-UPDates—A Monthly Statistical Bulletin of Economic Indicators
E-UPDates—A Monthly Statistical Bulletin of Economic Indicators
Ecofin Surge
 
BSL Fact Sheet June 2017
BSL Fact Sheet June 2017BSL Fact Sheet June 2017
BSL Fact Sheet June 2017
Bodhik
 
EUpDates—A Monthly Statistical Bulletin of Economic Indicators
EUpDates—A Monthly Statistical Bulletin of Economic IndicatorsEUpDates—A Monthly Statistical Bulletin of Economic Indicators
EUpDates—A Monthly Statistical Bulletin of Economic Indicators
Ecofin Surge
 
Equity Update - August 2019
Equity Update - August 2019Equity Update - August 2019
Equity Update - August 2019
iciciprumf
 
E-UPDates—A Monthly Statistical Bulletin
E-UPDates—A Monthly Statistical BulletinE-UPDates—A Monthly Statistical Bulletin
E-UPDates—A Monthly Statistical Bulletin
Ecofin Surge
 
ASEAN Macroeconomic Trends_ASEAN Economy Expected to Exhibit Steady Growth in...
ASEAN Macroeconomic Trends_ASEAN Economy Expected to Exhibit Steady Growth in...ASEAN Macroeconomic Trends_ASEAN Economy Expected to Exhibit Steady Growth in...
ASEAN Macroeconomic Trends_ASEAN Economy Expected to Exhibit Steady Growth in...
Kyna Tsai
 
Equity Update- August 2020
Equity Update- August 2020Equity Update- August 2020
Equity Update- August 2020
iciciprumf
 
Weekly Media Update_18_07_2022.pdf
Weekly Media Update_18_07_2022.pdfWeekly Media Update_18_07_2022.pdf
Weekly Media Update_18_07_2022.pdf
BalmerLawrie
 
Weekly media update 19 10_2020
Weekly media update 19 10_2020Weekly media update 19 10_2020
Weekly media update 19 10_2020
BalmerLawrie
 
Advice for the wise september '14
Advice for the wise september '14Advice for the wise september '14
Advice for the wise september '14
Karvy Private Wealth
 
Equity Update (August 2021) | ICICI Prudential Mutual Fund
Equity Update (August 2021) | ICICI Prudential Mutual FundEquity Update (August 2021) | ICICI Prudential Mutual Fund
Equity Update (August 2021) | ICICI Prudential Mutual Fund
iciciprumf
 
Weekly Media Update_18_09_2023.pdf
Weekly Media Update_18_09_2023.pdfWeekly Media Update_18_09_2023.pdf
Weekly Media Update_18_09_2023.pdf
BalmerLawrie
 
Factsheet for Birla Sun Life Mutual Fund- Wishfin
Factsheet for Birla Sun Life Mutual Fund- WishfinFactsheet for Birla Sun Life Mutual Fund- Wishfin
Factsheet for Birla Sun Life Mutual Fund- Wishfin
Anvi Sharma
 
Advice for the Wise - November, 2015
Advice for the Wise - November, 2015Advice for the Wise - November, 2015
Advice for the Wise - November, 2015
Karvy Private Wealth
 
Equity Update - June 2020
Equity Update - June 2020Equity Update - June 2020
Equity Update - June 2020
iciciprumf
 
Garanti macro report - Jan 2018
Garanti macro report - Jan 2018Garanti macro report - Jan 2018
Garanti macro report - Jan 2018
IQads
 
ICICI Prudential Mutual Fund | Equity update - June 2021
ICICI Prudential Mutual Fund | Equity update - June 2021ICICI Prudential Mutual Fund | Equity update - June 2021
ICICI Prudential Mutual Fund | Equity update - June 2021
iciciprumf
 

Similar to ICICI Prudential AMC - Equity Market Outlook - August 2017 (20)

Factsheet for ICICI Prudential Mutual Fund
Factsheet for ICICI Prudential Mutual FundFactsheet for ICICI Prudential Mutual Fund
Factsheet for ICICI Prudential Mutual Fund
 
ICICI Prudential AMC - Market Outlook - September 2017
ICICI Prudential AMC - Market Outlook - September 2017ICICI Prudential AMC - Market Outlook - September 2017
ICICI Prudential AMC - Market Outlook - September 2017
 
E-UPDates—A Monthly Statistical Bulletin of Economic Indicators
E-UPDates—A Monthly Statistical Bulletin of Economic IndicatorsE-UPDates—A Monthly Statistical Bulletin of Economic Indicators
E-UPDates—A Monthly Statistical Bulletin of Economic Indicators
 
BSL Fact Sheet June 2017
BSL Fact Sheet June 2017BSL Fact Sheet June 2017
BSL Fact Sheet June 2017
 
EUpDates—A Monthly Statistical Bulletin of Economic Indicators
EUpDates—A Monthly Statistical Bulletin of Economic IndicatorsEUpDates—A Monthly Statistical Bulletin of Economic Indicators
EUpDates—A Monthly Statistical Bulletin of Economic Indicators
 
Equity Update - August 2019
Equity Update - August 2019Equity Update - August 2019
Equity Update - August 2019
 
E-UPDates—A Monthly Statistical Bulletin
E-UPDates—A Monthly Statistical BulletinE-UPDates—A Monthly Statistical Bulletin
E-UPDates—A Monthly Statistical Bulletin
 
ASEAN Macroeconomic Trends_ASEAN Economy Expected to Exhibit Steady Growth in...
ASEAN Macroeconomic Trends_ASEAN Economy Expected to Exhibit Steady Growth in...ASEAN Macroeconomic Trends_ASEAN Economy Expected to Exhibit Steady Growth in...
ASEAN Macroeconomic Trends_ASEAN Economy Expected to Exhibit Steady Growth in...
 
Equity Update- August 2020
Equity Update- August 2020Equity Update- August 2020
Equity Update- August 2020
 
Weekly Media Update_18_07_2022.pdf
Weekly Media Update_18_07_2022.pdfWeekly Media Update_18_07_2022.pdf
Weekly Media Update_18_07_2022.pdf
 
Weekly media update 19 10_2020
Weekly media update 19 10_2020Weekly media update 19 10_2020
Weekly media update 19 10_2020
 
Advice for the wise september '14
Advice for the wise september '14Advice for the wise september '14
Advice for the wise september '14
 
Equity Update (August 2021) | ICICI Prudential Mutual Fund
Equity Update (August 2021) | ICICI Prudential Mutual FundEquity Update (August 2021) | ICICI Prudential Mutual Fund
Equity Update (August 2021) | ICICI Prudential Mutual Fund
 
Weekly Market Review, May 17, 2013
Weekly Market Review, May 17, 2013Weekly Market Review, May 17, 2013
Weekly Market Review, May 17, 2013
 
Weekly Media Update_18_09_2023.pdf
Weekly Media Update_18_09_2023.pdfWeekly Media Update_18_09_2023.pdf
Weekly Media Update_18_09_2023.pdf
 
Factsheet for Birla Sun Life Mutual Fund- Wishfin
Factsheet for Birla Sun Life Mutual Fund- WishfinFactsheet for Birla Sun Life Mutual Fund- Wishfin
Factsheet for Birla Sun Life Mutual Fund- Wishfin
 
Advice for the Wise - November, 2015
Advice for the Wise - November, 2015Advice for the Wise - November, 2015
Advice for the Wise - November, 2015
 
Equity Update - June 2020
Equity Update - June 2020Equity Update - June 2020
Equity Update - June 2020
 
Garanti macro report - Jan 2018
Garanti macro report - Jan 2018Garanti macro report - Jan 2018
Garanti macro report - Jan 2018
 
ICICI Prudential Mutual Fund | Equity update - June 2021
ICICI Prudential Mutual Fund | Equity update - June 2021ICICI Prudential Mutual Fund | Equity update - June 2021
ICICI Prudential Mutual Fund | Equity update - June 2021
 

More from iciciprumf

Debt Watch | ICICI Prudential Mutual Fund
Debt Watch | ICICI Prudential Mutual FundDebt Watch | ICICI Prudential Mutual Fund
Debt Watch | ICICI Prudential Mutual Fund
iciciprumf
 
Debt Watch | ICICI Prudential Mutual Fund
Debt Watch | ICICI Prudential Mutual FundDebt Watch | ICICI Prudential Mutual Fund
Debt Watch | ICICI Prudential Mutual Fund
iciciprumf
 
ICICI Prudential Large & Mid Cap Fund
ICICI Prudential Large & Mid Cap FundICICI Prudential Large & Mid Cap Fund
ICICI Prudential Large & Mid Cap Fund
iciciprumf
 
Debt Watch | ICICI Prudential Mutual Fund
Debt Watch | ICICI Prudential Mutual FundDebt Watch | ICICI Prudential Mutual Fund
Debt Watch | ICICI Prudential Mutual Fund
iciciprumf
 
Annual Outlook: 2024 | A Paradigm Shift
Annual Outlook: 2024 | A Paradigm ShiftAnnual Outlook: 2024 | A Paradigm Shift
Annual Outlook: 2024 | A Paradigm Shift
iciciprumf
 
Debt Watch | ICICI Prudential Mutual Fund
Debt Watch | ICICI Prudential Mutual FundDebt Watch | ICICI Prudential Mutual Fund
Debt Watch | ICICI Prudential Mutual Fund
iciciprumf
 
Debt Watch | ICICI Prudential Mutual Fund
Debt Watch | ICICI Prudential Mutual FundDebt Watch | ICICI Prudential Mutual Fund
Debt Watch | ICICI Prudential Mutual Fund
iciciprumf
 
Equity Valuations Perspective | January 2024
Equity Valuations Perspective | January 2024Equity Valuations Perspective | January 2024
Equity Valuations Perspective | January 2024
iciciprumf
 
Annual Outlook | 2024
Annual Outlook | 2024Annual Outlook | 2024
Annual Outlook | 2024
iciciprumf
 
Debt Watch | ICICI Prudential Mutual Fund
Debt Watch | ICICI Prudential Mutual FundDebt Watch | ICICI Prudential Mutual Fund
Debt Watch | ICICI Prudential Mutual Fund
iciciprumf
 
Debt Watch | ICICI Prudential Mutual Fund
Debt Watch | ICICI Prudential Mutual FundDebt Watch | ICICI Prudential Mutual Fund
Debt Watch | ICICI Prudential Mutual Fund
iciciprumf
 
Debt Watch | ICICI Prudential Mutual Fund
Debt Watch | ICICI Prudential Mutual FundDebt Watch | ICICI Prudential Mutual Fund
Debt Watch | ICICI Prudential Mutual Fund
iciciprumf
 
Monthly Market Outlook | Dec 2023
Monthly Market Outlook | Dec 2023Monthly Market Outlook | Dec 2023
Monthly Market Outlook | Dec 2023
iciciprumf
 
Debt Watch | ICICI Prudential Mutual Fund
Debt Watch | ICICI Prudential Mutual FundDebt Watch | ICICI Prudential Mutual Fund
Debt Watch | ICICI Prudential Mutual Fund
iciciprumf
 
Debt Watch | ICICI Prudential Mutual Fund
Debt Watch | ICICI Prudential Mutual FundDebt Watch | ICICI Prudential Mutual Fund
Debt Watch | ICICI Prudential Mutual Fund
iciciprumf
 
Monthly Market Outlook | November 2023
Monthly Market Outlook | November 2023Monthly Market Outlook | November 2023
Monthly Market Outlook | November 2023
iciciprumf
 
ICICI Prudential Equity Valuation Index | Nov 2023
ICICI Prudential Equity Valuation Index | Nov 2023 ICICI Prudential Equity Valuation Index | Nov 2023
ICICI Prudential Equity Valuation Index | Nov 2023
iciciprumf
 
Debt Watch | ICICI Prudential Mutual Fund
Debt Watch | ICICI Prudential Mutual FundDebt Watch | ICICI Prudential Mutual Fund
Debt Watch | ICICI Prudential Mutual Fund
iciciprumf
 
Debt Watch | ICICI Prudential Mutual Fund
Debt Watch | ICICI Prudential Mutual FundDebt Watch | ICICI Prudential Mutual Fund
Debt Watch | ICICI Prudential Mutual Fund
iciciprumf
 
Monthly Market Outlook | Oct 2023
Monthly Market Outlook | Oct 2023 Monthly Market Outlook | Oct 2023
Monthly Market Outlook | Oct 2023
iciciprumf
 

More from iciciprumf (20)

Debt Watch | ICICI Prudential Mutual Fund
Debt Watch | ICICI Prudential Mutual FundDebt Watch | ICICI Prudential Mutual Fund
Debt Watch | ICICI Prudential Mutual Fund
 
Debt Watch | ICICI Prudential Mutual Fund
Debt Watch | ICICI Prudential Mutual FundDebt Watch | ICICI Prudential Mutual Fund
Debt Watch | ICICI Prudential Mutual Fund
 
ICICI Prudential Large & Mid Cap Fund
ICICI Prudential Large & Mid Cap FundICICI Prudential Large & Mid Cap Fund
ICICI Prudential Large & Mid Cap Fund
 
Debt Watch | ICICI Prudential Mutual Fund
Debt Watch | ICICI Prudential Mutual FundDebt Watch | ICICI Prudential Mutual Fund
Debt Watch | ICICI Prudential Mutual Fund
 
Annual Outlook: 2024 | A Paradigm Shift
Annual Outlook: 2024 | A Paradigm ShiftAnnual Outlook: 2024 | A Paradigm Shift
Annual Outlook: 2024 | A Paradigm Shift
 
Debt Watch | ICICI Prudential Mutual Fund
Debt Watch | ICICI Prudential Mutual FundDebt Watch | ICICI Prudential Mutual Fund
Debt Watch | ICICI Prudential Mutual Fund
 
Debt Watch | ICICI Prudential Mutual Fund
Debt Watch | ICICI Prudential Mutual FundDebt Watch | ICICI Prudential Mutual Fund
Debt Watch | ICICI Prudential Mutual Fund
 
Equity Valuations Perspective | January 2024
Equity Valuations Perspective | January 2024Equity Valuations Perspective | January 2024
Equity Valuations Perspective | January 2024
 
Annual Outlook | 2024
Annual Outlook | 2024Annual Outlook | 2024
Annual Outlook | 2024
 
Debt Watch | ICICI Prudential Mutual Fund
Debt Watch | ICICI Prudential Mutual FundDebt Watch | ICICI Prudential Mutual Fund
Debt Watch | ICICI Prudential Mutual Fund
 
Debt Watch | ICICI Prudential Mutual Fund
Debt Watch | ICICI Prudential Mutual FundDebt Watch | ICICI Prudential Mutual Fund
Debt Watch | ICICI Prudential Mutual Fund
 
Debt Watch | ICICI Prudential Mutual Fund
Debt Watch | ICICI Prudential Mutual FundDebt Watch | ICICI Prudential Mutual Fund
Debt Watch | ICICI Prudential Mutual Fund
 
Monthly Market Outlook | Dec 2023
Monthly Market Outlook | Dec 2023Monthly Market Outlook | Dec 2023
Monthly Market Outlook | Dec 2023
 
Debt Watch | ICICI Prudential Mutual Fund
Debt Watch | ICICI Prudential Mutual FundDebt Watch | ICICI Prudential Mutual Fund
Debt Watch | ICICI Prudential Mutual Fund
 
Debt Watch | ICICI Prudential Mutual Fund
Debt Watch | ICICI Prudential Mutual FundDebt Watch | ICICI Prudential Mutual Fund
Debt Watch | ICICI Prudential Mutual Fund
 
Monthly Market Outlook | November 2023
Monthly Market Outlook | November 2023Monthly Market Outlook | November 2023
Monthly Market Outlook | November 2023
 
ICICI Prudential Equity Valuation Index | Nov 2023
ICICI Prudential Equity Valuation Index | Nov 2023 ICICI Prudential Equity Valuation Index | Nov 2023
ICICI Prudential Equity Valuation Index | Nov 2023
 
Debt Watch | ICICI Prudential Mutual Fund
Debt Watch | ICICI Prudential Mutual FundDebt Watch | ICICI Prudential Mutual Fund
Debt Watch | ICICI Prudential Mutual Fund
 
Debt Watch | ICICI Prudential Mutual Fund
Debt Watch | ICICI Prudential Mutual FundDebt Watch | ICICI Prudential Mutual Fund
Debt Watch | ICICI Prudential Mutual Fund
 
Monthly Market Outlook | Oct 2023
Monthly Market Outlook | Oct 2023 Monthly Market Outlook | Oct 2023
Monthly Market Outlook | Oct 2023
 

Recently uploaded

April 2024 Nostalgia Products Newsletter
April 2024 Nostalgia Products NewsletterApril 2024 Nostalgia Products Newsletter
April 2024 Nostalgia Products Newsletter
NathanBaughman3
 
VAT Registration Outlined In UAE: Benefits and Requirements
VAT Registration Outlined In UAE: Benefits and RequirementsVAT Registration Outlined In UAE: Benefits and Requirements
VAT Registration Outlined In UAE: Benefits and Requirements
uae taxgpt
 
Memorandum Of Association Constitution of Company.ppt
Memorandum Of Association Constitution of Company.pptMemorandum Of Association Constitution of Company.ppt
Memorandum Of Association Constitution of Company.ppt
seri bangash
 
Sustainability: Balancing the Environment, Equity & Economy
Sustainability: Balancing the Environment, Equity & EconomySustainability: Balancing the Environment, Equity & Economy
Sustainability: Balancing the Environment, Equity & Economy
Operational Excellence Consulting
 
CADAVER AS OUR FIRST TEACHER anatomt in your.pptx
CADAVER AS OUR FIRST TEACHER anatomt in your.pptxCADAVER AS OUR FIRST TEACHER anatomt in your.pptx
CADAVER AS OUR FIRST TEACHER anatomt in your.pptx
fakeloginn69
 
Cree_Rey_BrandIdentityKit.PDF_PersonalBd
Cree_Rey_BrandIdentityKit.PDF_PersonalBdCree_Rey_BrandIdentityKit.PDF_PersonalBd
Cree_Rey_BrandIdentityKit.PDF_PersonalBd
creerey
 
一比一原版加拿大渥太华大学毕业证(uottawa毕业证书)如何办理
一比一原版加拿大渥太华大学毕业证(uottawa毕业证书)如何办理一比一原版加拿大渥太华大学毕业证(uottawa毕业证书)如何办理
一比一原版加拿大渥太华大学毕业证(uottawa毕业证书)如何办理
taqyed
 
Skye Residences | Extended Stay Residences Near Toronto Airport
Skye Residences | Extended Stay Residences Near Toronto AirportSkye Residences | Extended Stay Residences Near Toronto Airport
Skye Residences | Extended Stay Residences Near Toronto Airport
marketingjdass
 
Discover the innovative and creative projects that highlight my journey throu...
Discover the innovative and creative projects that highlight my journey throu...Discover the innovative and creative projects that highlight my journey throu...
Discover the innovative and creative projects that highlight my journey throu...
dylandmeas
 
Attending a job Interview for B1 and B2 Englsih learners
Attending a job Interview for B1 and B2 Englsih learnersAttending a job Interview for B1 and B2 Englsih learners
Attending a job Interview for B1 and B2 Englsih learners
Erika906060
 
Buy Verified PayPal Account | Buy Google 5 Star Reviews
Buy Verified PayPal Account | Buy Google 5 Star ReviewsBuy Verified PayPal Account | Buy Google 5 Star Reviews
Buy Verified PayPal Account | Buy Google 5 Star Reviews
usawebmarket
 
The Parable of the Pipeline a book every new businessman or business student ...
The Parable of the Pipeline a book every new businessman or business student ...The Parable of the Pipeline a book every new businessman or business student ...
The Parable of the Pipeline a book every new businessman or business student ...
awaisafdar
 
Putting the SPARK into Virtual Training.pptx
Putting the SPARK into Virtual Training.pptxPutting the SPARK into Virtual Training.pptx
Putting the SPARK into Virtual Training.pptx
Cynthia Clay
 
ENTREPRENEURSHIP TRAINING.ppt for graduating class (1).ppt
ENTREPRENEURSHIP TRAINING.ppt for graduating class (1).pptENTREPRENEURSHIP TRAINING.ppt for graduating class (1).ppt
ENTREPRENEURSHIP TRAINING.ppt for graduating class (1).ppt
zechu97
 
amptalk_RecruitingDeck_english_2024.06.05
amptalk_RecruitingDeck_english_2024.06.05amptalk_RecruitingDeck_english_2024.06.05
amptalk_RecruitingDeck_english_2024.06.05
marketing317746
 
FINAL PRESENTATION.pptx12143241324134134
FINAL PRESENTATION.pptx12143241324134134FINAL PRESENTATION.pptx12143241324134134
FINAL PRESENTATION.pptx12143241324134134
LR1709MUSIC
 
Tata Group Dials Taiwan for Its Chipmaking Ambition in Gujarat’s Dholera
Tata Group Dials Taiwan for Its Chipmaking Ambition in Gujarat’s DholeraTata Group Dials Taiwan for Its Chipmaking Ambition in Gujarat’s Dholera
Tata Group Dials Taiwan for Its Chipmaking Ambition in Gujarat’s Dholera
Avirahi City Dholera
 
20240425_ TJ Communications Credentials_compressed.pdf
20240425_ TJ Communications Credentials_compressed.pdf20240425_ TJ Communications Credentials_compressed.pdf
20240425_ TJ Communications Credentials_compressed.pdf
tjcomstrang
 
The Influence of Marketing Strategy and Market Competition on Business Perfor...
The Influence of Marketing Strategy and Market Competition on Business Perfor...The Influence of Marketing Strategy and Market Competition on Business Perfor...
The Influence of Marketing Strategy and Market Competition on Business Perfor...
Adam Smith
 
Cracking the Workplace Discipline Code Main.pptx
Cracking the Workplace Discipline Code Main.pptxCracking the Workplace Discipline Code Main.pptx
Cracking the Workplace Discipline Code Main.pptx
Workforce Group
 

Recently uploaded (20)

April 2024 Nostalgia Products Newsletter
April 2024 Nostalgia Products NewsletterApril 2024 Nostalgia Products Newsletter
April 2024 Nostalgia Products Newsletter
 
VAT Registration Outlined In UAE: Benefits and Requirements
VAT Registration Outlined In UAE: Benefits and RequirementsVAT Registration Outlined In UAE: Benefits and Requirements
VAT Registration Outlined In UAE: Benefits and Requirements
 
Memorandum Of Association Constitution of Company.ppt
Memorandum Of Association Constitution of Company.pptMemorandum Of Association Constitution of Company.ppt
Memorandum Of Association Constitution of Company.ppt
 
Sustainability: Balancing the Environment, Equity & Economy
Sustainability: Balancing the Environment, Equity & EconomySustainability: Balancing the Environment, Equity & Economy
Sustainability: Balancing the Environment, Equity & Economy
 
CADAVER AS OUR FIRST TEACHER anatomt in your.pptx
CADAVER AS OUR FIRST TEACHER anatomt in your.pptxCADAVER AS OUR FIRST TEACHER anatomt in your.pptx
CADAVER AS OUR FIRST TEACHER anatomt in your.pptx
 
Cree_Rey_BrandIdentityKit.PDF_PersonalBd
Cree_Rey_BrandIdentityKit.PDF_PersonalBdCree_Rey_BrandIdentityKit.PDF_PersonalBd
Cree_Rey_BrandIdentityKit.PDF_PersonalBd
 
一比一原版加拿大渥太华大学毕业证(uottawa毕业证书)如何办理
一比一原版加拿大渥太华大学毕业证(uottawa毕业证书)如何办理一比一原版加拿大渥太华大学毕业证(uottawa毕业证书)如何办理
一比一原版加拿大渥太华大学毕业证(uottawa毕业证书)如何办理
 
Skye Residences | Extended Stay Residences Near Toronto Airport
Skye Residences | Extended Stay Residences Near Toronto AirportSkye Residences | Extended Stay Residences Near Toronto Airport
Skye Residences | Extended Stay Residences Near Toronto Airport
 
Discover the innovative and creative projects that highlight my journey throu...
Discover the innovative and creative projects that highlight my journey throu...Discover the innovative and creative projects that highlight my journey throu...
Discover the innovative and creative projects that highlight my journey throu...
 
Attending a job Interview for B1 and B2 Englsih learners
Attending a job Interview for B1 and B2 Englsih learnersAttending a job Interview for B1 and B2 Englsih learners
Attending a job Interview for B1 and B2 Englsih learners
 
Buy Verified PayPal Account | Buy Google 5 Star Reviews
Buy Verified PayPal Account | Buy Google 5 Star ReviewsBuy Verified PayPal Account | Buy Google 5 Star Reviews
Buy Verified PayPal Account | Buy Google 5 Star Reviews
 
The Parable of the Pipeline a book every new businessman or business student ...
The Parable of the Pipeline a book every new businessman or business student ...The Parable of the Pipeline a book every new businessman or business student ...
The Parable of the Pipeline a book every new businessman or business student ...
 
Putting the SPARK into Virtual Training.pptx
Putting the SPARK into Virtual Training.pptxPutting the SPARK into Virtual Training.pptx
Putting the SPARK into Virtual Training.pptx
 
ENTREPRENEURSHIP TRAINING.ppt for graduating class (1).ppt
ENTREPRENEURSHIP TRAINING.ppt for graduating class (1).pptENTREPRENEURSHIP TRAINING.ppt for graduating class (1).ppt
ENTREPRENEURSHIP TRAINING.ppt for graduating class (1).ppt
 
amptalk_RecruitingDeck_english_2024.06.05
amptalk_RecruitingDeck_english_2024.06.05amptalk_RecruitingDeck_english_2024.06.05
amptalk_RecruitingDeck_english_2024.06.05
 
FINAL PRESENTATION.pptx12143241324134134
FINAL PRESENTATION.pptx12143241324134134FINAL PRESENTATION.pptx12143241324134134
FINAL PRESENTATION.pptx12143241324134134
 
Tata Group Dials Taiwan for Its Chipmaking Ambition in Gujarat’s Dholera
Tata Group Dials Taiwan for Its Chipmaking Ambition in Gujarat’s DholeraTata Group Dials Taiwan for Its Chipmaking Ambition in Gujarat’s Dholera
Tata Group Dials Taiwan for Its Chipmaking Ambition in Gujarat’s Dholera
 
20240425_ TJ Communications Credentials_compressed.pdf
20240425_ TJ Communications Credentials_compressed.pdf20240425_ TJ Communications Credentials_compressed.pdf
20240425_ TJ Communications Credentials_compressed.pdf
 
The Influence of Marketing Strategy and Market Competition on Business Perfor...
The Influence of Marketing Strategy and Market Competition on Business Perfor...The Influence of Marketing Strategy and Market Competition on Business Perfor...
The Influence of Marketing Strategy and Market Competition on Business Perfor...
 
Cracking the Workplace Discipline Code Main.pptx
Cracking the Workplace Discipline Code Main.pptxCracking the Workplace Discipline Code Main.pptx
Cracking the Workplace Discipline Code Main.pptx
 

ICICI Prudential AMC - Equity Market Outlook - August 2017

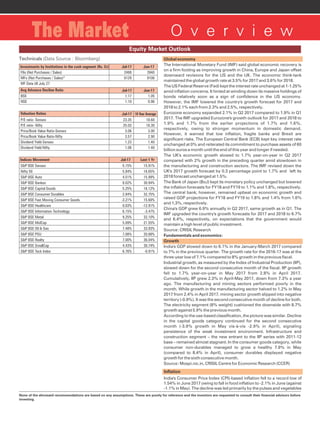
  • 1. Equity Market Outlook O v e r v i e wThe Market Technicals (Data Source : Bloomberg) Jul-17 Jun-17Investments by Institutions in the cash segment (Rs. Cr) Avg Advance Decline Ratio Valuation Ratios Jul-17 Jun-17 Jul-17 10 Year Average Jul-17Indices Movement Last 1 Yr None of the aforesaid recommendations are based on any assumptions. These are purely for reference and the investors are requested to consult their financial advisors before investing. Global economy The International Monetary Fund (IMF) said global economic recovery is on a firm footing as improving growth in China, Europe and Japan offset downward revisions for the US and the UK. The economic think-tank maintained the global growth rate at 3.5% for 2017 and 3.6% for 2018. The US Federal Reserve (Fed) kept the interest rate unchanged at 1-1.25% amid inflation concerns. It hinted at winding down its massive holdings of bonds relatively soon as a sign of confidence in the US economy. However, the IMF lowered the country's growth forecast for 2017 and 2018 to 2.1% each from 2.3% and 2.5%, respectively. Eurozone economy expanded 2.1% in Q2 2017 compared to 1.9% in Q1 2017. The IMF upgraded Eurozone's growth outlook for 2017 and 2018 to 1.9% and 1.7% from the earlier projections of 1.7% and 1.6%, respectively, owing to stronger momentum in domestic demand. However, it warned that low inflation, fragile banks and Brexit are significant risks. The European Central Bank (ECB) kept key interest rate unchanged at 0% and reiterated its commitment to purchase assets of 60 billion euros a month until the end of this year and longer if needed. The UK's economic growth slowed to 1.7% year-on-year in Q2 2017 compared with 2% growth in the preceding quarter amid slowdown in the manufacturing and construction sectors. The IMF revised down the UK's 2017 growth forecast by 0.3 percentage point to 1.7% and left its 2018 forecast unchanged at 1.5%. The Bank of Japan (BoJ) kept its monetary policy unchanged but lowered the inflation forecasts for FY18 and FY19 to 1.1% and 1.8%, respectively. The central bank, however, remained upbeat on economic growth and raised GDP projections for FY18 and FY19 to 1.8% and 1.4% from 1.6% and 1.3%, respectively. China's GDP grew 6.9% annually in Q2 2017, same growth as in Q1. The IMF upgraded the country's growth forecasts for 2017 and 2018 to 6.7% and 6.4%, respectively, on expectations that the government would maintain a high level of public investment. Source: CRISIL Research Fundamentals and economics: Growth India's GDP slowed down to 6.1% in the January-March 2017 compared to 7% in the previous quarter. The growth rate for the 2016-17 was at the three-year low of 7.1% compared to 8% growth in the previous fiscal. Industrial growth, as measured by the Index of Industrial Production (IIP), slowed down for the second consecutive month of the fiscal. IIP growth fell to 1.7% year-on-year in May 2017 from 2.8% in April 2017. Cumulatively, IIP grew 2.3% in April-May 2017, down from 7.3% a year ago. The manufacturing and mining sectors performed poorly in the month. While growth in the manufacturing sector halved to 1.2% in May 2017 from 2.4% in April 2017, mining sector growth slipped into negative territory (-0.9%). It was the second consecutive month of decline for both. The electricity segment (8% weight) cushioned the downside with 8.7% growth against 5.9% the previous month. According to the use-based classification, the picture was similar. Decline in the capital goods category continued for the second consecutive month (-3.9% growth in May vis-à-vis -2.9% in April), signaling persistence of the weak investment environment. Infrastructure and construction segment – the new entrant to the IIP series with 2011-12 base – remained almost stagnant. In the consumer goods category, while consumer non-durables managed to grow a healthy 7.9% in May (compared to 8.4% in April), consumer durables displayed negative growth for the sixth consecutive month. Source: Mospi.nic.in, CRISIL Centre for Economic Research (CCER) BSE 1.17 1.05 NSE 1.10 0.96 FIIs (Net Purchases / Sales) 2488 3940 MFs (Net Purchases / Sales)* 8129 9106 MF Data till July 27 P/E ratio- Sensex 23.35 18.60 P/E ratio- Nifty 25.02 18.30 Price/Book Value Ratio-Sensex 3.06 3.00 Price/Book Value Ratio-Nifty 3.57 2.90 Dividend Yield-Sensex 1.23 1.40 Dividend Yield-Nifty 1.06 1.40 S&P BSE Sensex 5.15% 15.91% Nifty 50 5.84% 16.65% S&P BSE Auto 4.51% 15.99% S&P BSE Bankex 8.02% 30.94% S&P BSE Capital Goods 5.25% 16.12% S&P BSE Consumer Durables 2.84% 32.75% S&P BSE Fast Moving Consumer Goods -3.21% 15.68% S&P BSE Healthcare 0.03% -12.91% S&P BSE Information Technology 6.15% -3.47% S&P BSE Metal 9.25% 32.10% S&P BSE MidCap 5.09% 21.55% S&P BSE Oil & Gas 7.48% 33.93% S&P BSE PSU 7.08% 20.88% S&P BSE Realty 7.00% 36.04% S&P BSE SmallCap 4.43% 30.74% S&P BSE Teck Index 6.76% -0.91% Inflation India's Consumer Price Index (CPI)-based inflation fell to a record low of 1.54% in June 2017 owing to fall in food inflation to -2.1% in June (against -1.1% in May). The decline was led primarily by the pulses and vegetables
  • 2. O v e r v i e wThe Market Equity Market Outlook None of the aforesaid recommendations are based on any assumptions. These are purely for reference and the investors are requested to consult their financial advisors before investing. Currency The rupee ended stronger against the US dollar in July, with the exchange rate settling at Rs 64.18 per dollar on July 31, 2017 as against Rs 64.58 per dollar on June 30, 2017. Periodic dollar sales by foreign banks for foreign institutional investor inflows into domestic equities gave the rupee support. The local currency was aided by the US Fed Chair's dovish Congressional testimony mid-month. The dollar weakened further following the European Central Bank's (ECB's) monetary policy decision, thereby benefitting the rupee. Comments from US Fed officials towards the end of the month led to diminished expectation of another interest rate hike in this calendar year, and strengthened sentiment for the rupee. Further rupee gains were erased by intermittent dollar demand from state-owned banks. Gains registered by the dollar following the Bank of Japan's (BoJ's) monetary policy decision put the rupee under pressure briefly. The rupee was also pulled down by reports of geopolitical tensions between India and China and by North Korea's announcement that it had test-fired an intercontinental ballistic missile. Source: CRISIL Research Market sentiment Flows Foreign institutional investors (FIIs) continued to be buyers of equities. FIIs bought equities worth Rs 24.88 billion in July 2017 compared to buying of Rs 39.40 billion in June. Mutual funds also remained buyers of equities in July 2017. They bought equities worth Rs 81.29 billion in July (until July 27) compared with Rs 91.06 billion in June 2017. Deficit India's Fiscal Deficit touched Rs 4.42 trillion ($68.88 billion) during April- June period or 80.8% of the budgeted target for the current fiscal year that ends in March; the Fiscal Deficit was 61.1% of the full-year target during the same period a year ago. India's Current Account Deficit (CAD) surged to $3.4 billion, or 0.6% of GDP, in the fourth quarter of 2016-17 as against $0.3 billion (0.1% of GDP) in the same quarter last year but narrowed from $8.0 billion (1.4% of GDP) in the preceding quarter. The widening of CAD year-on-year was primarily on account of a higher trade deficit ($29.7 billion) brought about by a larger increase in merchandise imports relative to exports. Net services receipts increased year-on-year owing to a rise in net earnings from travel, transport, construction and other business services. India's exports grew 4.4% year-on-year to $23.5 billion in June 2017 compared to 8.3% in May 2017. Growth in exports of non-oil goods also declined, to 4.5% from 6.6% in May. Export growth was negative in 15 of top 30 commodities, the most prominent being gems & jewellery (-2.7%), pharmaceuticals (-2.2%) and textiles (-1.4%). However, export growth was robust in engineering goods (14.8%), organic and inorganic chemicals (13.2%) and rice (27.3%). Imports grew 19% year-on-year in June 2017 to $36.5 billion, compared to 33.1% in the previous month. The largest rise in imports was seen in precious and semi-precious stones (86.3%) and electronic goods (24.2%). Imports of investment-related goods rose 7.6%, after declining 0.9% in the previous month. The trend of imports growing faster than exports is expected to continue this fiscal, as domestic demand strengthens. Accordingly, the trade deficit was $12.9 billion in June 2017 compared to $13.84 billion in May 2017. Source: RBI Brent Brent crude oil prices rose sharply by 8% to close the month at $52.65 per barrel on July 31 vis-à-vis 47.92 per barrel on June 30, 2017 on reports of decline in US crude oil inventories. Fresh pledges from Saudi Arabia and Nigeria to reduce crude oil exports and limit output, respectively, also led to price gains. Some gains were erased on news that Russia had ruled out proposals to deepen the global production cuts and reports of higher monthly exports from OPEC. Source: CCER Source: Mospi.nic.in, CCER Source: SEBI category where inflation was down at -21.9% and -16.5%, respectively. Excluding these categories, food inflation printed at 1.3% compared with 1.6% in May. This suggests inflation has been declining in other food categories as well – including cereals (down 40 bps to 4.4%), eggs (down 80 bps to nearly zero), milk (down 40 bps to 4.1%), edible oils (down 36 bps to 2.3%) and sugar (down 110 bps to 8.7%). Fuel inflation eased further in June as global crude oil prices fell nearly 3% year-on-year and 8% month-on-month, while the rupee stayed stable. Fuel inflation slowed to 4.3% in June from 6.2% in May. Within this category, inflation in fuel and light fell to 4.5% from 5.5%, while in petrol and diesel, it fell to 3.3% from 8.8%. Core inflation CPI excluding food, fuel and light, petrol and diesel) was unchanged from the previous month, at 4.1%. Some easing in categories such as household goods and services, education, transport and communication was offset by higher inflation in personal care and recreation services. Wholesale Price Index (WPI) slipped to a 14-month low of 0.90% in June 2017 as food inflation remained negative. Market Performance Indian equity indices extended their record-breaking run in July. S&P BSE Sensex hit a fresh record high of 32,515 and Nifty 50 touched the 10000- mark for the first time in 21 years. Benchmarks gained over 5% in the month. Easing worries over major disruption following the implementation of the Goods and Services Tax (GST) on July 1, 2017 and positive global cues brought in sharp gains. -1.00 0.00 1.00 2.00 3.00 4.00 5.00 6.00 7.00 CPI WPI Inflation -30,000 -20,000 -10,000 0 10,000 20,000 30,000 40,000 Cr. FII Flows -2,000 0 2,000 4,000 6,000 8,000 10,000 12,000 14,000 16,000 MF Flows
  • 3. O v e r v i e wThe Market None of the aforesaid recommendations are based on any assumptions. These are purely for reference and the investors are requested to consult their financial advisors before investing. Our Recommendations Investors may continue with their SIPs in pure equity funds. For new investors we recommend SIP in Dynamic Asset Allocation Funds. Volatility due to global factors may continue to stay in the near term. Investors with an intent to benefit from volatility are recommended for lump-sum investments in dynamic asset allocation funds. For tactical allocation, investors could consider thematic funds which focus on infrastructure theme. ICICI Prudential Value Discovery Fund ICICI Prudential Top 100 Fund ICICI Prudential Multicap Fund ICICI Prudential Focused Bluechip Equity Fund ICICI Prudential Select Large Cap Fund Pure Equity Funds These funds are positioned aggressively to gain from recovery in the economy and commodity prices. These funds aim to generate long term wealth creation. Our Recommendations – Equity Schemes Asset Allocation Funds ICICI Prudential Balanced Advantage Fund ICICI Prudential Balanced Fund ICICI Prudential Dynamic Plan Theme-based funds ICICI Prudential Infrastructure Fund Investors could invest in this thematic fund for tactical allocation. It would be a high risk investment option. These funds aim to benefit from volatility and can be suitable for investors aiming to participate in equities with lower volatility. Equity valuations show that the market valuations are in the zone where investors are recommended to invest in funds with low net equity levels within the dynamic asset allocation fund category. Equity Valuation Index Equity valuation index is calculated by assigning equal weights to Price to equity (PE), Price to book (PB), G-Sec*PE and Market Cap to Gross Domestic Product (GDP) Equity Valuation Index Market Outlook and Triggers MSCI Emerging Market Index outperformed MSCI Developed Market Index by 3%. This was the seventh consecutive month of outperformance. India with +5% had the best month on year-to-date (YTD) driven by smooth GST implementation, good progress of monsoons and expectations of rate cuts. Even after the recent run-up, we continue to believe that the equity market is in mid-cycle due to parameters such as credit growth, earnings growth, inflation and capacity utilisation, which appear to be close to cyclical lows. Several reforms / actions such as Goods and Services Tax (GST), infrastructure thrust from the government and financial inclusion are in place that is likely to support higher growth. However, the same is subject to an earnings upgrade cycle, which is critical for the current valuations to sustain and the volatility that may arise due to uncertainty of global events. The GST reform implemented on July 1, 2017, is expected to improve the ease of doing business in India as multiple taxes reduce and further support inter-state business. The political stability gives high visibility to policy continuity well beyond 2019. This has brought-up India's position on the global stage as an attractive destination for investment. The same is also reflected in the FII flows to India. In this mid-cycle, investors are recommended to invest in dynamic asset allocation funds as they are well-positioned to benefit from market-cycles over long-term. Investors looking to take exposure in pure-equity funds for long-term could also consider investing systematically in ICICI Prudential Value Discovery Fund. For thematic exposure, investors could consider ICICI Prudential Infrastructure Fund. The market was mainly boosted by hopes of interest rate cut by the Reserve Bank of India (RBI) amid falling retail inflation and discouraging industrial output numbers. Actions remained stock-specific owing to quarterly earnings. More gains were seen owing to sustained buying by domestic institutional investors (DIIs) and FIIs. Positive global cues including dovish comments from the US Federal Reserve (Fed), renewed interest in US technology stocks and encouraging economic cues from China including growth in domestic product and industrial output data augured well for the indices. More gains were, however, capped owing to a sharp fall in the index heavyweight after the GST Council decided to raise cess on cigarettes in a bid to reduce profiteering by companies. Disappointing quarterly earning numbers from some companies, emergence of profit booking after recent gains and expiry of the July futures and options contract weighed on the indices. Worries that the global central banks could soon scale back some of their stimulus measures dented global risk appetite and put some pressure on domestic equities. Most of the S&P BSE Sectoral indices ended higher in July 2017. S&P BSE Metal index was the top gainer – up 9.25% month-on-month (MoM) amid strong global metal prices and positive cues from China. Interest rate sensitive stocks rose amid expectations of an interest rate cut. S&P BSE BANKEX, S&P BSE Realty and S&P BSE Auto surged MoM by 8%, 7% and 4.5%, respectively. Strong buying interest was seen in the oil & gas and IT stocks; S&P BSE Oil and Gas and S&P BSE IT rose 7.48% and 6.15%, respectively. S&P BSE FMCG was the only laggard – down over 3% after the increase in cess on cigarettes pulled down the index major. Source: NSE, BSE
  • 4. MutualFundinvestmentsaresubjecttomarketrisks,readallschemerelateddocumentscarefully. Disclaimer: In the preparation of the material contained in this document, the Asset Management Company (AMC) has used information that is publicly available, including information developed in-house. Some of the material used in the document may have been obtained from members/persons other than the AMC and/or its affiliates and which may have been made available to the AMC and/or to its affiliates. Information gathered and material used in this document is believed to be from reliable sources. The AMC however does not warrant the accuracy, reasonableness and / or completeness of any information. We haveincludedstatements/opinions/recommendationsinthisdocument,whichcontainwords,orphrasessuchas“will”,“expect”,“should”,“believe”andsimilarexpressionsorvariationsofsuchexpressions that are “forward looking statements”. Actual results may differ materially from those suggested by the forward looking statements due to risk or uncertainties associated with our expectations with respect to, but not limited to, exposure to market risks, general economic and political conditions in India and other countries globally, which have an impact on our services and / or investments, the monetary and interest policiesofIndia,inflation,deflation,unanticipatedturbulenceininterestrates,foreignexchangerates, equity prices or other rates or prices etc. The AMC (including its affiliates), the Mutual Fund, the trust and any of its officers, directors, personnel and employees, shall not be liable for any loss, damage of any nature, including but not limited to direct, indirect, punitive, special, exemplary, consequential, as also any loss of profit in any way arising from the use of this material in any manner. The recipient alone shall be fully responsible/are liable for any decision taken on this material. • Long term wealth creation solution. • A diversified equity fund that aims to generate returns by investing in stocks with attractive valuations. * Investors should consult their financial advisers if in doubt about whether the product is suitable for them. ICICI Prudential Value Discovery Fund is suitable for investors who are seeking*: Riskometer Investors understand that their principal will be at moderately high risk Low Moderately Low ModeratelyHigh High Low High Moderate • Long term wealth creation solution • A focused large cap equity fund that aims for growth by investing in companies in the large cap category. * Investors should consult their financial advisers if in doubt about whether the product is suitable for them. ICICI Prudential Foucsed Bluechip Equity Fund is suitable for investors who are seeking*: Riskometer Investors understand that their principalwillbeatmoderatelyhighrisk Low Moderately Low Moderately High High Low High Moderate • Long term wealth creation solution • An equity fund that aims for growth by investing in equity and derivatives. * Investors should consult their financial advisers if in doubt about whether the product is suitable for them. ICICI Prudential Balanced Advantage Fund is suitable for investors who are seeking*: Riskometer Investors understand that their principal will be at moderately high risk Low Moderately Low Moderately High High Low High Moderate • Long term wealth creation solution • An equity fund that aims to provide long term capital appreciation by predominantly investing in equity and equity related securities. * Investors should consult their financial advisers if in doubt about whether the product is suitable for them. ICICI Prudential Top 100 Fund is suitable for investors who are seeking*: Riskometer Investors understand that their principal will be at moderately high risk Low Moderately Low ModeratelyHigh High Low High Moderate Investors understand that their principal will be at moderately high risk • Long term wealth creation solution • A balanced fund aiming for long term capital appreciation and current income by investing in equity as well as fixed income securities. * Investors should consult their financial advisers if in doubt about whether the product is suitable for them. ICICI Prudential Balanced Fund is suitable for investors who are seeking*: Riskometer Low Moderately Low ModeratelyHigh High Low High Moderate
  • 5. • Long term wealth creation solution • An equity fund that aims to generate capital appreciation by investing in equity and equity related securities of companies forming part of S&P BSE 100 Index. * Investors should consult their financial advisers if in doubt about whether the product is suitable for them. ICICI Prudential Select Large Cap Fund is suitable for investors who are seeking*: Riskometer Investors understand that their principal will be at moderately high risk Low Moderately Low ModeratelyHigh High Low High Moderate Investors understand that their principal will be at moderately high risk • Long term wealth creation solution • A growth oriented equity fund that invests in equity and equity related securities of core sectors and associated feeder industries. * Investors should consult their financial advisers if in doubt about whether the product is suitable for them. ICICI Prudential Multicap Fund is suitable for investors who are seeking*: Riskometer Low Moderately Low ModeratelyHigh High Low High Moderate Investors understand that their principal will be at moderately high risk • Long term wealth creation solution • A diversified equity fund that aims for growth by investing in equity and debt (for defensive considerations) * Investors should consult their financial advisers if in doubt about whether the product is suitable for them. ICICI Prudential Dynamic Plan is suitable for investors who are seeking*: Riskometer Low Moderately Low ModeratelyHigh High Low High Moderate • Long term wealth creation solution. • An equity fund that aims for growth by primarily investing in securities of companies belonging to infrastructure and allied sectors. * Investors should consult their financial advisers if in doubt about whether the product is suitable for them. ICICI Prudentinal Infrastructure Fund is suitable for investors who are seeking*: Riskometer Investors understand that their principal will be at high risk Low Moderately Low ModeratelyHigh High Low High Moderate