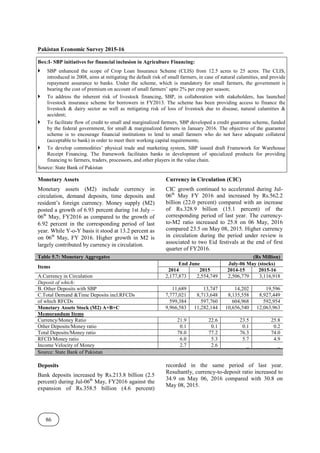
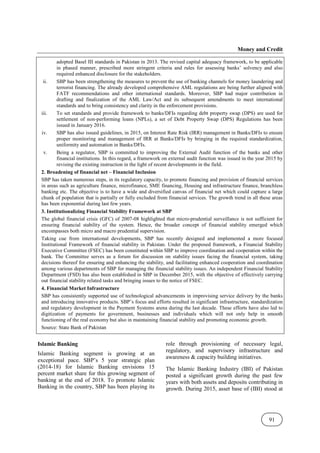
- Monetary policy aims to control money supply, contain inflation, stabilize exchange rates, and maintain balance of payments equilibrium. This helps support macroeconomic stability.
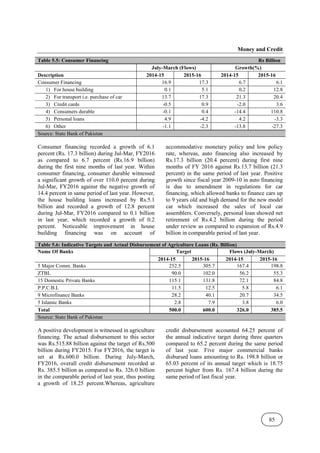
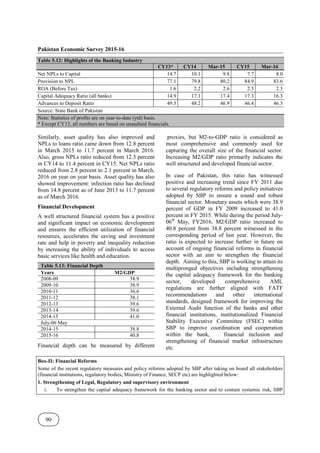
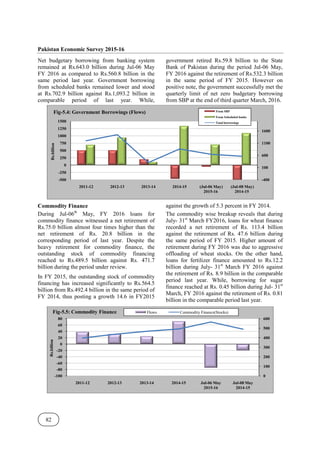
- Pakistan's economy grew reasonably well in recent years, with GDP growth reaching 4.04% in FY2015 and 4.71% in FY2016, despite slower global growth and economic challenges. Private sector credit expansion has helped manufacturing and industry.
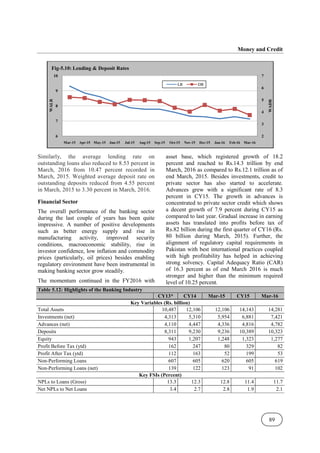
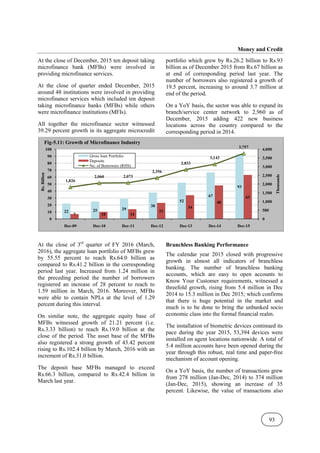
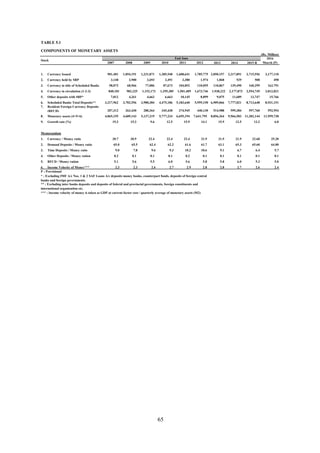
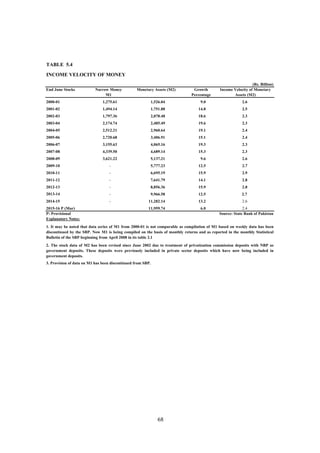
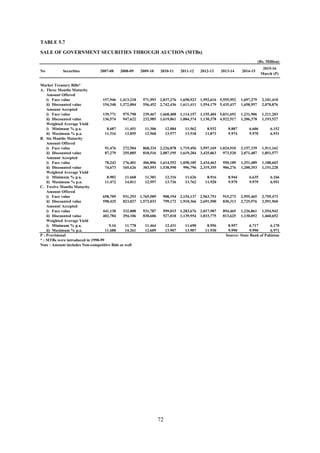
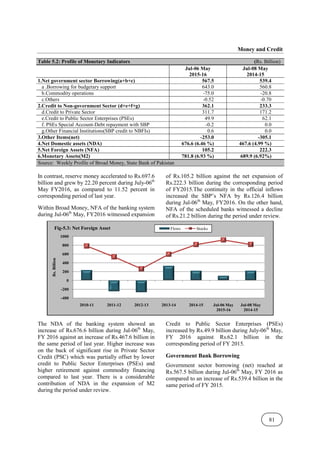
- Broad money supply (M2) increased 6.93% during the period as net domestic assets grew. However, net foreign assets only saw modest growth as scheduled bank foreign assets declined slightly while SBP foreign assets grew.

![Pakistan Economic Survey 2015-16
84
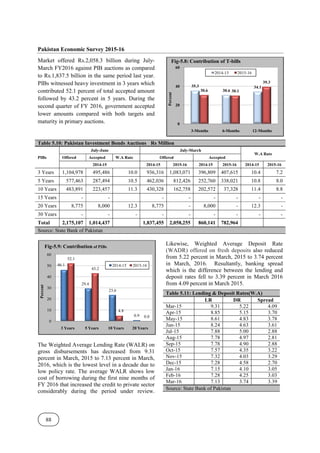
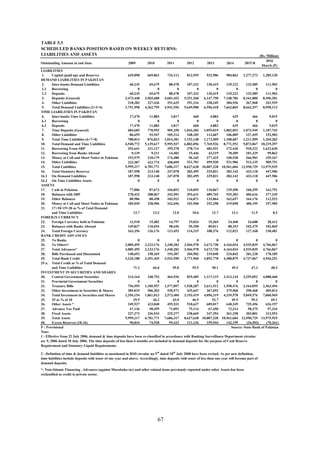
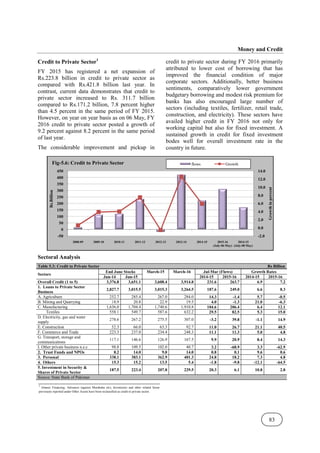
Overall credit grew by 7.2 percent during Jul-Mar,
FY2016 as compared to 6.9 percent during the
comparable period of last year FY2015.Sector
wise growth demonstrates that loans to private
sector business witnessed a significant growth of
8.3 percent during Jul-Mar, FY2016 against 6.6
percent in same period of last year.
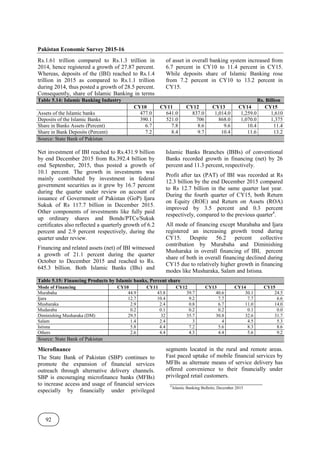
In flow terms, credit expansion to private business
reached to Rs.249.0 billion during July-March,
FY2016 as compared to Rs.187.6 billion in the
corresponding period of FY 2015.The expansion
in credit to private sector is broad based during
FY 2016 and mainly came from construction
(40.5 percent), followed by Electricity, Gas and
Water supply (14.9 percent), Transport, Storage
and Communication (14.3 percent),
Manufacturing (12.1 percent) of which Textile by
(15.0 percent).The expansion in private sectors
loans during Jul-Mar, FY2016 primarily in
Manufacturing sector that received share 82.9
percent of private sector loan (Rs. 206.4 billion),
followed by textile (33.1 percent or Rs. 82.5
billion), Electricity, Gas and Water supply (16.0
percent or Rs.39.8 billion), construction (10.7
percent or Rs.26.7 billion) and transport, storage
and communication (8.4 percent or Rs. 20.9
billion).
Table 5.4: Loans to Private Sector Businesses [Jul-Mar (Flows)] Rs. Billion
Total Credit Working Capital Fixed investment Trade financing
FY15 FY16 FY15 FY16 FY15 FY16 FY15 FY16
Total 185.1 319.8 50.6 119.2 84.4 150.1 50.2 50.4
Agriculture 14.3 -1.4 6.8 -7.4 8.2 6.1 -0.7 -0.1
Manufacturing 104.6 206.4 26.7 116.5 44.0 34.1 34.0 55.7
Food & beverages 56.8 68.7 24.2 42.9 17.2 11.9 15.4 13.9
Textiles 29.5 82.5 15.9 58.0 1.8 9.3 11.8 15.1
Coke & petroleum 18.0 10.4 10.7 1.9 9.1 -5.9 -1.7 14.4
Chemicals 1.9 33.1 -8.1 22.1 11.4 7.5 -1.4 3.5
Electricity -3.2 39.8 1.0 13.0 -6.0 31.9 1.9 -5.1
Construction 11.0 26.7 -2.0 -2.6 11.3 28.1 1.8 1.3
Commerce and trade 11.1 11.3 -0.4 4.0 7.8 7.1 3.7 0.1
Transport & comm. 9.9 20.9 7.1 -9.2 2.6 30.2 0.2 0.0
Real estate 17.8 7.1 6.3 3.2 11.7 1.0 -0.2 3.0
Others -1.8 -9.8 2.4 -1.9 -1.3 3.3 -0.4 0.5
Source: State Bank of Pakistan
The credit to private sector has witnessed
significant growth by type of finance during Jul-
Mar, FY2016 for working capital, fixed
investment and trade financing categories as
compared to same period of last year. The gradual
increase in credit disbursement for all categories
mainly used by major sectors of the economy and
particularly notable in production, transmission
and distribution of electricity; road transport;
construction of roads; telecommunications; sugar;
manufacturers of electricity distribution
machinery; cement; fertilizer; and pharmaceutical
sectors. Credit for fixed investment reached to
Rs.150.1 billion (increase by 78.0 percent) during
Jul-Mar, FY2016 against Rs.84.4 billion in
comparable period of FY2015, working capital
credit amounted to Rs.119.2 billion (grew by
135.8 percent) during the Jul-Mar, of FY2016 as
compared to Rs.50.6 billion in same period of last
year, similarly trade financing increased to
Rs.50.4 billion (grew by marginally 0.44 percent)
in Jul-Mar, FY2016 from Rs.50.2 billion in the
corresponding period of last year FY2015.
A continuation of credit demand requires
favourable monetary conditions and improvement
in performance of manufacturing and services
sectors. Realization of this could augur well for
growth in private sector going forward2
.
2
2nd
Quarterly Report FY16, SBP](https://image.slidesharecdn.com/05moneyandcredit-210914040059/85/05-money-and_credit-6-320.jpg)