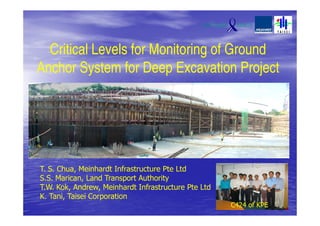
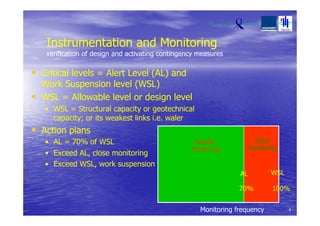
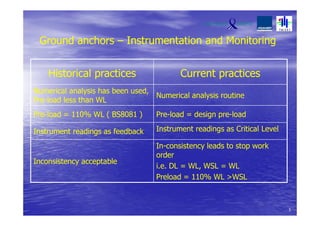
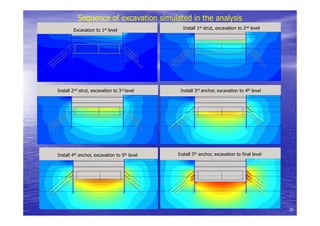
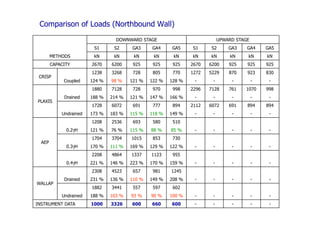
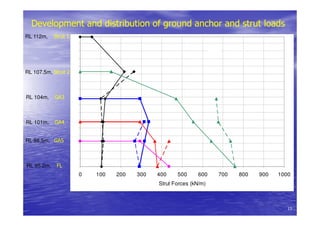
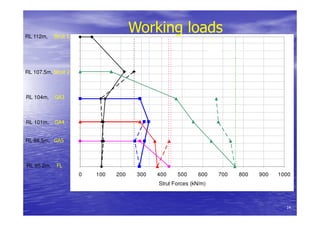
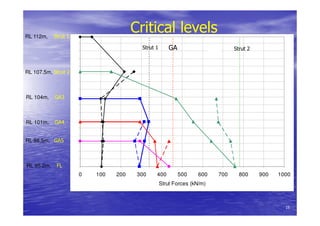
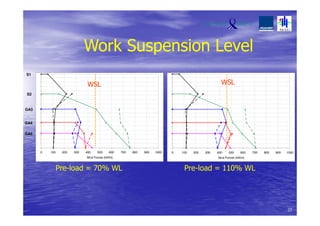
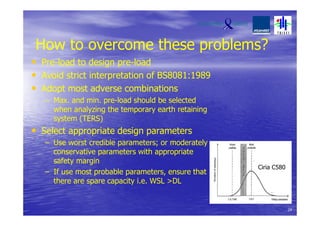
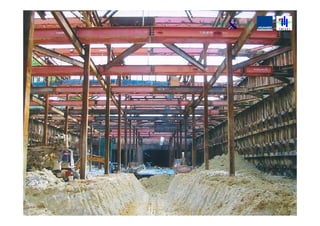
Critical Levels for Monitoring of Ground
Anchor System for Deep Excavation Project
T. S. Chua, Meinhardt Infrastructure Pte Ltd
S.S. Marican, Land Transport Authority
T.W. Kok, Andrew, Meinhardt Infrastructure Pte Ltd
K. Tani, Taisei Corporation
C424 of KPE
Ground anchors
Permanent Temporary
Design life more than 2
years
Design life less than 2
years
FOSstruct = 2 FOSgeo = 3 FOSstrut =1.6 FOSgeo = 2.5
Non-removable:
Anchor tendons left-in
Removable:
Anchor tendons removed after use
2
Temporary and Removable ground anchors
• Dummy method
• Explosive method
• Coupling method
• U-turn method
• Samwoo method
Built-up city
3
Instrumentation and Monitoring
verification of design and activating contingency measures
• Critical levels = Alert Level (AL) and
Work Suspension level (WSL)
• WSL = Allowable level or design level
• WSL = Structural capacity or geotechnical
capacity; or its weakest links i.e. waler
• Action plans
• AL = 70% of WSL
• Exceed AL, close monitoring
• Exceed WSL, work suspension
AL WSL
70% 100%
4
Close
monitoring
Regular
Monitoring
Monitoring frequency
Ground anchors – Instrumentation and Monitoring
Historical practices Current practices
Numerical analysis has been used,
Pre-load less than WL
Numerical analysis routine
Pre-load = 110% WL ( BS8081 ) Pre-load = design pre-load
Instrument readings as feedback Instrument readings as Critical Level
Inconsistency acceptable
In-consistency leads to stop work
order
i.e. DL = WL, WSL = WL
Preload = 110% WL >WSL
5
Current issues
• What is the right pre-load?
• Should we follow BS8081:Ground Anchorages?
• How to manage the conflicts with the Code?
• Is design level a critical level?
• Should work stop if the field data hits design level?
• The best way to answer these questions is
to go through a case study, C424 of KPE…
6
Longest underground expressway in South East Asia
Kallang Paya Lebar Expressway
7
C424 of KPE
ECP
PIE
TPE
Nicoll
Highway
KEY PLAN
PIE
Developer: LTA
Location: Ubi Road 2 to Defu lane 3
Structures: Twin-cell vehicular tunnel box
Length: 2.6 kM
Cost: S$251,000,000
QP(S): Meinhardt Infrastructure Pte Ltd
Contractor: Taisei Corporation
Consultants: PBMM / CPG
Features: Over 3000 ground anchors
C424
C424 of KPE
ECP
TPE
8
Cut and Cover Method
9
18 m
Sequence of excavation simulated in the analysis
Excavation to 1st level Install 1st strut, excavation to 2nd level
Install 2nd strut, excavation to 3rd level Install 3rd anchor, excavation to 4th level
Install 4th anchor, excavation to 5th level Install 5th anchor, excavation to final level
10
Deformation of
retaining wall (Plaxis)
80.0
85.0
90.0
95.0
100.0
105.0
110.0
115.0
-10 10 30 50 70 90 110 130 150 170 190
Horizontal Displacement [mm]
ReducedLevel[m]..
Exc to belowS1
Exc to belowS2
Exc to belowGA3
Exc to belowGA4
Exc to belowGA5
Exc to FL of tunnel
Construct tunnel
backfill to below
GA5 & remove GA5
backfill to below
GA4 & remove GA4
backfill to below
GA3 & remove GA3
backfill to belowS2
& remove S2
backfill to belowS1
& remove S1
backfill to GL
Strut 1, RL112.0m
Strut 2, RL107.5m
Ground Anchor 3,
RL104.0m
Ground Anchor 4,
RL101.0m
Ground Anchor 5,
RL98.5m
Formationlevel
RL95.2m
11
METHODS
DOWNWARD STAGE UPWARD STAGE
S1 S2 GA3 GA4 GA5 S1 S2 GA3 GA4 GA5
kN kN kN kN kN kN kN kN kN kN
CAPACITY 2670 6200 925 925 925 2670 6200 925 925 925
CRISP
Coupled
1238 3268 728 805 770 1272 5229 870 923 830
124 % 98 % 121 % 122 % 128 % - - - - -
PLAXIS
Drained
1880 7128 728 970 998 2296 7128 761 1070 998
188 % 214 % 121 % 147 % 166 % - - - - -
Undrained
1728 6072 691 777 894 2112 6072 691 894 894
173 % 183 % 115 % 118 % 149 % - - - - -
AEP
1208 2536 693 580 510
0.2γH 121 % 76 % 115 % 88 % 85 % - - - - -
1704 3704 1015 853 730
0.3γH 170 % 111 % 169 % 129 % 122 % - - - - -
2208 4864 1337 1123 955
0.4γH 221 % 146 % 223 % 170 % 159 % - - - - -
WALLAP
Drained
2308 4523 657 981 1245
231 % 136 % 110 % 149 % 208 % - - - - -
Undrained
1882 3441 557 597 602
188 % 103 % 93 % 90 % 100 % - - - - -
INSTRUMENT DATA 1000 3326 600 660 600 - - - - -
Comparison of Loads (Northbound Wall)
13
RL 112m, Strut 1
RL 107.5m, Strut 2
RL 104m, GA3
RL 101m, GA4
RL 98.5m, GA5
RL 95.2m, FL
0 100 200 300 400 500 600 700 800 900 1000
Strut Forces (kN/m)
Downward Stage
Upward Stage
Development and distribution of ground anchor and strut loads
13
RL 112m, Strut 1
RL 107.5m, Strut 2
RL 104m, GA3
RL 101m, GA4
RL 98.5m, GA5
RL 95.2m, FL
0 100 200 300 400 500 600 700 800 900 1000
Strut Forces (kN/m)
Downward Stage
Upward Stage
Working loads
14
RL 112m, Strut 1
RL 107.5m, Strut 2
RL 104m, GA3
RL 101m, GA4
RL 98.5m, GA5
RL 95.2m, FL
0 100 200 300 400 500 600 700 800 900 1000
Strut Forces (kN/m)
Downward Stage
Upward Stage
Critical levels
Strut 1 Strut 2GA
15
Design of ground anchors
Structural check Geotechnical check
N = (WL X Fs) / (UTS x Rd) Lfix = (WL x FG) / (Π x D X fs)
N = required number of strands, 2,4
6... Number of unit anchor = N/2
WL = Working load of anchor, kN
Fs = factor of safety, 1.6
UTS = Ultimate tensile strength, kN
Rd = reduction factor due to bend
Lfix = required fixed length, m
WL = working load of each unit anchor, kN
FG = Safety factor for geotechnical, 2.5
D = diameter of anchor, m
fs = unit skin friction, kN/m2
Rd
16
All ground anchors are subjected to acceptance test
Passing criteria:
Apparent free length, Lapp = (AEδ/∆P)
Upper limit Lower limit
Lapp < Ltf +Le +0.5Ltb
or
Lapp< 1.10Ltf + Le
Whichever is larger
Lapp> 0.8Ltf +Le
17
Pre-load
load transferred to the anchor head immediately on completion of
stressing operation
How high to Pre-load?
• Sufficient to ensure that the anchorage resistance under
SLS conditions will be mobilised with acceptable head
displacement
• Too low – wall movement may be too large, uneven
distribution of loads
• Too high – not economical as WL will be higher, may hits
WSL
Currently with monitoring based on Critical levels,
works could be suspended
18
Pre-load affects behaviour of ground anchor
Type of ground anchor also affects the amount of pre-load
δ=PL/AE
Llong=24m > Lshort = 16m
19
∆δ =constant
∆P= ƒ(1/L)
U-turn system
Load distributions if the pre-load is too low
Pre-load to 70%
Ref. Lgth Elong
at
70%
Elong
at
100%
Addn
elong
Inc in
load
Max
load
FOS
m mm mm mm kN kN
1 24 75 107 32 44 165 1.8
2 22 69 98 29 48 169 1.7
3 20 63 89 27 52 174 1.7
4 18 56 80 24 58 180 1.6
5 16 50 71 21 65 187 1.6
Pre-load to 50%
Ref Lgth Elong
at
70%
Elong
at
100%
Addn
elong
Inc in
load
Max load FOS
m mm mm mm kN kN
1 24 54 107 55 73 160 1.9
2 22 49 98 49 79 166 1.8
3 20 45 89 45 87 174 1.7
4 18 40 80 40 97 184 1.6
5 16 36 71 36 109 196 1.5
20
What if the pre-load is too high?
• Design engineer assumed a certain pre-load
(70% WL), but …
• Contractor installed based on
recommendation by BS8081, (110% WL)?
• i.e. Actual pre-load higher than design pre-
load
21
0 100 200 300 400 500 600 700 800 900 1000
Strut Forces (kN/m)
0 100 200 300 400 500 600 700 800 900 1000
Strut Forces (kN/m)
S1
S2
GA3
GA4
GA5
If pre-load is based on BS8081
Pre-load = 70%WL Pre-load = 110% WL
22
0 100 200 300 400 500 600 700 800 900 1000
Strut Forces (kN/m)
0 100 200 300 400 500 600 700 800 900 1000
Strut Forces (kN/m)
S1
S2
GA3
GA4
GA5
Work Suspension Level
Pre-load = 70% WL Pre-load = 110% WL
WSLWSL
23
How to overcome these problems?
• Pre-load to design pre-load
• Avoid strict interpretation of BS8081:1989
• Adopt most adverse combinations
– Max. and min. pre-load should be selected
when analyzing the temporary earth retaining
system (TERS)
• Select appropriate design parameters
– Use worst credible parameters; or moderately
conservative parameters with appropriate
safety margin
– If use most probable parameters, ensure that
there are spare capacity i.e. WSL >DL
24
Ciria C580
25
Installation of ground anchor
26
Load cell
27
28
29
30
Excavation toward formation level
31
32
Trend plots for ground anchors
0
100
200
300
400
500
600
700 24-May-04
13-Jun-04
3-Jul-04
23-Jul-04
12-Aug-04
1-Sep-04
21-Sep-04
11-Oct-04
31-Oct-04
20-Nov-04
10-Dec-04
30-Dec-04
19-Jan-05
8-Feb-05
28-Feb-05
20-Mar-05
9-Apr-05
29-Apr-05
19-May-05
8-Jun-05
28-Jun-05
18-Jul-05
7-Aug-05
27-Aug-05
Load(KN)
PC1N124-3 PC1N108-4 PC1N108-5
33
GA3
GA4
GA5
Conclusions
• ‘Critical Level’ is effective and efficient
• Pre-load affects the behaviour of ground anchor
• U-turn ground anchors
• Affected by pre-load
• Important to check internal structural capacity
• BS8081:1989, Ground Anchorages
• Strict interpretation on it’s recommendation could results in
conflict i.e. ground anchor load will breach Critical Level
• Drafted in 1989, the Code need to be re-look
• Pre-load
• Removable ground anchor system
• Case study: C424 of KPE
• Holistic approach, using conservative design parameters and
close monitoring using Critical Levels, is the key to ensure
adequacy and safety of TERS.
34
Thank you
Acknowledgement:
K.S. Chan (PD-Consultancy, MIPL)
H.L. Chuah (DD, LTA), Marcus Karakashian (D, LTA)
C424 TEAM of KPE

ICDE2006, Singapore

  • 1.
    Critical Levels forMonitoring of Ground Anchor System for Deep Excavation Project T. S. Chua, Meinhardt Infrastructure Pte Ltd S.S. Marican, Land Transport Authority T.W. Kok, Andrew, Meinhardt Infrastructure Pte Ltd K. Tani, Taisei Corporation C424 of KPE
  • 2.
    Ground anchors Permanent Temporary Designlife more than 2 years Design life less than 2 years FOSstruct = 2 FOSgeo = 3 FOSstrut =1.6 FOSgeo = 2.5 Non-removable: Anchor tendons left-in Removable: Anchor tendons removed after use 2
  • 3.
    Temporary and Removableground anchors • Dummy method • Explosive method • Coupling method • U-turn method • Samwoo method Built-up city 3
  • 4.
    Instrumentation and Monitoring verificationof design and activating contingency measures • Critical levels = Alert Level (AL) and Work Suspension level (WSL) • WSL = Allowable level or design level • WSL = Structural capacity or geotechnical capacity; or its weakest links i.e. waler • Action plans • AL = 70% of WSL • Exceed AL, close monitoring • Exceed WSL, work suspension AL WSL 70% 100% 4 Close monitoring Regular Monitoring Monitoring frequency
  • 5.
    Ground anchors –Instrumentation and Monitoring Historical practices Current practices Numerical analysis has been used, Pre-load less than WL Numerical analysis routine Pre-load = 110% WL ( BS8081 ) Pre-load = design pre-load Instrument readings as feedback Instrument readings as Critical Level Inconsistency acceptable In-consistency leads to stop work order i.e. DL = WL, WSL = WL Preload = 110% WL >WSL 5
  • 6.
    Current issues • Whatis the right pre-load? • Should we follow BS8081:Ground Anchorages? • How to manage the conflicts with the Code? • Is design level a critical level? • Should work stop if the field data hits design level? • The best way to answer these questions is to go through a case study, C424 of KPE… 6
  • 7.
    Longest underground expresswayin South East Asia Kallang Paya Lebar Expressway 7 C424 of KPE
  • 8.
    ECP PIE TPE Nicoll Highway KEY PLAN PIE Developer: LTA Location:Ubi Road 2 to Defu lane 3 Structures: Twin-cell vehicular tunnel box Length: 2.6 kM Cost: S$251,000,000 QP(S): Meinhardt Infrastructure Pte Ltd Contractor: Taisei Corporation Consultants: PBMM / CPG Features: Over 3000 ground anchors C424 C424 of KPE ECP TPE 8
  • 9.
    Cut and CoverMethod 9 18 m
  • 10.
    Sequence of excavationsimulated in the analysis Excavation to 1st level Install 1st strut, excavation to 2nd level Install 2nd strut, excavation to 3rd level Install 3rd anchor, excavation to 4th level Install 4th anchor, excavation to 5th level Install 5th anchor, excavation to final level 10
  • 11.
    Deformation of retaining wall(Plaxis) 80.0 85.0 90.0 95.0 100.0 105.0 110.0 115.0 -10 10 30 50 70 90 110 130 150 170 190 Horizontal Displacement [mm] ReducedLevel[m].. Exc to belowS1 Exc to belowS2 Exc to belowGA3 Exc to belowGA4 Exc to belowGA5 Exc to FL of tunnel Construct tunnel backfill to below GA5 & remove GA5 backfill to below GA4 & remove GA4 backfill to below GA3 & remove GA3 backfill to belowS2 & remove S2 backfill to belowS1 & remove S1 backfill to GL Strut 1, RL112.0m Strut 2, RL107.5m Ground Anchor 3, RL104.0m Ground Anchor 4, RL101.0m Ground Anchor 5, RL98.5m Formationlevel RL95.2m 11
  • 12.
    METHODS DOWNWARD STAGE UPWARDSTAGE S1 S2 GA3 GA4 GA5 S1 S2 GA3 GA4 GA5 kN kN kN kN kN kN kN kN kN kN CAPACITY 2670 6200 925 925 925 2670 6200 925 925 925 CRISP Coupled 1238 3268 728 805 770 1272 5229 870 923 830 124 % 98 % 121 % 122 % 128 % - - - - - PLAXIS Drained 1880 7128 728 970 998 2296 7128 761 1070 998 188 % 214 % 121 % 147 % 166 % - - - - - Undrained 1728 6072 691 777 894 2112 6072 691 894 894 173 % 183 % 115 % 118 % 149 % - - - - - AEP 1208 2536 693 580 510 0.2γH 121 % 76 % 115 % 88 % 85 % - - - - - 1704 3704 1015 853 730 0.3γH 170 % 111 % 169 % 129 % 122 % - - - - - 2208 4864 1337 1123 955 0.4γH 221 % 146 % 223 % 170 % 159 % - - - - - WALLAP Drained 2308 4523 657 981 1245 231 % 136 % 110 % 149 % 208 % - - - - - Undrained 1882 3441 557 597 602 188 % 103 % 93 % 90 % 100 % - - - - - INSTRUMENT DATA 1000 3326 600 660 600 - - - - - Comparison of Loads (Northbound Wall) 13
  • 13.
    RL 112m, Strut1 RL 107.5m, Strut 2 RL 104m, GA3 RL 101m, GA4 RL 98.5m, GA5 RL 95.2m, FL 0 100 200 300 400 500 600 700 800 900 1000 Strut Forces (kN/m) Downward Stage Upward Stage Development and distribution of ground anchor and strut loads 13
  • 14.
    RL 112m, Strut1 RL 107.5m, Strut 2 RL 104m, GA3 RL 101m, GA4 RL 98.5m, GA5 RL 95.2m, FL 0 100 200 300 400 500 600 700 800 900 1000 Strut Forces (kN/m) Downward Stage Upward Stage Working loads 14
  • 15.
    RL 112m, Strut1 RL 107.5m, Strut 2 RL 104m, GA3 RL 101m, GA4 RL 98.5m, GA5 RL 95.2m, FL 0 100 200 300 400 500 600 700 800 900 1000 Strut Forces (kN/m) Downward Stage Upward Stage Critical levels Strut 1 Strut 2GA 15
  • 16.
    Design of groundanchors Structural check Geotechnical check N = (WL X Fs) / (UTS x Rd) Lfix = (WL x FG) / (Π x D X fs) N = required number of strands, 2,4 6... Number of unit anchor = N/2 WL = Working load of anchor, kN Fs = factor of safety, 1.6 UTS = Ultimate tensile strength, kN Rd = reduction factor due to bend Lfix = required fixed length, m WL = working load of each unit anchor, kN FG = Safety factor for geotechnical, 2.5 D = diameter of anchor, m fs = unit skin friction, kN/m2 Rd 16
  • 17.
    All ground anchorsare subjected to acceptance test Passing criteria: Apparent free length, Lapp = (AEδ/∆P) Upper limit Lower limit Lapp < Ltf +Le +0.5Ltb or Lapp< 1.10Ltf + Le Whichever is larger Lapp> 0.8Ltf +Le 17
  • 18.
    Pre-load load transferred tothe anchor head immediately on completion of stressing operation How high to Pre-load? • Sufficient to ensure that the anchorage resistance under SLS conditions will be mobilised with acceptable head displacement • Too low – wall movement may be too large, uneven distribution of loads • Too high – not economical as WL will be higher, may hits WSL Currently with monitoring based on Critical levels, works could be suspended 18
  • 19.
    Pre-load affects behaviourof ground anchor Type of ground anchor also affects the amount of pre-load δ=PL/AE Llong=24m > Lshort = 16m 19 ∆δ =constant ∆P= ƒ(1/L) U-turn system
  • 20.
    Load distributions ifthe pre-load is too low Pre-load to 70% Ref. Lgth Elong at 70% Elong at 100% Addn elong Inc in load Max load FOS m mm mm mm kN kN 1 24 75 107 32 44 165 1.8 2 22 69 98 29 48 169 1.7 3 20 63 89 27 52 174 1.7 4 18 56 80 24 58 180 1.6 5 16 50 71 21 65 187 1.6 Pre-load to 50% Ref Lgth Elong at 70% Elong at 100% Addn elong Inc in load Max load FOS m mm mm mm kN kN 1 24 54 107 55 73 160 1.9 2 22 49 98 49 79 166 1.8 3 20 45 89 45 87 174 1.7 4 18 40 80 40 97 184 1.6 5 16 36 71 36 109 196 1.5 20
  • 21.
    What if thepre-load is too high? • Design engineer assumed a certain pre-load (70% WL), but … • Contractor installed based on recommendation by BS8081, (110% WL)? • i.e. Actual pre-load higher than design pre- load 21
  • 22.
    0 100 200300 400 500 600 700 800 900 1000 Strut Forces (kN/m) 0 100 200 300 400 500 600 700 800 900 1000 Strut Forces (kN/m) S1 S2 GA3 GA4 GA5 If pre-load is based on BS8081 Pre-load = 70%WL Pre-load = 110% WL 22
  • 23.
    0 100 200300 400 500 600 700 800 900 1000 Strut Forces (kN/m) 0 100 200 300 400 500 600 700 800 900 1000 Strut Forces (kN/m) S1 S2 GA3 GA4 GA5 Work Suspension Level Pre-load = 70% WL Pre-load = 110% WL WSLWSL 23
  • 24.
    How to overcomethese problems? • Pre-load to design pre-load • Avoid strict interpretation of BS8081:1989 • Adopt most adverse combinations – Max. and min. pre-load should be selected when analyzing the temporary earth retaining system (TERS) • Select appropriate design parameters – Use worst credible parameters; or moderately conservative parameters with appropriate safety margin – If use most probable parameters, ensure that there are spare capacity i.e. WSL >DL 24 Ciria C580
  • 25.
  • 26.
  • 27.
  • 28.
  • 29.
  • 30.
  • 31.
  • 32.
  • 33.
    Trend plots forground anchors 0 100 200 300 400 500 600 700 24-May-04 13-Jun-04 3-Jul-04 23-Jul-04 12-Aug-04 1-Sep-04 21-Sep-04 11-Oct-04 31-Oct-04 20-Nov-04 10-Dec-04 30-Dec-04 19-Jan-05 8-Feb-05 28-Feb-05 20-Mar-05 9-Apr-05 29-Apr-05 19-May-05 8-Jun-05 28-Jun-05 18-Jul-05 7-Aug-05 27-Aug-05 Load(KN) PC1N124-3 PC1N108-4 PC1N108-5 33 GA3 GA4 GA5
  • 34.
    Conclusions • ‘Critical Level’is effective and efficient • Pre-load affects the behaviour of ground anchor • U-turn ground anchors • Affected by pre-load • Important to check internal structural capacity • BS8081:1989, Ground Anchorages • Strict interpretation on it’s recommendation could results in conflict i.e. ground anchor load will breach Critical Level • Drafted in 1989, the Code need to be re-look • Pre-load • Removable ground anchor system • Case study: C424 of KPE • Holistic approach, using conservative design parameters and close monitoring using Critical Levels, is the key to ensure adequacy and safety of TERS. 34
  • 35.
    Thank you Acknowledgement: K.S. Chan(PD-Consultancy, MIPL) H.L. Chuah (DD, LTA), Marcus Karakashian (D, LTA) C424 TEAM of KPE