What Differentiates 
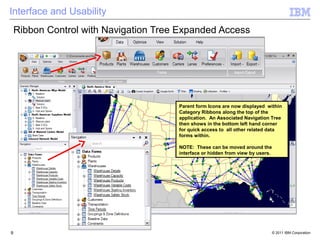
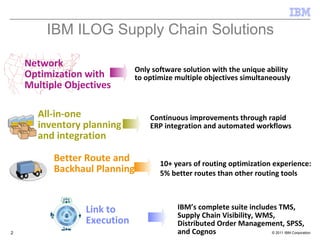
The IBM ILOG Strategic
Network Planning Solution


                                     © 2011 IBM Corporation
IBM ILOG Supply Chain Solutions

    Network
                              Only software solution with the unique ability
    Optimization with         to optimize multiple objectives simultaneously
    Multiple Objectives

      All-in-one                  Continuous improvements through rapid
      inventory planning          ERP integration and automated workflows
      and integration

          Better Route and           10+ years of routing optimization experience:
          Backhaul Planning          5% better routes than other routing tools


                 Link to                  IBM’s complete suite includes TMS,
                                          Supply Chain Visibility, WMS,
                 Execution                Distributed Order Management, SPSS,
2                                         and Cognos                  © 2011 IBM Corporation
IBM Has a Complete Strategic Supply Chain Planning Suite

                                 IBM ILOG LogicNet Plus XE for
                                   Network and sourcing optimization:
                                   location of facilities, assignment of
                                   stores, managing seasonality, and
                                   carbon foot printing.

                                   Value: 5-15% reduction in supply
                                   chain costs, better service to stores
                                   and for on-going multi-plant production
                                   sourcing and capital investment
                                   decisions; Enhanced S&OP
                                   capability; 2-5% reduction in
                                   ongoing manufacturing costs


 IBM ILOG Inventory and
                                                                     IBM ILOG Transportation
  Product Flow Analyst for
  Enterprise multi-echelon inventory                                  Analyst for Transportation
  optimization and strategic analysis:                                optimization: routing analysis,
  integrated inventory planning within                                backhaul, mode selection, and fleet
  your ERP system.                                                    sizing.

  Value : 10-30% reduction in inventory                               Value: 10-30% decrease in trans costs
  costs, better fill rates. And fo analysis
  to determine strategic shifts in your
  inventory policies and practices.

  3                                                                                                           © 2011 IBM Corporation
How Leading Firms Get Value from Network Design

 Pepsi
    – $6M reduction in inventory; 2% reduction in growth of transportation miles; increase in the return on invested capital
      from 7.6% to 7.8%; and less out-of-stock leading to 12.8m cases available to be sold
 3M
    – Speaking with IBM at SCOPE East (2011) about how they are organized to deploy network modeling capability
 MillerCoors
    – Mention $750m in synergies from merger; spoke at CSCMP (2010) and about ½ synergies come from supply chain;
       using modeling to make seasonal sourcing decisions
 The Home Depot
    – Annual report (released in early 2010) mentioned progress towards significant supply chain transformation
 Fonterra (one of the world’s largest Dairies)
    – Reduction in transportation costs (removing 4,000 trucks annually), removed 12 warehouses from network, analysis of
      supply chain risk
 Whirlpool
   – Used LogicNet Plus to help quickly manage the merger with Maytag; $40M savings per year from the logistics and
       supply chain
 Walgreens
   – Discussed importance of correctly locating highly automated warehouses
 Mars/Wrigley
    – Spoke at CSCMP (2009), mentioned $10M savings in initial modeling alone, ability to test for results for impact on
      carbon emissions and oil price risks
 Dow
    – Spoke at LogicTools symposium (2008) and mentioned rapid modeling approach and connecting to capital expense
      justification
    – Recently won an award for reducing $5M in costs with the support of LogicNet Plus XE

4                                                                                                              © 2011 IBM Corporation
Complimentary Tools Have Complete Functionality Ensuring Credibility of
  Your Results to Experts in these Areas

 IBM ILOG Inventory and Product Flow Analyst           IBM ILOG Transportation Analyst


  All-in-one strategic as well as tactical. You can    Routing problems are not trivial to solve well.
   implement the inventory results                       ILOG has an optimization advantage that allows
     – Web based interface to give access to             us to solve these problems better
        multiple inventory planners and provide true       – Better routes and fleet sizing
        integration                                        – Backhauls and Continuous moves
     – Built-in work flows, data maintenance, auto         – Sophisticated mode selection
        review                                             – Multiple pick-ups and deliveries
     – Different views for different users– Planners
                                                        Allows for full range of features
        have a home page and a 1-page view of the
                                                           – Detailed time windows and availability
        results
                                                             calendars, Rest requirements, multiple
  Full set of inventory features and multiple               capacity measures, etc.
   optimization
                                                        Links to Sterling TMS and uses the same
     – Multi-echelon, buffer location, mix
                                                         optimization engine
 5      optimization, and flow path                                                       © 2011 IBM Corporation
IBM Has a Full Offering of Analytics Solutions


                                                  ILOG ODME and CPLEX


6 6                                                   © 2011 IBM Corporation
More Firms are taking Optimization Deeper into their Organizations

                  A recent book discusses the value of optimization:
                     – “"One of [the book’s] most interesting arguments is that a great deal of
                       the effort spent on information gathering and analysis is wasted — or, at
                       least, used sub-optimally — when it’s used to feed business intelligence
                       systems that produce reports that ultimately wind up with being fed into
                       spreadsheets and PowerPoint slides. Managers then sit around in a
                       conference room listening to presentations and debating what the data
                       means and what decisions should be made about it — when, in many
                       cases, good software could make the decision itself."
                     – David F. Carr, Forbes

                  The value of optimization is proven
                     – A U.S. Bank reduced its outstanding cash balance by $2B by optimizing
                       the replenishment of ATMs
                     – Netherlands Railway reduced cost by $30M USD and captured $57M
                       USD by using optimization to improve efficiency and improve customer
                       service
                     – Indeval, Mexico's Central Security Depository, clears $250B a day with
                       optimization, saving $240M in interest payments
                     – MillerCoors used optimization to help with their $750M in savings from
                       the merger of the two organizations
                     – Mars and Wrigley talked about the value of optimization and supply chain
                       modeling, savings $10M just in the initial modeling, and much more with
                       detailed modeling
7                                                                                   © 2011 IBM Corporation
LogicNet Plus: Built to be Easy for Business Users to Get Results
 Clean Design
    – Menu’s organized to facilitate understanding of the model
    – Easy to build simple models and add complexity
    – Easy to move scenarios between models

 Tight Integration with Excel and Access
    –   Import wizards that pull data from Excel or Access files
    –   Edit in Excel within the application
    –   Edit multiple scenarios at one time
    –   Easy to compare and merge forms from different scenarios
    –   Easy to get data back out to Excel and Access for analysis


 Robust Product with Helpful Feedback
    – Backend SQL Server database
    – Ability to run in multiple scenarios in parallel; Ability to run a single scenario on
      multiple threads
    – Robust Referential Integrity
    – Advanced error messages with strong partial solution analysis


 Good Visualization
    – Detailed mapping with the ability to add views
    – Site sizing, site coloring, ability to shade map
    – Quickly change between a number of graphical displays


 Links to Other Systems
    – CZAR LITE, UPS
    – PC*Miler


8                                                                                             © 2011 IBM Corporation
Interface and Usability
    Ribbon Control with Navigation Tree Expanded Access


                                       Parent form Icons are now displayed within
                                       Category Ribbons along the top of the
                                       application. An Associated Navigation Tree
                                       then shows in the bottom left hand corner
                                       for quick access to all other related data
                                       forms within.

                                       NOTE: These can be moved around the
                                       interface or hidden from view by users.


9                                                                                © 2011 IBM Corporation
Interface and Usability
 Data Forms now in Tab Format


                                Data forms are now in tab format and align
                                themselves directly below the Ribbons.
                                Each form maybe be dragged to the right or
                                the left according to user preference.

                                NOTE: Forms maybe enlarged to a single
                                full screen view by clicking on the ‘Maximize
                                Button’ in the upper right hand corner.


10                                                                              © 2011 IBM Corporation
Interface and Usability
 Data Forms now in Tab Format
                                Tabs may then be dragged and dropped
                                around the interface using the crossbar in
                                the middle to dock them according to user
                                preference.

                                NOTE: Users may also edit forms from
                                within other scenarios in this format while
                                the optimization runs for a previous
                                scenario.


11                                                             © 2011 IBM Corporation
Interface and Usability
 Lane Visualization


        Lane Visualization now allows users to
        create all allowable flows visually by
        dragging and dropping icons representing
        Site and Product Groupings around the
        visualization screen and then connecting as
        appropriate.

        Note: Users may also edit these lanes below
        in the heritage Lanes form in Table Format
        below the visualization.
12                                                    © 2011 IBM Corporation
In-depth functionality with Innovative Features
 Multi-time period for multi-year or seasonal
  planning
 Unlimited network echelons with detailed
  transportation modeling including min/max
  volumes on lanes for groups of sites
 Unlimited BOM, including multiple recipes and
  by-products                                        integrated Tableau® configurable reporting:
                                                        – Configure customized reports with simple drag
 Detailed sourcing rules for customers and               and drop functionality
  warehouse (single source, dual source,                – Create and Save report setup for instant updated
  grouped single sourcing, etc)                           display after each new ‘what if’ analysis

 Detailed process modeling including lot sizes,
  overtime, yield, tooling, tanks, and production
  moves
 Tax modeling and currency exchange rates
 Economies-of-scale modeling
 Carbon footprint modeling:
     – Report on supply chain carbon emissions
     – Set carbon emission constraints
     – Set costs/credits for carbon trading

13                                                                                         © 2011 IBM Corporation
What’s New in LNP XE 7.2?
Multi-Objective Optimization - Breakthrough in Network Modeling


       Traditional Approach                   LogicNet Plus XE 7.2

 • Solve only one objective at a time   • Solve multiple objectives at once
 • Approach better solutions only by    • Examine entire trade-off curve and
   trial and error                        see all possible solutions
14                                                                 © 2011 IBM Corporation
What’s New in LNP XE 7.2?
Multi-Objective Optimization - Breakthrough in Network Modeling


                      User-Defined Primary
                           Objective


                                             Automatically create
                                             trade-off curves and
                                             explore the solutions


                                                              User-Defined
                                                           Secondary Objective


15
15                                                                       © 2011 IBM Corporation
What’s New in LNP XE 7.2?
Gain more insight and develop better business plans by
directly balancing critical objectives


             Trade-off Examples:
             –   Total Cost vs. Service Level
             –   Service to Top Customers vs. Overall Service
             –   Variable Cost vs. Capital Investment
             –   Paid Freight Cost vs. Customer Pick-up Cost
             –   Internal Manufacturing Cost vs. 3rd Party spend
             –   Manufacturing Cost vs. Transportation Cost
             –   Parent Company Cost vs. Acquired Company Cost
16                                                                 © 2011 IBM Corporation
Output Data

      Output data can be analyzed and displayed in many different formats after
       solutions are created….
         Scenario Set 1 – Best 1, 2 and Regional DCs
               Optimal 1 DC              Optimal 2 DCs         Regional DCs


              Indianapolis, IN      Rockford, MI (Current)    Indianapolis,IN
                                     Salt Lake City, UT        Charlotte, NC
                                                             Salt Lake City, UT


                                                                        Additional
                                                                        5% Cost
                                                                        Decrease


         18                                                             © 2010 IBM Corporation
17                                                                                       © 2011 IBM Corporation
Output Data
      High level Summary Reports


18                                  © 2011 IBM Corporation
Output Data also provides unique features like the landed cost
 visualization


                                      Scenario                         Warehouse
                                                                          Charlotte
                                                                          Indianapolis
                                                                          Salt Lake City
                                                                          Wolverine Warehouse


                                      Best 1 DC


                                      Best 2 DCs


                                      Regional DCs


19                                                          © 2011 IBM Corporation
How does optimization work?


     Targets
     Limits                   Choices

     Data
20                                                          20
                                        © 2011 IBM Corporation
Importance of a world-class optimization engine


 Strategic Supply Chain planning has huge implications for the organization.
 Decisions based on the optimization will impact profits, costs, customer service and more
 The business needs to trust the optimization engine produces results that are:
   – Accurate
   – Consistent
   – Robust
   – Scalable
   – Optimal
 IBM ILOG CPLEX is the gold standard in optimization
    – Used by over 50% of the world’s largest companies
    – 1000s of Universities
    – 1000s of application providers


21                                                                                 © 2011 IBM Corporation
Modeling and Optimization
 Upgrade to CPLEX 12.3 at the core of Optimization

 CPLEX’s History of Performance Enhancement                                    Drivers:
                                                                                – Improved
      CPLEX 7 (2000): 60% on “hard mixed integer problems”                       heuristics
                                                                                – Improved cuts
      CPLEX 8 (2002): 40% overall, 70% on “difficult problems”                 – Reduced parallel
                                                                                  overhead
      CPLEX 9 (2003): 50% on “difficult customer models”
                                                                                – General software
                                                                                  engineering
      CPLEX 10 (2006): 35% overall, 70% on “particularly difficult models”

      CPLEX 11 (2007): 15% under one minute, 3X on 1-60 minutes, 10X on one hour and up

      IBM ILOG CPLEX 12.0 (2009): 30% overall, 2X on 1000 seconds and up

      IBM ILOG CPLEX 12.2 (2010): 50% overall, 2.7X on 1000 seconds and up

      IBM ILOG CPLEX 12.3 (2011): 20% overall, 2X on 1000 seconds and up

                      IBM’s continuing commitment to performance leadership


22                                                                                      © 2011 IBM Corporation
IBM ILOG is the only software vendor that provides a network optimization
solution and creates the industry leading mathematical engine
 Why is this an advantage to you?

     – Direct development coordination: LogicNet Plus XE development team and ILOG
       CPLEX development team work side-by-side within IBM
         • LogicNet Plus XE always benefits from the latest & greatest version of CPLEX
         • Work directly with CPLEX team to “tune” the engine to address supply chain network
           problems
         • Work directly with CPLEX team to increase scalability & performance
         • Directly report any problems and ensure quick resolution

     – Single vendor responsibility
         • Any issues with optimization can be addressed directly by IBM and fall under IBM
           service agreements
         • Best and brightest minds in optimization directly available to you
         • No finger pointing between application provider and mathematical engine provider

     – Access to greater ILOG Optimization Solutions as needs may arise
        • ILOG’s experience and depth in optimization is without peer in the industry
        • As your organization faces additional business problems that optimization can
          address, you have a trusted partner to work with
            –
23                                                                                 © 2011 IBM Corporation
IBM Continues to Invest in LogicNet Plus:
Plays a Critical Role in Smarter Commerce Initiative

 Major IBM Releases of LogicNet Plus XE
   – LogicNet Plus XE 7.0 Released in June 2009
   – LogicNet Plus XE 7.1 Released in June 2010
   – LogicNet Plus XE 7.2 will ship on Dec 9, 2011


 The LogicNet Plus XE development philosophy remains the same
    – Continue to improve the speed and increase model size
    – Add additional modeling capabilities
    – Continue to invest and leverage new technology to make the too easier to use
        • Ensure that people can build simple models without having to touch advanced modeling
          capabilities

 LNP XE works on either 32 or 64 bit machines
 LNP XE continues to leverage CPLEX engine
 LNP XE allows parallel optimization runs and multiple threads
 R&D continues to improve memory consumption for model footprint and reporting


 LNP XE 5.0 to 6.0
    – Significant jump in the run times--- 3 hour models down to 45 minutes
    – Significant improvement in memory footprint– allowing you to solve models not solved before

 LNP XE 7.0 and 7.1
    – Another increase in run time– 30 minute models in 5 minutes, 2 hours models in 1 hours, etc
24                                                                                           © 2011 IBM Corporation
We also provide services within our team. Our Services expertise is a key
component of our overall supply chain solutions offering

                        Supply Chain Planning & Optimization Solutions

                           Technology                            Services

 Expertise
     – Leader in supply chain strategic planning with a focus on how to maximize leverage from client’s
       assets (both capital and inventory)
     – Unparalleled experience across various industries – CPG, Chemical, Retail, Hi-Tech, Pharma,
       Government, Automotive
     – Over 100 large projects in last 3 years – all around the world


 Experienced Consultant base
     –   100% of our consultants have a Master’s degree or above
     –   Strong industry / logistics background
     –   In-depth knowledge of ILOG technology suite, with core focus on supply chain planning problems
     –   Provide subject-matter expertise to other consulting firms on their engagements


 Time to Value
     – Our consultants’ experience and knowledge enables us to deliver quick time-to-value
     – Enable client teams on software and help build modeling expertise

25                                                                                             © 2011 IBM Corporation
Value of IBM to Your Business

 Ability to address business problems
    – Used by hundreds of companies in every industry
    – Provide solutions that can be validated by experts in different areas
    – Provides all-in-one strategic and tactical inventory solution for implementation
 Ability to achieve return on investment
    – Well documented high ROI’s for numerous customers
 User acceptance
   – Highly satisfied customer base
   – Monthly user group events regularly attended by 75-100 users
 Low risk
    – Quality
        • IBM employs the highest standards of support for all software products.
        • IBM has high standards for preventing un-authorized code (reducing your risks)
    – Support
        • 24 hour local support throughout the world. Experienced professionals to answer your questions
           with defined service agreements and performance tracking.
    – Company stability
        • Publicly traded company celebrating 100 th anniversary
 Vendor long-term relationship
    – IBM can support your business in numerous ways in addition to network design. Within our group we
      offer additional supply chain planning applications as well as optimization solutions tailored
      specifically to your business. In addition, IBM is a world leader in commerce solutions, analytics
      solutions, and solutions for IT. Finally, IBM’s deep, diverse, and experienced professional services
      resources can support your team to drive business results.
26                                                                                            © 2011 IBM Corporation

Ibm log differentiators for strategic network planning 2011 v6

  • 1.
    What Differentiates TheIBM ILOG Strategic Network Planning Solution © 2011 IBM Corporation
  • 2.
    IBM ILOG SupplyChain Solutions Network Only software solution with the unique ability Optimization with to optimize multiple objectives simultaneously Multiple Objectives All-in-one Continuous improvements through rapid inventory planning ERP integration and automated workflows and integration Better Route and 10+ years of routing optimization experience: Backhaul Planning 5% better routes than other routing tools Link to IBM’s complete suite includes TMS, Supply Chain Visibility, WMS, Execution Distributed Order Management, SPSS, 2 and Cognos © 2011 IBM Corporation
  • 3.
    IBM Has aComplete Strategic Supply Chain Planning Suite  IBM ILOG LogicNet Plus XE for Network and sourcing optimization: location of facilities, assignment of stores, managing seasonality, and carbon foot printing. Value: 5-15% reduction in supply chain costs, better service to stores and for on-going multi-plant production sourcing and capital investment decisions; Enhanced S&OP capability; 2-5% reduction in ongoing manufacturing costs  IBM ILOG Inventory and  IBM ILOG Transportation Product Flow Analyst for Enterprise multi-echelon inventory Analyst for Transportation optimization and strategic analysis: optimization: routing analysis, integrated inventory planning within backhaul, mode selection, and fleet your ERP system. sizing. Value : 10-30% reduction in inventory Value: 10-30% decrease in trans costs costs, better fill rates. And fo analysis to determine strategic shifts in your inventory policies and practices. 3 © 2011 IBM Corporation
  • 4.
    How Leading FirmsGet Value from Network Design  Pepsi – $6M reduction in inventory; 2% reduction in growth of transportation miles; increase in the return on invested capital from 7.6% to 7.8%; and less out-of-stock leading to 12.8m cases available to be sold  3M – Speaking with IBM at SCOPE East (2011) about how they are organized to deploy network modeling capability  MillerCoors – Mention $750m in synergies from merger; spoke at CSCMP (2010) and about ½ synergies come from supply chain; using modeling to make seasonal sourcing decisions  The Home Depot – Annual report (released in early 2010) mentioned progress towards significant supply chain transformation  Fonterra (one of the world’s largest Dairies) – Reduction in transportation costs (removing 4,000 trucks annually), removed 12 warehouses from network, analysis of supply chain risk  Whirlpool – Used LogicNet Plus to help quickly manage the merger with Maytag; $40M savings per year from the logistics and supply chain  Walgreens – Discussed importance of correctly locating highly automated warehouses  Mars/Wrigley – Spoke at CSCMP (2009), mentioned $10M savings in initial modeling alone, ability to test for results for impact on carbon emissions and oil price risks  Dow – Spoke at LogicTools symposium (2008) and mentioned rapid modeling approach and connecting to capital expense justification – Recently won an award for reducing $5M in costs with the support of LogicNet Plus XE 4 © 2011 IBM Corporation
  • 5.
    Complimentary Tools HaveComplete Functionality Ensuring Credibility of Your Results to Experts in these Areas  IBM ILOG Inventory and Product Flow Analyst  IBM ILOG Transportation Analyst  All-in-one strategic as well as tactical. You can  Routing problems are not trivial to solve well. implement the inventory results ILOG has an optimization advantage that allows – Web based interface to give access to us to solve these problems better multiple inventory planners and provide true – Better routes and fleet sizing integration – Backhauls and Continuous moves – Built-in work flows, data maintenance, auto – Sophisticated mode selection review – Multiple pick-ups and deliveries – Different views for different users– Planners  Allows for full range of features have a home page and a 1-page view of the – Detailed time windows and availability results calendars, Rest requirements, multiple  Full set of inventory features and multiple capacity measures, etc. optimization  Links to Sterling TMS and uses the same – Multi-echelon, buffer location, mix optimization engine 5 optimization, and flow path © 2011 IBM Corporation
  • 6.
    IBM Has aFull Offering of Analytics Solutions ILOG ODME and CPLEX 6 6 © 2011 IBM Corporation
  • 7.
    More Firms aretaking Optimization Deeper into their Organizations  A recent book discusses the value of optimization: – “"One of [the book’s] most interesting arguments is that a great deal of the effort spent on information gathering and analysis is wasted — or, at least, used sub-optimally — when it’s used to feed business intelligence systems that produce reports that ultimately wind up with being fed into spreadsheets and PowerPoint slides. Managers then sit around in a conference room listening to presentations and debating what the data means and what decisions should be made about it — when, in many cases, good software could make the decision itself." – David F. Carr, Forbes  The value of optimization is proven – A U.S. Bank reduced its outstanding cash balance by $2B by optimizing the replenishment of ATMs – Netherlands Railway reduced cost by $30M USD and captured $57M USD by using optimization to improve efficiency and improve customer service – Indeval, Mexico's Central Security Depository, clears $250B a day with optimization, saving $240M in interest payments – MillerCoors used optimization to help with their $750M in savings from the merger of the two organizations – Mars and Wrigley talked about the value of optimization and supply chain modeling, savings $10M just in the initial modeling, and much more with detailed modeling 7 © 2011 IBM Corporation
  • 8.
    LogicNet Plus: Builtto be Easy for Business Users to Get Results  Clean Design – Menu’s organized to facilitate understanding of the model – Easy to build simple models and add complexity – Easy to move scenarios between models  Tight Integration with Excel and Access – Import wizards that pull data from Excel or Access files – Edit in Excel within the application – Edit multiple scenarios at one time – Easy to compare and merge forms from different scenarios – Easy to get data back out to Excel and Access for analysis  Robust Product with Helpful Feedback – Backend SQL Server database – Ability to run in multiple scenarios in parallel; Ability to run a single scenario on multiple threads – Robust Referential Integrity – Advanced error messages with strong partial solution analysis  Good Visualization – Detailed mapping with the ability to add views – Site sizing, site coloring, ability to shade map – Quickly change between a number of graphical displays  Links to Other Systems – CZAR LITE, UPS – PC*Miler 8 © 2011 IBM Corporation
  • 9.
    Interface and Usability Ribbon Control with Navigation Tree Expanded Access Parent form Icons are now displayed within Category Ribbons along the top of the application. An Associated Navigation Tree then shows in the bottom left hand corner for quick access to all other related data forms within. NOTE: These can be moved around the interface or hidden from view by users. 9 © 2011 IBM Corporation
  • 10.
    Interface and Usability Data Forms now in Tab Format Data forms are now in tab format and align themselves directly below the Ribbons. Each form maybe be dragged to the right or the left according to user preference. NOTE: Forms maybe enlarged to a single full screen view by clicking on the ‘Maximize Button’ in the upper right hand corner. 10 © 2011 IBM Corporation
  • 11.
    Interface and Usability Data Forms now in Tab Format Tabs may then be dragged and dropped around the interface using the crossbar in the middle to dock them according to user preference. NOTE: Users may also edit forms from within other scenarios in this format while the optimization runs for a previous scenario. 11 © 2011 IBM Corporation
  • 12.
    Interface and Usability Lane Visualization Lane Visualization now allows users to create all allowable flows visually by dragging and dropping icons representing Site and Product Groupings around the visualization screen and then connecting as appropriate. Note: Users may also edit these lanes below in the heritage Lanes form in Table Format below the visualization. 12 © 2011 IBM Corporation
  • 13.
    In-depth functionality withInnovative Features  Multi-time period for multi-year or seasonal planning  Unlimited network echelons with detailed transportation modeling including min/max volumes on lanes for groups of sites  Unlimited BOM, including multiple recipes and by-products  integrated Tableau® configurable reporting: – Configure customized reports with simple drag  Detailed sourcing rules for customers and and drop functionality warehouse (single source, dual source, – Create and Save report setup for instant updated grouped single sourcing, etc) display after each new ‘what if’ analysis  Detailed process modeling including lot sizes, overtime, yield, tooling, tanks, and production moves  Tax modeling and currency exchange rates  Economies-of-scale modeling  Carbon footprint modeling: – Report on supply chain carbon emissions – Set carbon emission constraints – Set costs/credits for carbon trading 13 © 2011 IBM Corporation
  • 14.
    What’s New inLNP XE 7.2? Multi-Objective Optimization - Breakthrough in Network Modeling Traditional Approach LogicNet Plus XE 7.2 • Solve only one objective at a time • Solve multiple objectives at once • Approach better solutions only by • Examine entire trade-off curve and trial and error see all possible solutions 14 © 2011 IBM Corporation
  • 15.
    What’s New inLNP XE 7.2? Multi-Objective Optimization - Breakthrough in Network Modeling User-Defined Primary Objective Automatically create trade-off curves and explore the solutions User-Defined Secondary Objective 15 15 © 2011 IBM Corporation
  • 16.
    What’s New inLNP XE 7.2? Gain more insight and develop better business plans by directly balancing critical objectives Trade-off Examples: – Total Cost vs. Service Level – Service to Top Customers vs. Overall Service – Variable Cost vs. Capital Investment – Paid Freight Cost vs. Customer Pick-up Cost – Internal Manufacturing Cost vs. 3rd Party spend – Manufacturing Cost vs. Transportation Cost – Parent Company Cost vs. Acquired Company Cost 16 © 2011 IBM Corporation
  • 17.
    Output Data  Output data can be analyzed and displayed in many different formats after solutions are created…. Scenario Set 1 – Best 1, 2 and Regional DCs Optimal 1 DC Optimal 2 DCs Regional DCs Indianapolis, IN Rockford, MI (Current) Indianapolis,IN Salt Lake City, UT Charlotte, NC Salt Lake City, UT Additional 5% Cost Decrease 18 © 2010 IBM Corporation 17 © 2011 IBM Corporation
  • 18.
    Output Data  High level Summary Reports 18 © 2011 IBM Corporation
  • 19.
    Output Data alsoprovides unique features like the landed cost visualization Scenario Warehouse Charlotte Indianapolis Salt Lake City Wolverine Warehouse Best 1 DC Best 2 DCs Regional DCs 19 © 2011 IBM Corporation
  • 20.
    How does optimizationwork? Targets Limits Choices Data 20 20 © 2011 IBM Corporation
  • 21.
    Importance of aworld-class optimization engine  Strategic Supply Chain planning has huge implications for the organization.  Decisions based on the optimization will impact profits, costs, customer service and more  The business needs to trust the optimization engine produces results that are: – Accurate – Consistent – Robust – Scalable – Optimal  IBM ILOG CPLEX is the gold standard in optimization – Used by over 50% of the world’s largest companies – 1000s of Universities – 1000s of application providers 21 © 2011 IBM Corporation
  • 22.
    Modeling and Optimization Upgrade to CPLEX 12.3 at the core of Optimization CPLEX’s History of Performance Enhancement  Drivers: – Improved  CPLEX 7 (2000): 60% on “hard mixed integer problems” heuristics – Improved cuts  CPLEX 8 (2002): 40% overall, 70% on “difficult problems” – Reduced parallel overhead  CPLEX 9 (2003): 50% on “difficult customer models” – General software engineering  CPLEX 10 (2006): 35% overall, 70% on “particularly difficult models”  CPLEX 11 (2007): 15% under one minute, 3X on 1-60 minutes, 10X on one hour and up  IBM ILOG CPLEX 12.0 (2009): 30% overall, 2X on 1000 seconds and up  IBM ILOG CPLEX 12.2 (2010): 50% overall, 2.7X on 1000 seconds and up  IBM ILOG CPLEX 12.3 (2011): 20% overall, 2X on 1000 seconds and up IBM’s continuing commitment to performance leadership 22 © 2011 IBM Corporation
  • 23.
    IBM ILOG isthe only software vendor that provides a network optimization solution and creates the industry leading mathematical engine  Why is this an advantage to you? – Direct development coordination: LogicNet Plus XE development team and ILOG CPLEX development team work side-by-side within IBM • LogicNet Plus XE always benefits from the latest & greatest version of CPLEX • Work directly with CPLEX team to “tune” the engine to address supply chain network problems • Work directly with CPLEX team to increase scalability & performance • Directly report any problems and ensure quick resolution – Single vendor responsibility • Any issues with optimization can be addressed directly by IBM and fall under IBM service agreements • Best and brightest minds in optimization directly available to you • No finger pointing between application provider and mathematical engine provider – Access to greater ILOG Optimization Solutions as needs may arise • ILOG’s experience and depth in optimization is without peer in the industry • As your organization faces additional business problems that optimization can address, you have a trusted partner to work with – 23 © 2011 IBM Corporation
  • 24.
    IBM Continues toInvest in LogicNet Plus: Plays a Critical Role in Smarter Commerce Initiative  Major IBM Releases of LogicNet Plus XE – LogicNet Plus XE 7.0 Released in June 2009 – LogicNet Plus XE 7.1 Released in June 2010 – LogicNet Plus XE 7.2 will ship on Dec 9, 2011  The LogicNet Plus XE development philosophy remains the same – Continue to improve the speed and increase model size – Add additional modeling capabilities – Continue to invest and leverage new technology to make the too easier to use • Ensure that people can build simple models without having to touch advanced modeling capabilities  LNP XE works on either 32 or 64 bit machines  LNP XE continues to leverage CPLEX engine  LNP XE allows parallel optimization runs and multiple threads  R&D continues to improve memory consumption for model footprint and reporting  LNP XE 5.0 to 6.0 – Significant jump in the run times--- 3 hour models down to 45 minutes – Significant improvement in memory footprint– allowing you to solve models not solved before  LNP XE 7.0 and 7.1 – Another increase in run time– 30 minute models in 5 minutes, 2 hours models in 1 hours, etc 24 © 2011 IBM Corporation
  • 25.
    We also provideservices within our team. Our Services expertise is a key component of our overall supply chain solutions offering Supply Chain Planning & Optimization Solutions Technology Services  Expertise – Leader in supply chain strategic planning with a focus on how to maximize leverage from client’s assets (both capital and inventory) – Unparalleled experience across various industries – CPG, Chemical, Retail, Hi-Tech, Pharma, Government, Automotive – Over 100 large projects in last 3 years – all around the world  Experienced Consultant base – 100% of our consultants have a Master’s degree or above – Strong industry / logistics background – In-depth knowledge of ILOG technology suite, with core focus on supply chain planning problems – Provide subject-matter expertise to other consulting firms on their engagements  Time to Value – Our consultants’ experience and knowledge enables us to deliver quick time-to-value – Enable client teams on software and help build modeling expertise 25 © 2011 IBM Corporation
  • 26.
    Value of IBMto Your Business  Ability to address business problems – Used by hundreds of companies in every industry – Provide solutions that can be validated by experts in different areas – Provides all-in-one strategic and tactical inventory solution for implementation  Ability to achieve return on investment – Well documented high ROI’s for numerous customers  User acceptance – Highly satisfied customer base – Monthly user group events regularly attended by 75-100 users  Low risk – Quality • IBM employs the highest standards of support for all software products. • IBM has high standards for preventing un-authorized code (reducing your risks) – Support • 24 hour local support throughout the world. Experienced professionals to answer your questions with defined service agreements and performance tracking. – Company stability • Publicly traded company celebrating 100 th anniversary  Vendor long-term relationship – IBM can support your business in numerous ways in addition to network design. Within our group we offer additional supply chain planning applications as well as optimization solutions tailored specifically to your business. In addition, IBM is a world leader in commerce solutions, analytics solutions, and solutions for IT. Finally, IBM’s deep, diverse, and experienced professional services resources can support your team to drive business results. 26 © 2011 IBM Corporation

Editor's Notes

  • #3 For example Rising and fluctuating ingredient costs like corn prices (which will only increase assuming increased use in ethanol production for use as fuel) has affected prices of high fructose corn syrup (HFCS) used in soft drinks Higher oil prices affects transportation costs, manufacturing costs, as well as bottling / packaging costs (plastics are derived from oil / natural gas) Responses have included: Reformulated products and substitutions (e.g., shifting away from HFCS to other sweeteners, including table sugar (sucrose)) Realignment of supply chains to include better inventory management, supply chain visibility and ingredient traceability / supplier management Increased collaboration between retailers and manufacturers to better synchronize demand with supply, minimizing costs and inventory positions Consumers are increasingly visiting corporate websites to understand more about the products they are consuming, including health-related concerns There is an increasing focus on lifestyle marketing As a consequence, F&B manufacturers must become more demand driven, but seek to minimize complexity Aligning people and processes with the end consumer Post-merger integration Managing complexity of multiple brands, distribution nodes, country-specific formulation / packaging / branding requirements Gathering data on consumer activity to better shape demand and segment markets
  • #7 Predictive modeling: Classification Simulation: Also physical modeling, “What will happen if … ?” Forecasting: Time series analysis Alerts: Current conditions suggest problem is or will occur