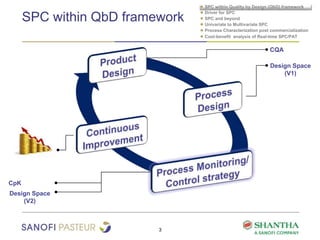
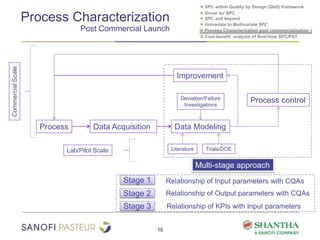
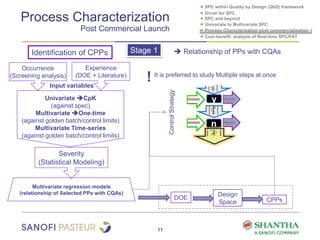
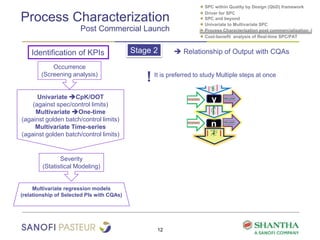
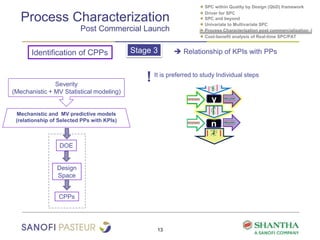
1) The document discusses strategies for statistical process control (SPC) within a quality by design (QbD) framework for efficient manufacturing.
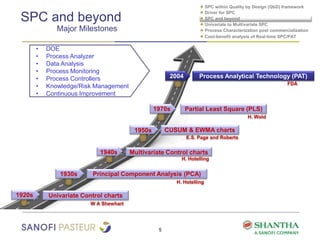
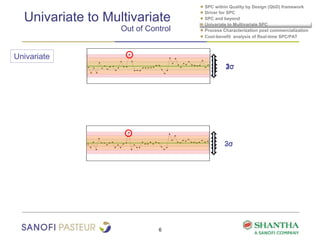
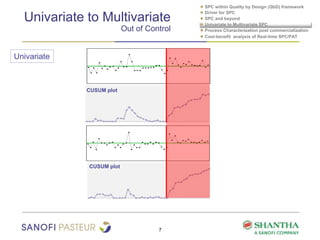
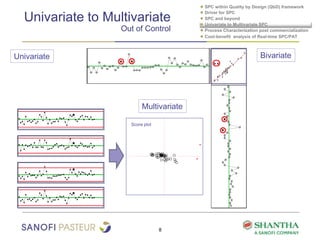
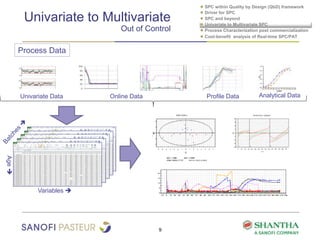
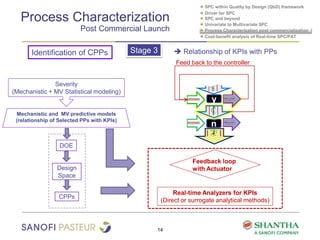
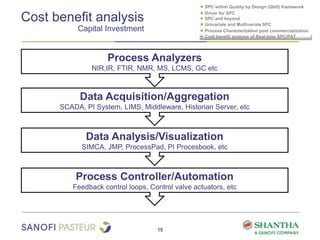
2) It covers univariate and multivariate SPC, process characterization post-commercialization using a multi-stage approach, and a cost-benefit analysis of real-time SPC and process analytical technology (PAT).
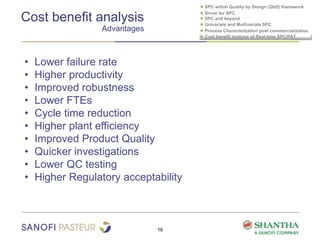
3) The benefits of real-time SPC/PAT include lower failure rates, higher productivity, improved robustness, lower costs, quicker investigations, and higher regulatory acceptability.
The document discusses integrating test-driven development (TDD) practices into SAP Solution Manager change management processes. It proposes additional roles for verification by a solution architect and peer review. Steps are added to the change document for testing and peer review before approval. Integrating transport-related checks from the ABAP Test Cockpit provides added value. While developers may not have less work or more flexibility, they can focus on business tests and gain easier maintenance through increased transparency and a single source of truth.
This document is an evaluation questionnaire about Advanced Product Quality Planning (APQP). It contains 10 multiple choice questions about APQP. The questions cover topics like the definition of APQP, its phases and important outputs, elements of good planning, and documents linked together in the APQP process. The goal of the questionnaire is to test knowledge of the key aspects and stages of implementing the APQP methodology.
SPC is a mid-size printing company that takes a consultative approach to help clients respond effectively to market changes through a wide range of printing technologies and expertise. They apply their knowledge to help clients optimize direct mail programs through solutions like closed-end mailers, open-end mailers, and Trackards that can be personalized with data and graphics. SPC is committed to sustainability and reducing clients' stress through single-source solutions, streamlined production, and helping exceed objectives.
Statistical Process Control (SPC) is a well described framework used to identify weak points in any process and predict the probability of failure in it. The distribution parameters of process metrics have been translated into process capability, which evolved in the 1990s into the Six Sigma methodology in a number of incarnations. However, all techniques derived for SPC have two important weaknesses: they assume that the process metric is expected to be in a steady state and they assume that the process metric is normally distributed, or can be converted to a normal distribution. The concepts and ideas outlined in this paper make it possible to overcome these two shortcomings. Our methodology is a generalization of traditional SPC to nonstationary and non-Gaussian metrics. The techniques outlined in this paper have been developed and validated for the IT industry, but they can be easily translated into other domains.
Statistical process control (SPC) uses tools like control charts to monitor processes and identify sources of variation. Control charts graphically display process data over time relative to control limits, showing whether the process average and variation are stable and capable of meeting specifications. SPC helps determine if a process is stable and capable over time by identifying trends, cycles, or data points outside control limits that indicate special causes of variation requiring process improvement.
Control charts and statistical process control (SPC) allow companies to monitor processes, detect issues, and enact improvements. Control charts display process data over time and help identify when processes are behaving unusually due to "special causes." SPC uses statistics to set control limits on charts and determine whether a process is in or out of statistical control. Implementing control charts involves selecting processes and variables to measure, collecting baseline data to create charts, training operators, and continuously monitoring and improving processes.
This document provides a summary of a presentation on Statistical Process Control (SPC). It outlines the contents, which include an introduction to statistics, control charts, process capability, and implementing an effective SPC system. It also describes how to order the presentation and notes it will be delivered via download as a PowerPoint file licensed for a single facility. The presentation is priced at $49 and provides information to help users understand and apply SPC within their organization.
This was presented at an ASQLA Section 700 monthly meeting in 2012.
This covers the basics of SPC and some of the things that need to be in place before SPC can be used effectively like a proper Gage R&R evaluation, proper specs derived and characterization of the process performed using Design of Experiments. Also covered are the main cultural barriers to implementation and some suggestions on how to proceed.
Also shown are some advanced methods of charting such as Delta from Target that allows easier use of SPC by floor shop personnel and maintains date/time sequence flow of product/measurements when there are multiple products run on a single machine.
Regulatory expectation & design approach on continuous process verificationKaran Rajendra Khairnar
This presentation will guide you on regulatory expectation & how to design approach on Continuous process verification (Stage III) of Process Validation
Karan7may@gmail.com
Rutgers CM Seminar - QbD Process Tech 051716-R1Paul Brodbeck
QbD Process Technologies provides advanced process automation and data management solutions to enable continuous manufacturing of pharmaceuticals. Their ContinuousPlant software suite integrates production equipment with process control, in-process monitoring using PAT, real-time data collection, and material traceability systems. This allows manufacturers to design quality into their continuous processes and produce drugs more efficiently and reliably than traditional batch methods. The solutions were presented, including process automation with DeltaV, real-time PAT with synTQ, data analytics tools, and future architectures from Rutgers for fully continuous manufacturing.
The document provides a summary of Naresh Kumar Pradhan's professional experience and qualifications. It outlines his 7+ years of experience in business excellence and supply chain management, including roles leading business process reengineering, supply chain optimization, and operational excellence projects. It also lists his academic qualifications, including a PGDM in IT and operations and a bachelor's degree in chemical engineering.
Compressed Timelines for Breakthrough Therapies: Impact on Process Characteri...KBI Biopharma
This document discusses strategies for accelerating process characterization and validation timelines for biologics with breakthrough therapy designations. It recommends establishing a scalable single-use cell culture manufacturing platform. Process development should utilize high-throughput and single-use technologies. Process characterization can be accelerated by conducting experiments in parallel, leveraging prior clinical data, and using design of experiments approaches. Scale-down models should closely mimic commercial processes and be established using equivalent parameters like power input. This will allow process characterization data packages to support regulatory submissions within 9 months.
Semantic Validation: Enforcing Kafka Data Quality Through Schema-Driven Verif...HostedbyConfluent
"Incorrect data produced into Kafka can be a poison pill that has the potential to disrupt businesses built upon Kafka. The “Semantic Validation” feature is designed to address the challenges posed by incorrect or unexpected data in Kafka’s data processing pipelines, with the goal of mitigating such disruptions. By allowing users to define robust field constraints directly within schemas, such as Avro, we aim to enhance data quality and minimize the downstream impacts of inaccurate data in Kafka.
Furthermore, this feature can be expanded to include offline data processing, in addition to Kafka and Flink real-time processing. By combining real-time processing, batch analytics, and AI data pipelines, a global semantic validation system can be built.
In our upcoming talk, we will delve into the use cases of this feature, discuss its architecture, provide examples of defining rules, and explain how we enforce these rules. Ultimately, we will demonstrate how this feature can significantly enhance reliability and trustworthiness in Uber’s data processing pipelines."
The regulatory focus of facilities that manufacture therapeutic products for humans is centered on a product-process-facility attribute driven methodology where risk identification and mitigation are critical quality attributes. Under this methodology, the manufacturing process and the product requirements, not the building, become not only the main drivers for CD efforts, but must also provide a clear approach and understanding of how the building elements must be defined and operated in order to ensure patient safety in the manufacture of the product. This requires an enterprise approach to facility design focusing on:
Process-driven understanding around operational analysis
Regulatory philosophy
Business drivers
Management needs
Integrated hand-off to detailed design activities
Performance issues are regularly caught too late leading to increased cost for fixing. We propose a process on how to make performance testing lightweight, execute it on early stages, reduce time and cost of fixes. Applying the same principal that we use for functional testing, performance testing could be integrated in CI/CD pipeline. Learn more about CPT in our blog: https://blog.griddynamics.com/what-is-continuous-performance-testing-and-why-it-is-needed
The document summarizes a presentation on the Project P project for developing model compilers for safety critical systems. Some key points:
- Project P developed a generic framework and code generator called QGEN to generate code from models in languages like Simulink and Stateflow to languages like C and Ada.
- The framework and QGEN were qualified up to DO-178C level TQL1 to allow their use in safety critical systems.
- Case studies demonstrated the use of QGEN at companies like Thales Alenia Space to generate Ada code for a spacecraft attitude control system from Simulink models.
Role of quality by design (qb d) in quality assurance of pharmaceutical productNitin Patel
This document discusses the role of Quality by Design (QbD) in assuring quality of pharmaceutical products. It defines QbD and compares the traditional quality assessment system to the QbD approach. The document outlines the steps of a QbD program, including defining target quality profiles, identifying critical quality attributes and process parameters, designing the manufacturing process and establishing a control strategy. It also discusses tools used in QbD like design of experiments and risk assessment.
In this presentation from IVT's GMP Week, Journal of Validation Technology Editor-in-Chief, Paul Pluta, Ph.D., asks "can compliance be improved by using quality by design [QbD] concepts?" Pluta discussed the QbD application, development of validation master plans, and the lifecycle approach to process validation. Furthermore, he discusses how to incorporate these essential parts of the validation process to implement effective, and efficient, compliance by design into the quality system.
The document outlines the work experience of an individual from 2010 to 2012 as a Chemical Process Engineer at Chang Chun Group in Miaoli, Taiwan. In this role, some of their key responsibilities included establishing quality control systems, improving production processes, programming automated control systems, developing standard operating procedures, reducing costs, and addressing customer needs. They worked on tasks such as statistical analysis, equipment design, maintenance improvements, and resolving issues like production troubles and material aging.
The document outlines a waste elimination program for a manufacturing operation with six key criteria across three stages: product development, product trial, and mass production. The criteria are skills and capabilities, efficiencies and effectiveness, systems and methodologies, inventory and logistics, operation and product costs, and automation and robotics. The goals of the criteria are to provide the basis for efficient and quality operations, create supportive systems, and align operations and costs with targets throughout the product lifecycle.
Raghu nambiar:industry standard benchmarkshdhappy001
Industry standard benchmarks have played a crucial role in advancing the computing industry by enabling healthy competition that drives product improvements and new technologies. Major benchmarking organizations like TPC, SPEC, and SPC have developed numerous benchmarks over time to keep up with industry needs. Looking ahead, new benchmarks are needed to address emerging technologies like cloud, big data, and the internet of things. International conferences and workshops bring together experts to collaborate on developing these new, relevant benchmarks.
ISOQualitas provides automotive product lifecycle management (PLM) software. The software covers the full PLM process from product development through manufacturing. It includes features such as multi-level bills of material, design FMEA, prototype control plans, APQP project management, quality certificates, process FMEAs, production control plans, dimensional reports, process validation, statistical process control, and nonconformity management. The software aims to provide a fully integrated PLM solution, powerful planning features, total data consistency, enhanced transparency and communication, full compliance with standards, project data security, and a complete solution in a single software to reduce time to market.
Agile Data Science on Greenplum Using Airflow - Greenplum Summit 2019VMware Tanzu
This document discusses using Apache Airflow to build agile data science pipelines on Greenplum Database. It outlines the typical data science phases of discovery and operationalization. In the discovery phase, rapid iteration and experimentation is used. The operationalization phase focuses on building automated, testable pipelines for data preparation, model training/scoring, monitoring, and APIs. It provides examples of directed acyclic graphs (DAGs) for end-to-end data processing, model training, model scoring, and model re-training. It emphasizes the importance of testing, monitoring failures, and fixing errors for responsive pipelines. Greenplum and Jupyter notebooks enable agile data science in discovery, while Greenplum, Airflow,
This document discusses how design of experiments (DOE) and multivariate data analysis (MVDA) using Umetrics software can help optimize biomanufacturing processes and ensure quality. DOE is used to build process understanding, identify critical parameters, and define a design space. MVDA condenses large process data sets into informative plots to improve process monitoring, control, and verification. Case studies from companies like Novartis, Biogen, and Lonza demonstrate benefits like increased yield, reduced risk, and improved root cause analysis through the use of DOE and MVDA tools.
Similar to IBC Asia SPC presentation Mayank_Ver4 (20)
1. Modeling and Process Control
Strategies for Efficient
Manufacturing
IBC Asia BioProcess & Technology Summit 2015
28-29 October, Singapore
Mayank Garg
Shantha Biotechnics Private Limited (A Sanofi Company)
1
2. Presentation snapshot
2
● Statistical Process Control (SPC) within Quality by Design (QbD) framework
● Driver for SPC
● SPC and beyond
● Univariate and Multivariate SPC
● Process Characterization post commercialization
● Cost-benefit analysis of Real-time SPC/PAT
3. SPC within QbD framework
3
● SPC within Quality by Design (QbD) framework
● Driver for SPC
● SPC and beyond
● Univariate to Multivariate SPC
● Process Characterization post commercialization
● Cost-benefit analysis of Real-time SPC/PAT
CQA
CpK
Design Space
(V1)
Design Space
(V2)
4. Critical Process
Parameters
Critical Raw MaterialsRaw Materials
Process Parameters
Driver for SPC
4
● SPC within Quality by Design (QbD) framework
● Driver for SPC
● SPC and beyond
● Univariate to Multivariate SPC
● Process Characterization post commercialization
x
y
z
Key Performance
Indicator
Input Output
Current Objective
CQA
CpK <1 CpK >1
Significant effect of input
on CQA
Strong relationship of output
parameters on CQA
● Cost-benefit analysis of Real-time SPC/PAT
5. 5
● SPC within Quality by Design (QbD) framework
● Driver for SPC
● SPC and beyond
● Univariate to Multivariate SPC
● Process Characterization post commercialization
W A Shewhart
Univariate Control charts1920s
Multivariate Control charts
H. Hotelling
Principal Component Analysis (PCA)
H. Hotelling
CUSUM & EWMA charts
E.S. Page and Roberts
Partial Least Square (PLS)
H. Wold
2004 Process Analytical Technology (PAT)
1930s
1940s
1950s
1970s
FDA
• DOE
• Process Analyzer
• Data Analysis
• Process Monitoring
• Process Controllers
• Knowledge/Risk Management
• Continuous Improvement
SPC and beyond
Major Milestones
● Cost-benefit analysis of Real-time SPC/PAT
6. 6
● SPC within Quality by Design (QbD) framework
● Driver for SPC
● SPC and beyond
● Univariate to Multivariate SPC
● Process Characterization post commercialization
Univariate to Multivariate
Out of Control
Univariate
● Cost-benefit analysis of Real-time SPC/PAT
1σ
1σ
2σ
2σ
3σ
3σ
7. CUSUM plot
CUSUM plot
7
● SPC within Quality by Design (QbD) framework
● Driver for SPC
● SPC and beyond
● Univariate to Multivariate SPC
● Process Characterization post commercialization
Univariate
Univariate to Multivariate
Out of Control
● Cost-benefit analysis of Real-time SPC/PAT
8. 8
● SPC within Quality by Design (QbD) framework
● Driver for SPC
● SPC and beyond
● Univariate to Multivariate SPC
● Process Characterization post commercialization
Bivariate
Multivariate
Univariate <
<
<
<
Score plot
Univariate to Multivariate
Out of Control
● Cost-benefit analysis of Real-time SPC/PAT
9. 9
● SPC within Quality by Design (QbD) framework
● Driver for SPC
● SPC and beyond
● Univariate to Multivariate SPC
● Process Characterization post commercialization
Variables
Age
Process Data
Univariate to Multivariate
Out of Control
Univariate Data Online Data Profile Data Analytical Data
● Cost-benefit analysis of Real-time SPC/PAT
10. Process Characterization
Post Commercial Launch
10
● SPC within Quality by Design (QbD) framework
● Driver for SPC
● SPC and beyond
● Univariate to Multivariate SPC
● Process Characterization post commercialization
Process Data Acquisition Data Modeling
Process control
Improvement
Trials/DOELiterature
Deviation/Failure
Investigations
CommercialScale
Lab/Pilot Scale
Multi-stage approach
● Cost-benefit analysis of Real-time SPC/PAT
Relationship of Input parameters with CQAs
Relationship of Output parameters with CQAs
Relationship of KPIs with Input parameters
Stage 1
Stage 2
Stage 3
11. Process Characterization
Post Commercial Launch
11
● SPC within Quality by Design (QbD) framework
● Driver for SPC
● SPC and beyond
● Univariate to Multivariate SPC
● Process Characterization post commercialization
Identification of CPPs
Severity
(Statistical Modeling)
y
n
Occurrence
(Screening analysis)
Univariate CpK
(against spec)
Multivariate One-time
(against golden batch/control limits)
Multivariate Time-series
(against golden batch/control limits)
Multivariate regression models
(relationship of Selected PPs with CQAs)
ControlStrategy
Design
Space
! It is preferred to study Multiple steps at once
Stage 1
Experience
(DOE + Literature)
Input variables
● Cost-benefit analysis of Real-time SPC/PAT
DOE CPPs
Relationship of PPs with CQAs
12. Process Characterization
Post Commercial Launch
12
● SPC within Quality by Design (QbD) framework
● Driver for SPC
● SPC and beyond
● Univariate to Multivariate SPC
● Process Characterization post commercialization
Severity
(Statistical Modeling)
y
n
Occurrence
(Screening analysis)
Univariate CpK/OOT
(against spec/control limits)
Multivariate One-time
(against golden batch/control limits)
Multivariate Time-series
(against golden batch/control limits)
Multivariate regression models
(relationship of Selected PIs with CQAs)
Stage 2
● Cost-benefit analysis of Real-time SPC/PAT
Identification of KPIs
! It is preferred to study Multiple steps at once
Relationship of Output with CQAs
13. Process Characterization
Post Commercial Launch
13
● SPC within Quality by Design (QbD) framework
● Driver for SPC
● SPC and beyond
● Univariate to Multivariate SPC
● Process Characterization post commercialization
y
n
Stage 3
Severity
(Mechanistic + MV Statistical modeling)
Mechanistic and MV predictive models
(relationship of Selected PPs with KPIs)
● Cost-benefit analysis of Real-time SPC/PAT
Identification of CPPs
! It is preferred to study Individual steps
Design
Space
DOE
CPPs
Relationship of KPIs with PPs
14. Process Characterization
Post Commercial Launch
14
● SPC within Quality by Design (QbD) framework
● Driver for SPC
● SPC and beyond
● Univariate to Multivariate SPC
● Process Characterization post commercialization
y
n
Feed back to the controller
Real-time Analyzers for KPIs
(Direct or surrogate analytical methods)
Feedback loop
with Actuator
● Cost-benefit analysis of Real-time SPC/PAT
Identification of CPPs
Severity
(Mechanistic + MV Statistical modeling)
Mechanistic and MV predictive models
(relationship of Selected PPs with KPIs)
Design
Space
DOE
CPPs
Stage 3 Relationship of KPIs with PPs
15. 15
● SPC within Quality by Design (QbD) framework
● Driver for SPC
● SPC and beyond
● Univariate and Multivariate SPC
● Process Characterization post commercialization
● Cost benefit analysis of Real-time SPC/PAT
Cost benefit analysis
Capital Investment
Process Analyzers
NIR,IR, FTIR, NMR, MS, LCMS, GC etc
Data Acquisition/Aggregation
SCADA, PI System, LIMS, Middleware, Historian Server, etc
Data Analysis/Visualization
SIMCA, JMP, ProcessPad, PI Procesbook, etc
Process Controller/Automation
Feedback control loops, Control valve actuators, etc
16. 16
● SPC within Quality by Design (QbD) framework
● Driver for SPC
● SPC and beyond
● Univariate and Multivariate SPC
● Process Characterization post commercialization
● Cost benefit analysis of Real-time SPC/PAT
Cost benefit analysis
Advantages
• Lower failure rate
• Higher productivity
• Improved robustness
• Lower FTEs
• Cycle time reduction
• Higher plant efficiency
• Improved Product Quality
• Quicker investigations
• Lower QC testing
• Higher Regulatory acceptability