Download to read offline


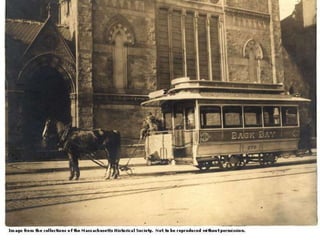
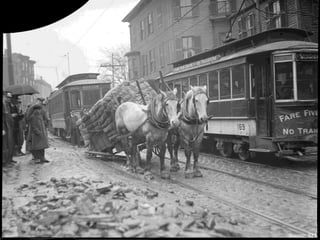
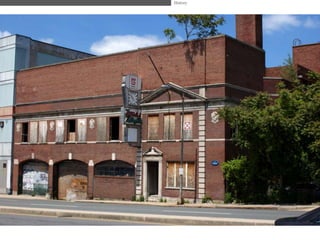
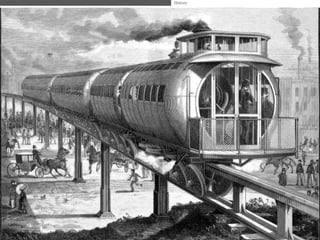
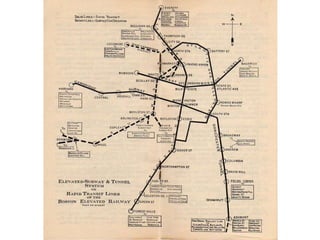
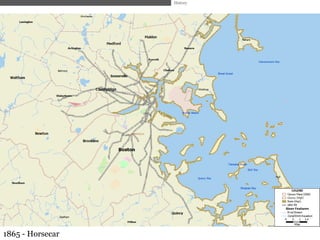
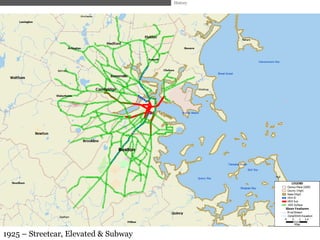
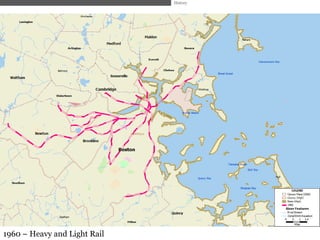


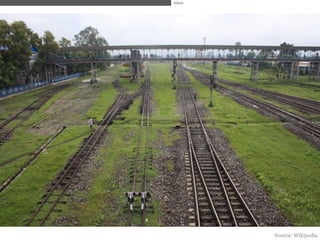
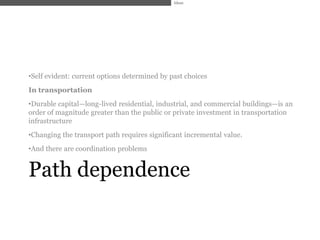
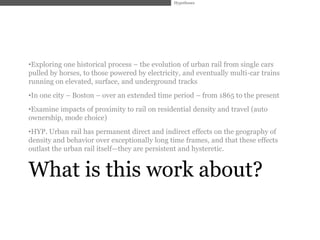
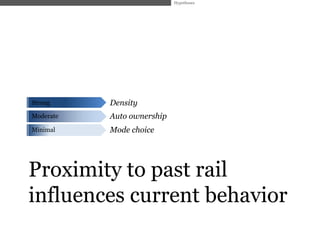

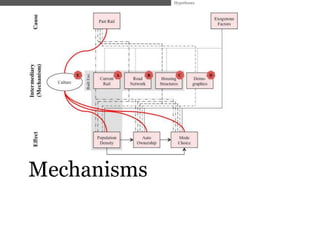


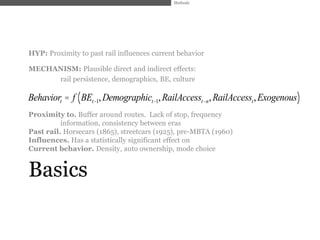


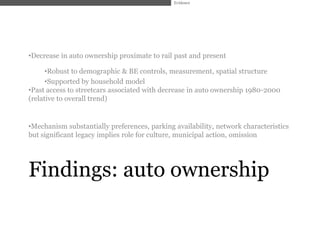
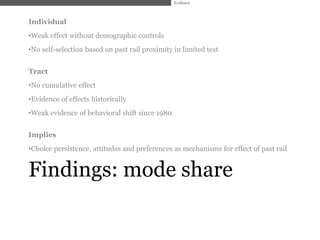
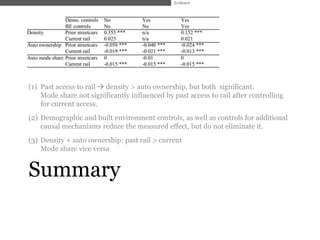


Past urban rail infrastructure has long-lasting effects on current residential density, auto ownership, and travel behavior according to this document. The study examines how proximity to historic rail from 1865 to the present in Boston influences current density, auto ownership, and commuting modes. It finds that past rail access is strongly correlated with higher current density and lower auto ownership, though has a weaker effect on travel modes. The persistence is likely due to durable housing and transportation networks built around old rail, as well as cultural and policy mechanisms.


