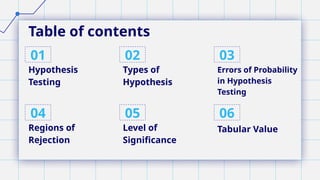
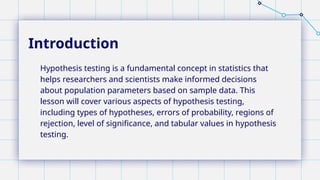
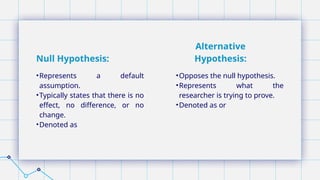
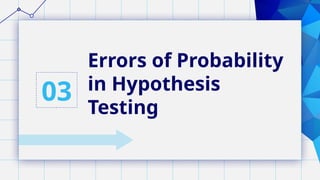
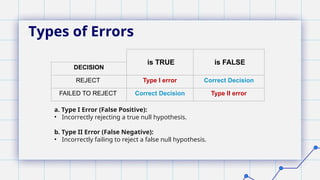
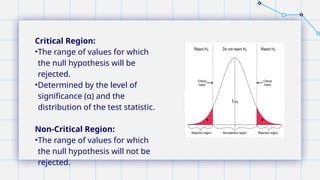
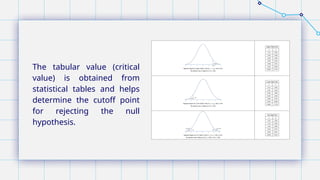
Statistics -
MA-MATH801
Prepared by: Mr. John Luis M.
Bantolino
Table of contents
01
04
02
05
03
06
Hypothesis
Testing
Types of
Hypothesis
Errors of Probability
in Hypothesis
Testing
Regions of
Rejection
Level of
Significance
Tabular Value
Hypothesis
Testing
0
1
Introduction
Hypothesis testing is a fundamental concept in statistics that
helps researchers and scientists make informed decisions
about population parameters based on sample data. This
lesson will cover various aspects of hypothesis testing,
including types of hypotheses, errors of probability, regions of
rejection, level of significance, and tabular values in hypothesis
testing.
Types of
Hypothesis
02
•Opposes the null hypothesis.
•Represents what the
researcher is trying to prove.
•Denoted as or
•Represents a default
assumption.
•Typically states that there is no
effect, no difference, or no
change.
•Denoted as
Null Hypothesis:
Alternative
Hypothesis:
Errors of Probability
in Hypothesis
Testing
03
Types of Errors
is TRUE is FALSE
DECISION
REJECT Type I error Correct Decision
FAILED TO REJECT Correct Decision Type II error
a. Type I Error (False Positive):
• Incorrectly rejecting a true null hypothesis.
b. Type II Error (False Negative):
• Incorrectly failing to reject a false null hypothesis.
Regions of
Rejection
04
Critical Region:
•The range of values for which
the null hypothesis will be
rejected.
•Determined by the level of
significance (α) and the
distribution of the test statistic.
Non-Critical Region:
•The range of values for which
the null hypothesis will not be
rejected.
Level of
Significance
05
The level of significance refers to the degree of significance in
which we reject and fail to reject the null hypothesis. In
hypothesis testing, 100 % accuracy does not guarantee in
rejecting and in failing to reject a null hypothesis. The generally
accepted levels are 1%, 5% and 10 %. However, the 5% level of
significance has become the most common in practice.
Tabular Value
06
The tabular value (critical
value) is obtained from
statistical tables and helps
determine the cutoff point
for rejecting the null
hypothesis.

HYPOTHESIS TESTING - STATISTICS AND PROBABILITY

  • 1.
    Statistics - MA-MATH801 Prepared by:Mr. John Luis M. Bantolino
  • 2.
    Table of contents 01 04 02 05 03 06 Hypothesis Testing Typesof Hypothesis Errors of Probability in Hypothesis Testing Regions of Rejection Level of Significance Tabular Value
  • 3.
  • 4.
    Introduction Hypothesis testing isa fundamental concept in statistics that helps researchers and scientists make informed decisions about population parameters based on sample data. This lesson will cover various aspects of hypothesis testing, including types of hypotheses, errors of probability, regions of rejection, level of significance, and tabular values in hypothesis testing.
  • 5.
  • 6.
    •Opposes the nullhypothesis. •Represents what the researcher is trying to prove. •Denoted as or •Represents a default assumption. •Typically states that there is no effect, no difference, or no change. •Denoted as Null Hypothesis: Alternative Hypothesis:
  • 7.
    Errors of Probability inHypothesis Testing 03
  • 8.
    Types of Errors isTRUE is FALSE DECISION REJECT Type I error Correct Decision FAILED TO REJECT Correct Decision Type II error a. Type I Error (False Positive): • Incorrectly rejecting a true null hypothesis. b. Type II Error (False Negative): • Incorrectly failing to reject a false null hypothesis.
  • 9.
  • 10.
    Critical Region: •The rangeof values for which the null hypothesis will be rejected. •Determined by the level of significance (α) and the distribution of the test statistic. Non-Critical Region: •The range of values for which the null hypothesis will not be rejected.
  • 11.
  • 12.
    The level ofsignificance refers to the degree of significance in which we reject and fail to reject the null hypothesis. In hypothesis testing, 100 % accuracy does not guarantee in rejecting and in failing to reject a null hypothesis. The generally accepted levels are 1%, 5% and 10 %. However, the 5% level of significance has become the most common in practice.
  • 13.
  • 14.
    The tabular value(critical value) is obtained from statistical tables and helps determine the cutoff point for rejecting the null hypothesis.