Hypothesis testing for categorical data
•Download as PPTX, PDF•
0 likes•97 views
This document discusses three statistical tests: 1) A one-sample z-test is used to test if the proportion of breast cancer in female beauticians who use hair dye is greater than the national average. The null hypothesis is rejected, showing hair dye use is linked to higher breast cancer risk. 2) A two-sample z-test compares the proportion of children who died in car accidents when wearing a seatbelt vs not. The null hypothesis cannot be rejected, so seatbelt use may not impact children's risk of death in accidents. 3) A chi-squared test examines the relationship between bicycle helmet use and head injuries. The null hypothesis is rejected, demonstrating helmet use reduces the risk of head injury
Report
Share
Report
Share

Recommended
Recommended
Basic outline of Theoretical perspectives: Fertility, Mortality, MigrationBasic outline of Theoretical perspectives: Fertility, Mortality, Migration
Basic outline of Theoretical perspectives: Fertility, Mortality, MigrationRamakrishna Mission Vivekananda Educational and Research Institute
More Related Content
What's hot
Basic outline of Theoretical perspectives: Fertility, Mortality, MigrationBasic outline of Theoretical perspectives: Fertility, Mortality, Migration
Basic outline of Theoretical perspectives: Fertility, Mortality, MigrationRamakrishna Mission Vivekananda Educational and Research Institute
What's hot (20)
Determinants of under five children morbidity and mortality
Determinants of under five children morbidity and mortality
Application of medical, spiritual and holistic model in public health
Application of medical, spiritual and holistic model in public health
Basic outline of Theoretical perspectives: Fertility, Mortality, Migration
Basic outline of Theoretical perspectives: Fertility, Mortality, Migration
Similar to Hypothesis testing for categorical data
Similar to Hypothesis testing for categorical data (20)
12 RUNNING HEAD SIGNATURE ASSIGNMENT Signature Assign.docx
12 RUNNING HEAD SIGNATURE ASSIGNMENT Signature Assign.docx
Measuring clinical utility: uncertainty in Net Benefit
Measuring clinical utility: uncertainty in Net Benefit
11 RUNNING HEAD SIGNATURE ASSIGNMENT Signature Assign.docx
11 RUNNING HEAD SIGNATURE ASSIGNMENT Signature Assign.docx
Examenes radiologicos y riesgo de cancer en pacientes
Examenes radiologicos y riesgo de cancer en pacientes
Question 1 1. Assume that the data has a normal distribution .docx
Question 1 1. Assume that the data has a normal distribution .docx
Running head HYPOTHESIS TEST 1HYPOTHESIS TESTING.docx
Running head HYPOTHESIS TEST 1HYPOTHESIS TESTING.docx
Running head COURSE PROJECT NCLEX Memorial Hospital .docx
Running head COURSE PROJECT NCLEX Memorial Hospital .docx
Recently uploaded
PEMESANAN OBAT ASLI : +6287776558899
Cara Menggugurkan Kandungan usia 1 , 2 , bulan - obat penggugur janin - cara aborsi kandungan - obat penggugur kandungan 1 | 2 | 3 | 4 | 5 | 6 | 7 | 8 bulan - bagaimana cara menggugurkan kandungan - tips Cara aborsi kandungan - trik Cara menggugurkan janin - Cara aman bagi ibu menyusui menggugurkan kandungan - klinik apotek jual obat penggugur kandungan - jamu PENGGUGUR KANDUNGAN - WAJIB TAU CARA ABORSI JANIN - GUGURKAN KANDUNGAN AMAN TANPA KURET - CARA Menggugurkan Kandungan tanpa efek samping - rekomendasi dokter obat herbal penggugur kandungan - ABORSI JANIN - aborsi kandungan - jamu herbal Penggugur kandungan - cara Menggugurkan Kandungan yang cacat - tata cara Menggugurkan Kandungan - obat penggugur kandungan di apotik kimia Farma - obat telat datang bulan - obat penggugur kandungan tuntas - obat penggugur kandungan alami - klinik aborsi janin gugurkan kandungan - ©Cytotec ™misoprostol BPOM - OBAT PENGGUGUR KANDUNGAN ®CYTOTEC - aborsi janin dengan pil ©Cytotec - ®Cytotec misoprostol® BPOM 100% - penjual obat penggugur kandungan asli - klinik jual obat aborsi janin - obat penggugur kandungan di klinik k-24 || obat penggugur ™Cytotec di apotek umum || ®CYTOTEC ASLI || obat ©Cytotec yang asli 200mcg || obat penggugur ASLI || pil Cytotec© tablet || cara gugurin kandungan || jual ®Cytotec 200mcg || dokter gugurkan kandungan || cara menggugurkan kandungan dengan cepat selesai dalam 24 jam secara alami buah buahan || usia kandungan 1_2 3_4 5_6 7_8 bulan masih bisa di gugurkan || obat penggugur kandungan ®cytotec dan gastrul || cara gugurkan pembuahan janin secara alami dan cepat || gugurkan kandungan || gugurin janin || cara Menggugurkan janin di luar nikah || contoh aborsi janin yang benar || contoh obat penggugur kandungan asli || contoh cara Menggugurkan Kandungan yang benar || telat haid || obat telat haid || Cara Alami gugurkan kehamilan || obat telat menstruasi || cara Menggugurkan janin anak haram || cara aborsi menggugurkan janin yang tidak berkembang || gugurkan kandungan dengan obat ©Cytotec || obat penggugur kandungan ™Cytotec 100% original || HARGA obat penggugur kandungan || obat telat haid 1 bulan || obat telat menstruasi 1-2 3-4 5-6 7-8 BULAN || obat telat datang bulan || cara Menggugurkan janin 1 bulan || cara Menggugurkan Kandungan yang masih 2 bulan || cara Menggugurkan Kandungan yang masih hitungan Minggu || cara Menggugurkan Kandungan yang masih usia 3 bulan || cara Menggugurkan usia kandungan 4 bulan || cara Menggugurkan janin usia 5 bulan || cara Menggugurkan kehamilan 6 Bulan
________&&&_________&&&_____________&&&_________&&&&____________
Cara Menggugurkan Kandungan Usia Janin 1 | 7 | 8 Bulan Dengan Cepat Dalam Hitungan Jam Secara Alami, Kami Siap Meneriman Pesanan Ke Seluruh Indonesia, Melputi: Ambon, Banda Aceh, Bandung, Banjarbaru, Batam, Bau-Bau, Bengkulu, Binjai, Blitar, Bontang, Cilegon, Cirebon, Depok, Gorontalo, Jakarta, Jayapura, Kendari, Kota Mobagu, Kupang, LhokseumaweCara Menggugurkan Kandungan Dengan Cepat Selesai Dalam 24 Jam Secara Alami Bu...
Cara Menggugurkan Kandungan Dengan Cepat Selesai Dalam 24 Jam Secara Alami Bu...Cara Menggugurkan Kandungan 087776558899
Recently uploaded (20)
💚Call Girls In Amritsar 💯Anvi 📲🔝8725944379🔝Amritsar Call Girl No💰Advance Cash...
💚Call Girls In Amritsar 💯Anvi 📲🔝8725944379🔝Amritsar Call Girl No💰Advance Cash...
Nagpur Call Girl Service 📞9xx000xx09📞Just Call Divya📲 Call Girl In Nagpur No💰...
Nagpur Call Girl Service 📞9xx000xx09📞Just Call Divya📲 Call Girl In Nagpur No💰...
Bandra East [ best call girls in Mumbai Get 50% Off On VIP Escorts Service 90...
Bandra East [ best call girls in Mumbai Get 50% Off On VIP Escorts Service 90...
Kolkata Call Girls Naktala 💯Call Us 🔝 8005736733 🔝 💃 Top Class Call Girl Se...
Kolkata Call Girls Naktala 💯Call Us 🔝 8005736733 🔝 💃 Top Class Call Girl Se...
Chandigarh Call Girls Service ❤️🍑 9809698092 👄🫦Independent Escort Service Cha...
Chandigarh Call Girls Service ❤️🍑 9809698092 👄🫦Independent Escort Service Cha...
💚Chandigarh Call Girls 💯Riya 📲🔝8868886958🔝Call Girls In Chandigarh No💰Advance...
💚Chandigarh Call Girls 💯Riya 📲🔝8868886958🔝Call Girls In Chandigarh No💰Advance...
Goa Call Girl Service 📞9xx000xx09📞Just Call Divya📲 Call Girl In Goa No💰Advanc...
Goa Call Girl Service 📞9xx000xx09📞Just Call Divya📲 Call Girl In Goa No💰Advanc...
❤️Amritsar Escorts Service☎️9815674956☎️ Call Girl service in Amritsar☎️ Amri...
❤️Amritsar Escorts Service☎️9815674956☎️ Call Girl service in Amritsar☎️ Amri...
7 steps How to prevent Thalassemia : Dr Sharda Jain & Vandana Gupta
7 steps How to prevent Thalassemia : Dr Sharda Jain & Vandana Gupta
Premium Call Girls Dehradun {8854095900} ❤️VVIP ANJU Call Girls in Dehradun U...
Premium Call Girls Dehradun {8854095900} ❤️VVIP ANJU Call Girls in Dehradun U...
👉Chandigarh Call Girl Service📲Niamh 8868886958 📲Book 24hours Now📲👉Sexy Call G...
👉Chandigarh Call Girl Service📲Niamh 8868886958 📲Book 24hours Now📲👉Sexy Call G...
Chandigarh Call Girls Service ❤️🍑 9809698092 👄🫦Independent Escort Service Cha...
Chandigarh Call Girls Service ❤️🍑 9809698092 👄🫦Independent Escort Service Cha...
Kolkata Call Girls Shobhabazar 💯Call Us 🔝 8005736733 🔝 💃 Top Class Call Gir...
Kolkata Call Girls Shobhabazar 💯Call Us 🔝 8005736733 🔝 💃 Top Class Call Gir...
Cara Menggugurkan Kandungan Dengan Cepat Selesai Dalam 24 Jam Secara Alami Bu...
Cara Menggugurkan Kandungan Dengan Cepat Selesai Dalam 24 Jam Secara Alami Bu...
🚺LEELA JOSHI WhatsApp Number +91-9930245274 ✔ Unsatisfied Bhabhi Call Girls T...
🚺LEELA JOSHI WhatsApp Number +91-9930245274 ✔ Unsatisfied Bhabhi Call Girls T...
Dehradun Call Girl Service ❤️🍑 8854095900 👄🫦Independent Escort Service Dehradun
Dehradun Call Girl Service ❤️🍑 8854095900 👄🫦Independent Escort Service Dehradun
Jaipur Call Girl Service 📞9xx000xx09📞Just Call Divya📲 Call Girl In Jaipur No💰...
Jaipur Call Girl Service 📞9xx000xx09📞Just Call Divya📲 Call Girl In Jaipur No💰...
ANATOMY AND PHYSIOLOGY OF REPRODUCTIVE SYSTEM.pptx
ANATOMY AND PHYSIOLOGY OF REPRODUCTIVE SYSTEM.pptx
Call Girls Bangalore - 450+ Call Girl Cash Payment 💯Call Us 🔝 6378878445 🔝 💃 ...
Call Girls Bangalore - 450+ Call Girl Cash Payment 💯Call Us 🔝 6378878445 🔝 💃 ...
Hypothesis testing for categorical data
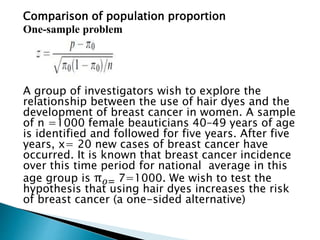
- 1. Comparison of population proportion One-sample problem A group of investigators wish to explore the relationship between the use of hair dyes and the development of breast cancer in women. A sample of n =1000 female beauticians 40–49 years of age is identified and followed for five years. After five years, x= 20 new cases of breast cancer have occurred. It is known that breast cancer incidence over this time period for national average in this age group is π𝑜= 7=1000. We wish to test the hypothesis that using hair dyes increases the risk of breast cancer (a one-sided alternative)
- 2. A one-sided test with 𝐻𝐴=π> 7 1000 Using the conventional choice of α= 0.05 leads to the rejection region z >1.65 From the data P= 20 1000 =0.02 leading to a ‘‘z score’’ of: Z= 0.02−0.007 0.007(0.993)/1000 =4.93 (the observed proportion p is 4.93 standard errors away from the hypothesized value of π𝑜= 7=1000. Since the computed z score falls into the rejection region 4.93 >1.65,the null hypothesis is rejected at the 0.05 level chosen. In fact, the differenceis very highly significant.
- 3. Comparison of two independent groups Pooled proportion In the sample of 123 children who were wearing a seat belt at the time of the accident 3 died. Therefore 𝑃 1= 3 123 =0.024 In the sample of 290 children who were not wearing a seat belt 13 died. Consequently 𝑃 2= 13 290 =0.045
- 5. Conclusion :According to appendix A (Z Score Table- chart value corresponds to area below z score), The P-value of the test is 0.312.Therefore we cannot reject the null hypothesis. The sample collected in this particular study, do not provide evidence that the proportion of children dying differ between those who were wearing seat belts and those who were not.
- 7. The results of the study investigating the effectiveness of bicycle safety helmet in preventing head injury consist of a random sample 793 individuals who were involved in the bicycle accident during a specific year period. Of the 793 individuals who were involved in bicycle accident,147 were wearing safety helmets at the time of the incident and 646 were not. Among those wearing helmets,17 suffered head injury requiring the attention of doctors, whereas the remaining 130 did not; among the individuals not wearing safety helmets ,218 sustained serious head injuries, and 428 did not. Question :Construct 2X2 table and test hypothesis
- 10. For 𝑋2 distribution (appendix D) with 1 degree of freedom, we re reject the null hypothesis and conclude that the proportion of individuals suffering head injuries are not identical in the two proportions. Among persons involved in bicycle accidents, the use of a safety helmet reduces the incidence of head injury.