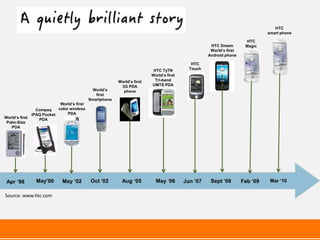
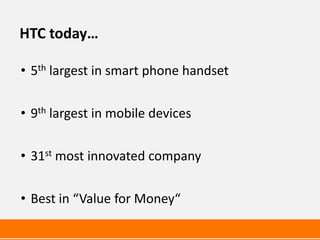
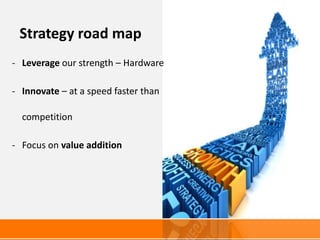
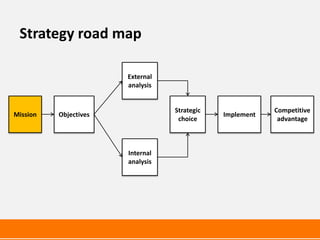
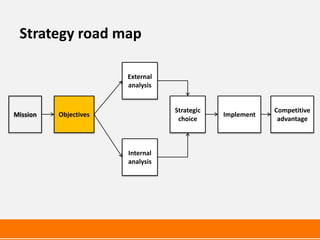
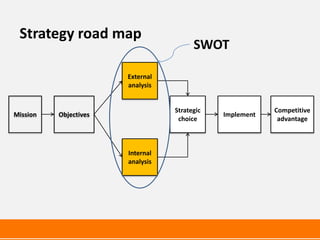
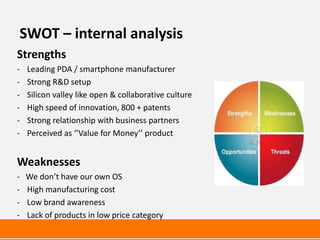
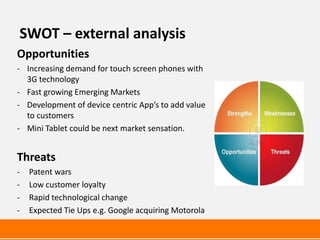
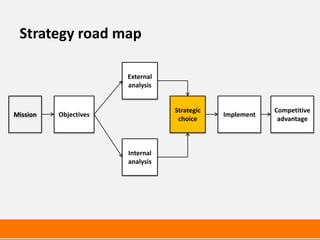
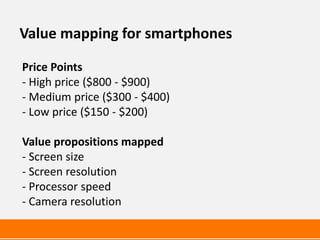
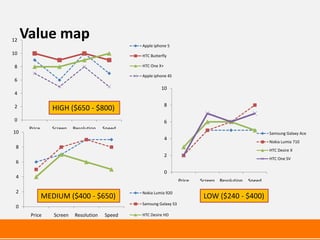
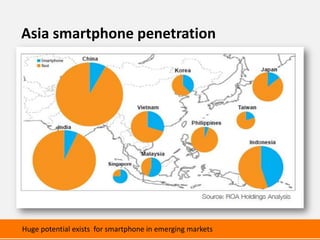
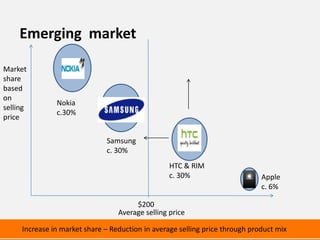
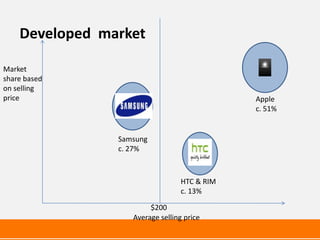
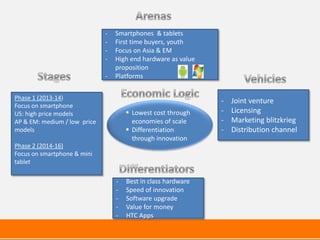
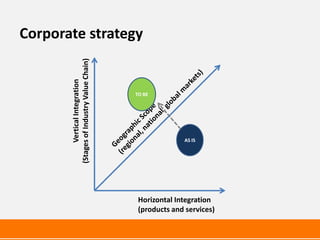
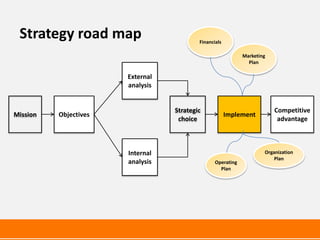
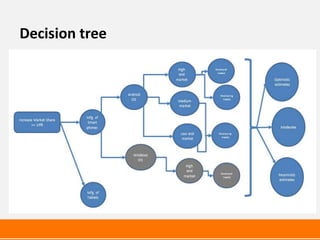
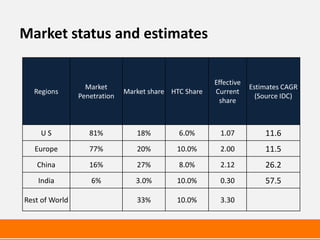
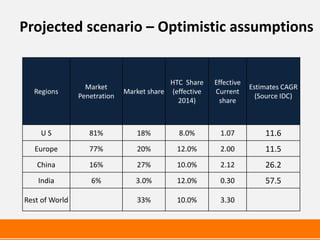
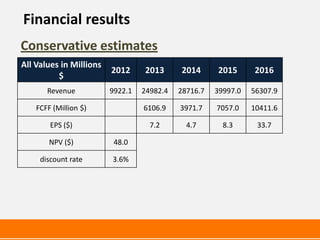
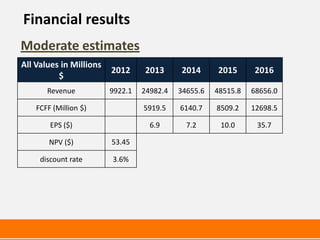
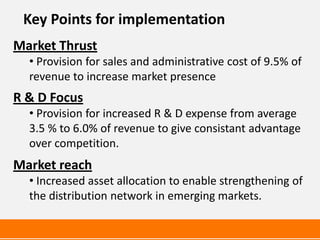
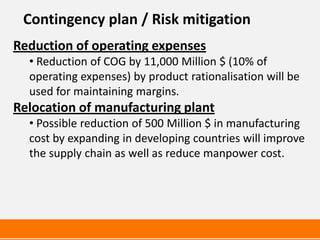
2. HTC
smart phone
HTC
HTC Dream Magic
World’s first
Android phone
HTC
HTC TyTN Touch
World’s first
World’s first Tri-band
3G PDA UMTS PDA
World’s phone
first
Smartphone
World’s first
Compaq color wireless
iPAQ Pocket PDA
World’s first PDA
Palm-Size
PDA
Apr ‘98 May’00 May ‘02 Oct ‘02 Aug ‘05 May ‘06 Jun ‘07 Sept ‘08 Feb ‘09 Mar ‘10
Source: www.htc.com
3. HTC today…
• 5th largest in smart phone handset
• 9th largest in mobile devices
• 31st most innovated company
• Best in “Value for Money“
4. Strategy road map
- Leverage our strength – Hardware
- Innovate – at a speed faster than
competition
- Focus on value addition
10. SWOT – internal analysis
Strengths
- Leading PDA / smartphone manufacturer
- Strong R&D setup
- Silicon valley like open & collaborative culture
- High speed of innovation, 800 + patents
- Strong relationship with business partners
- Perceived as ‘’Value for Money’’ product
Weaknesses
- We don’t have our own OS
- High manufacturing cost
- Low brand awareness
- Lack of products in low price category
11. SWOT – external analysis
Opportunities
- Increasing demand for touch screen phones with
3G technology
- Fast growing Emerging Markets
- Development of device centric App’s to add value
to customers
- Mini Tablet could be next market sensation.
Threats
- Patent wars
- Low customer loyalty
- Rapid technological change
- Expected Tie Ups e.g. Google acquiring Motorola
16. Emerging market
Market
share
based
on
Nokia
selling
c.30%
price
Samsung
c. 30%
HTC & RIM
c. 30% Apple
c. 6%
$200
Average selling price
Increase in market share – Reduction in average selling price through product mix
18. - Smartphones & tablets
- First time buyers, youth
- Focus on Asia & EM
- High end hardware as value
proposition
- Platforms
Phase 1 (2013-14)
- Joint venture
Focus on smartphone
US: high price models Lowest cost through - Licensing
AP & EM: medium / low price economies of scale - Marketing blitzkrieg
models Differentiation - Distribution channel
through innovation
Phase 2 (2014-16)
Focus on smartphone & mini
tablet
- Best in class hardware
- Speed of innovation
- Software upgrade
- Value for money
- HTC Apps
19. Corporate strategy
(Stages of Industry Value Chain)
Vertical Integration
TO BE
AS IS
Horizontal Integration
(products and services)
20. Strategy road map Financials
Marketing
Plan
External
analysis
Strategic Competitive
Mission Objectives Implement
choice advantage
Internal Organization
Plan
analysis Operating
Plan
22. Market status and estimates
Effective
Market Estimates CAGR
Regions Market share HTC Share Current
Penetration (Source IDC)
share
US 81% 18% 6.0% 1.07 11.6
Europe 77% 20% 10.0% 2.00 11.5
China 16% 27% 8.0% 2.12 26.2
India 6% 3.0% 10.0% 0.30 57.5
Rest of World 33% 10.0% 3.30
23. Projected scenario – Optimistic assumptions
HTC Share Effective
Market Estimates CAGR
Regions Market share (effective Current
Penetration (Source IDC)
2014) share
US 81% 18% 8.0% 1.07 11.6
Europe 77% 20% 12.0% 2.00 11.5
China 16% 27% 10.0% 2.12 26.2
India 6% 3.0% 12.0% 0.30 57.5
Rest of World 33% 10.0% 3.30
24. Projected scenario – Conservative assumptions
HTC Share Effective
Market Estimates CAGR
Regions Market share (effective Current
Penetration (Source IDC)
2014) share
US 81% 18% 3.5% 1.07 11.6
Europe 77% 20% 8.0% 2.00 11.5
China 16% 27% 6.0% 2.12 26.2
India 6% 3.0% 8.0% 0.30 57.5
Rest of World 33% 10.0% 3.30
25. Revenue scenario – Conservative estimates
ASP 2012 2013 2014 2015 2016
US 313 705 2,919 2,254 2,983 3,949
Europe 313 1,320 5,462 5,778 7,641 10,105
China 313 1,399 6,553 7,356 11,010 16,479
India 313 198 1,157 1,729 3,230 6,034
Rest of World 313 2,177 8,891 11,599 15,132 19,741
Projected revenue
9,922 24,982 28,717 39,997 56,308
(Million $)
YOY Growth 151.79 14.95 39.28 40.78
26. Revenue scenario – Optimistic estimates
Regions ASP 2012 2013 2014 2015 2016
US 313 705 2,919 4,508 6,961 9,213
Europe 313 1,320 5,462 7,945 11,557 15,283
China 313 1,399 6,553 11,034 18,579 27,808
India 313 198 1,157 2,378 4,886 9,127
Rest of World 313 2,177 8,891 11,599 15,132 19,741
Projected revenue
(Million $) 9,922 24,982 37,464 57,116 81,173
YOY Growth 705 2,919 4,508 6,961 9,213
27. Revenue scenario – Moderate estimates
Regions ASP 2012 2013 2014 2015 2016
US 313 705 2,919 3,864 5,114 6,769
Europe 313 1,320 5,462 7,223 9,551 12,631
China 313 1,399 6,553 9,808 14,680 21,972
India 313 198 1,157 2,162 4,038 7,543
Rest of World 313 2,177 8,891 11,599 15,132 19,741
Projected revenue
9,922 24,982 34,656 48,516 68,656
(Million $)
YOY Growth 151.79 38.72 39.99 41.51
31. Key Points for implementation
Market Thrust
• Provision for sales and administrative cost of 9.5% of
revenue to increase market presence
R & D Focus
• Provision for increased R & D expense from average
3.5 % to 6.0% of revenue to give consistant advantage
over competition.
Market reach
• Increased asset allocation to enable strengthening of
the distribution network in emerging markets.
32. Contingency plan / Risk mitigation
Reduction of operating expenses
• Reduction of COG by 11,000 Million $ (10% of
operating expenses) by product rationalisation will be
used for maintaining margins.
Relocation of manufacturing plant
• Possible reduction of 500 Million $ in manufacturing
cost by expanding in developing countries will improve
the supply chain as well as reduce manpower cost.
34. Organisation plan
Existing Culture For Global Expansion
Aggressive
Marketing
Integrity
Innovation
Culture
Execution Team
Oriented Out come
Oriented
35. Organisation plan
‒ Sustain silicon valley culture to promote innovation
‒ Transformation from Taiwanese to International
‒ Formation of global marketing resource team
‒ LEAN and matrix organization
‒ Compensation ‘’best in class’’
36. Marketing proposal
Primary target market
First time smartphone users
Android
Windows
Techno savvy users
Competitive Advantage
Be the first mover of cutting edge innovations
Maintain customer oriented product positioning
Backed by multiple operating platforms.
37. Marketing proposal
Positioning
Position products to high innovation and high functionality
Multimedia phones catered to higher resolution and
Business phones catered to email
functionalities, productivity tools, and networking
connections.
Marketing Methods
Social Media
Guerilla
Mobile
Promotion Campaigns
38. Marketing ideas
EVO 3D
phones
Twitter
trending Innovation
hashtags awards
QR code College
promotions promotions
39. Branding strategy
Driving product awareness
– Aggressive communication about features and
advantages of HTC phones
– Build excitement around products
• Brand ambassadors for target areas i.e. China and India
Focus on a single brand for each operating platform
– One series for high end smartphones
– Desire series for medium to low end smartphones
– E.g. Samsung’s Galaxy and Apple’s iphone
Collaboration with service providers
42. Sustainable source of competitive advantage
‒ Strong research and development capabilities
‒ Superior product and customer support
‒ Economic factors – Manufacturing & Operating in Taiwan
‒ Strong marketing strategy
“An organization’s ability to learn and translate that learning into action rapidly is
the ultimate competitive advantage.” – Jack Welch