Downloaded 163 times

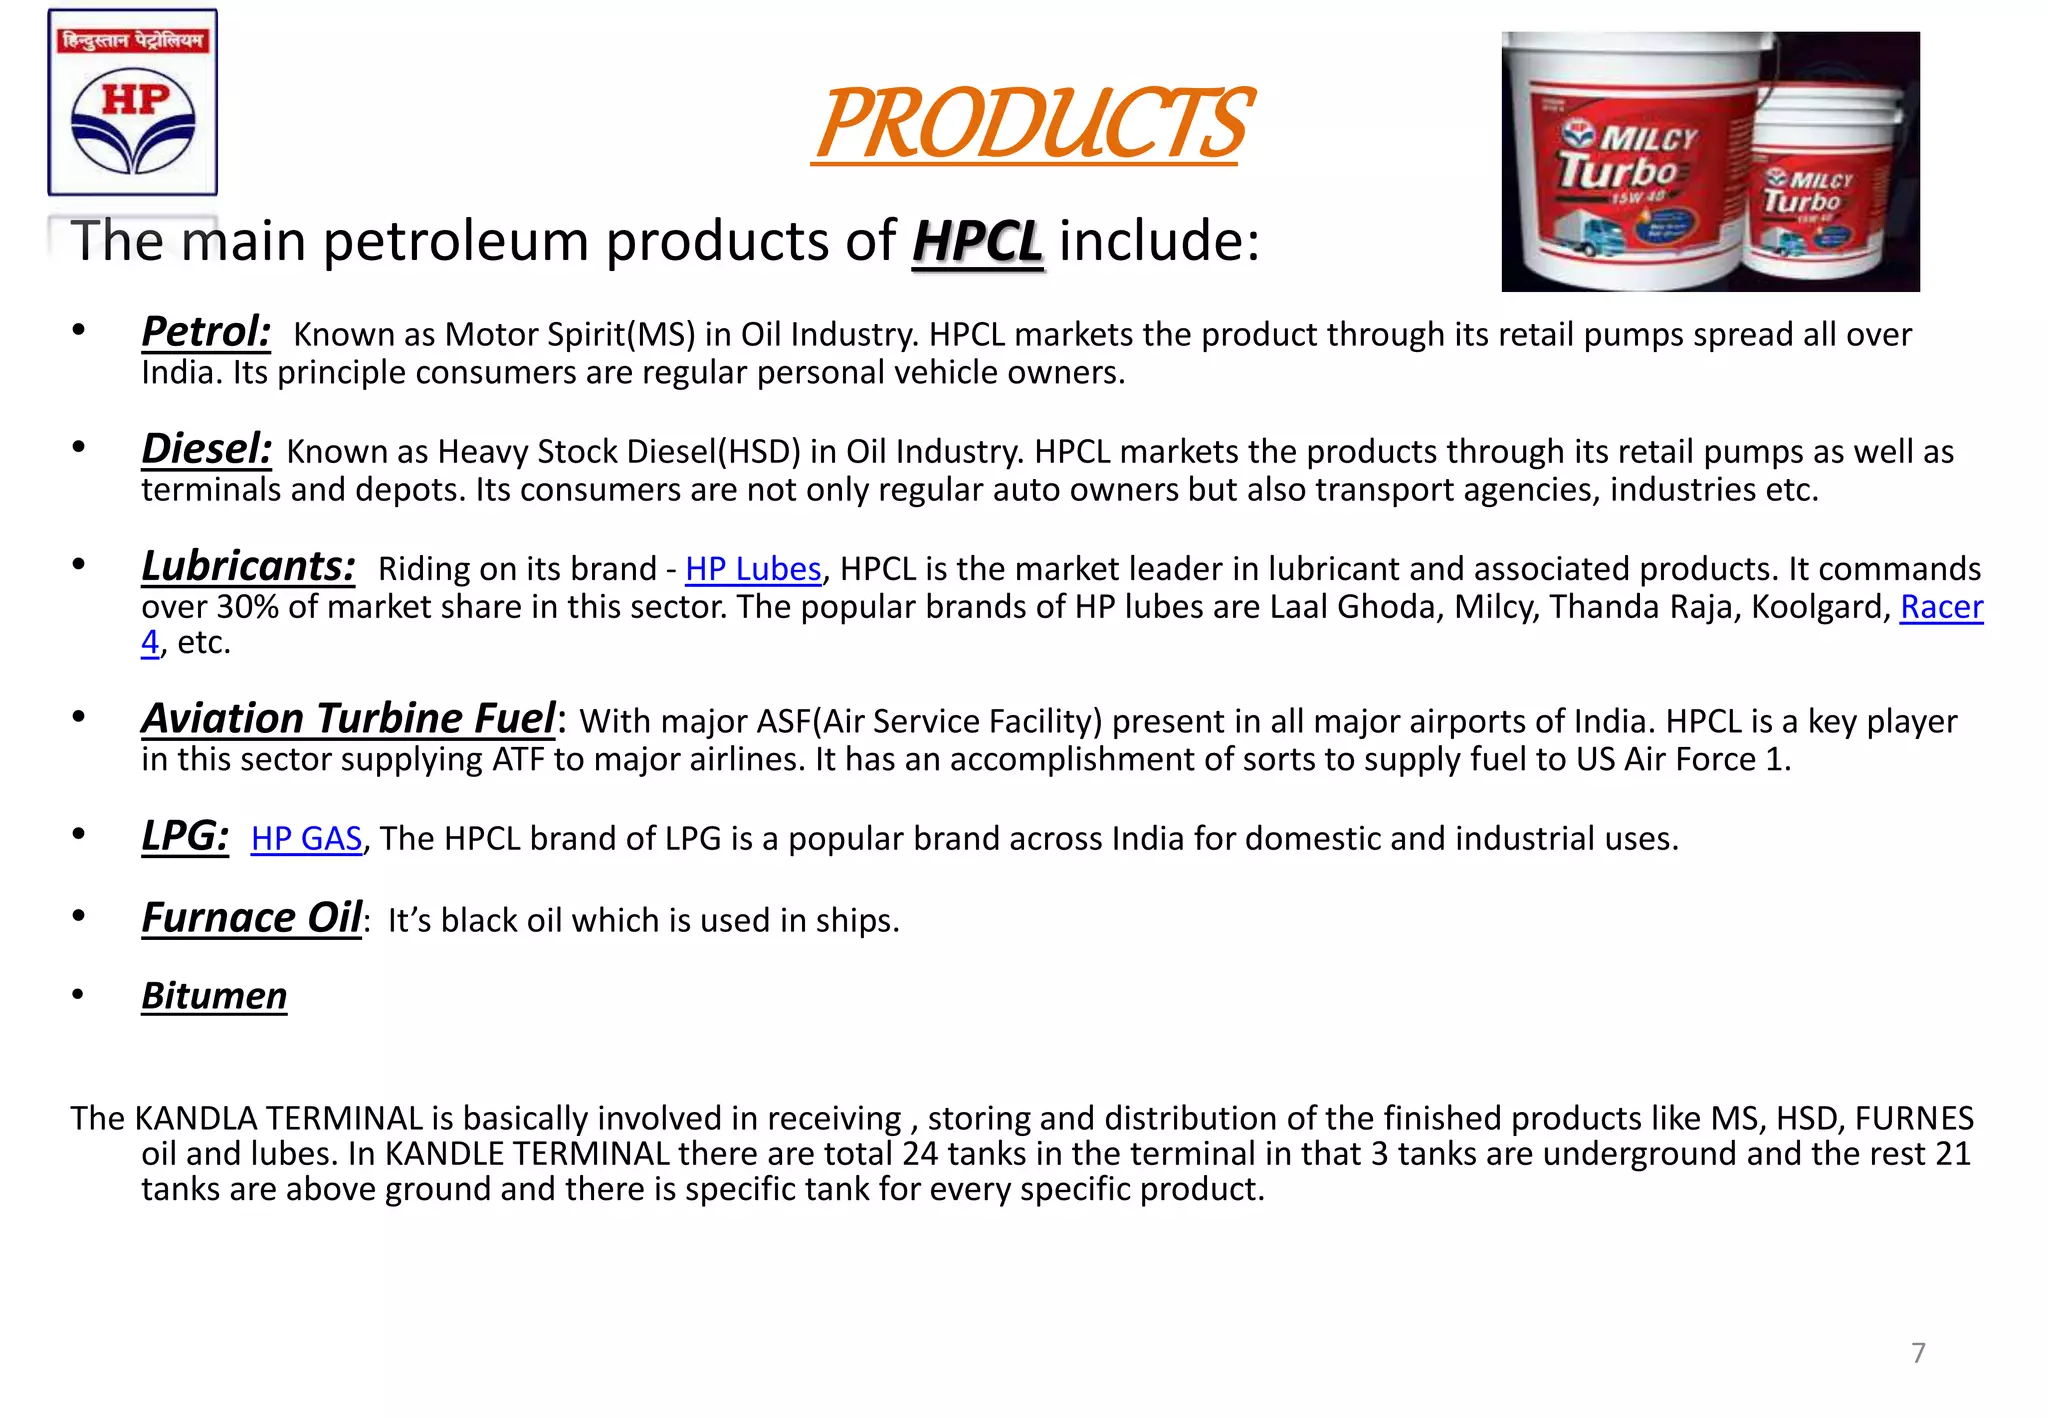
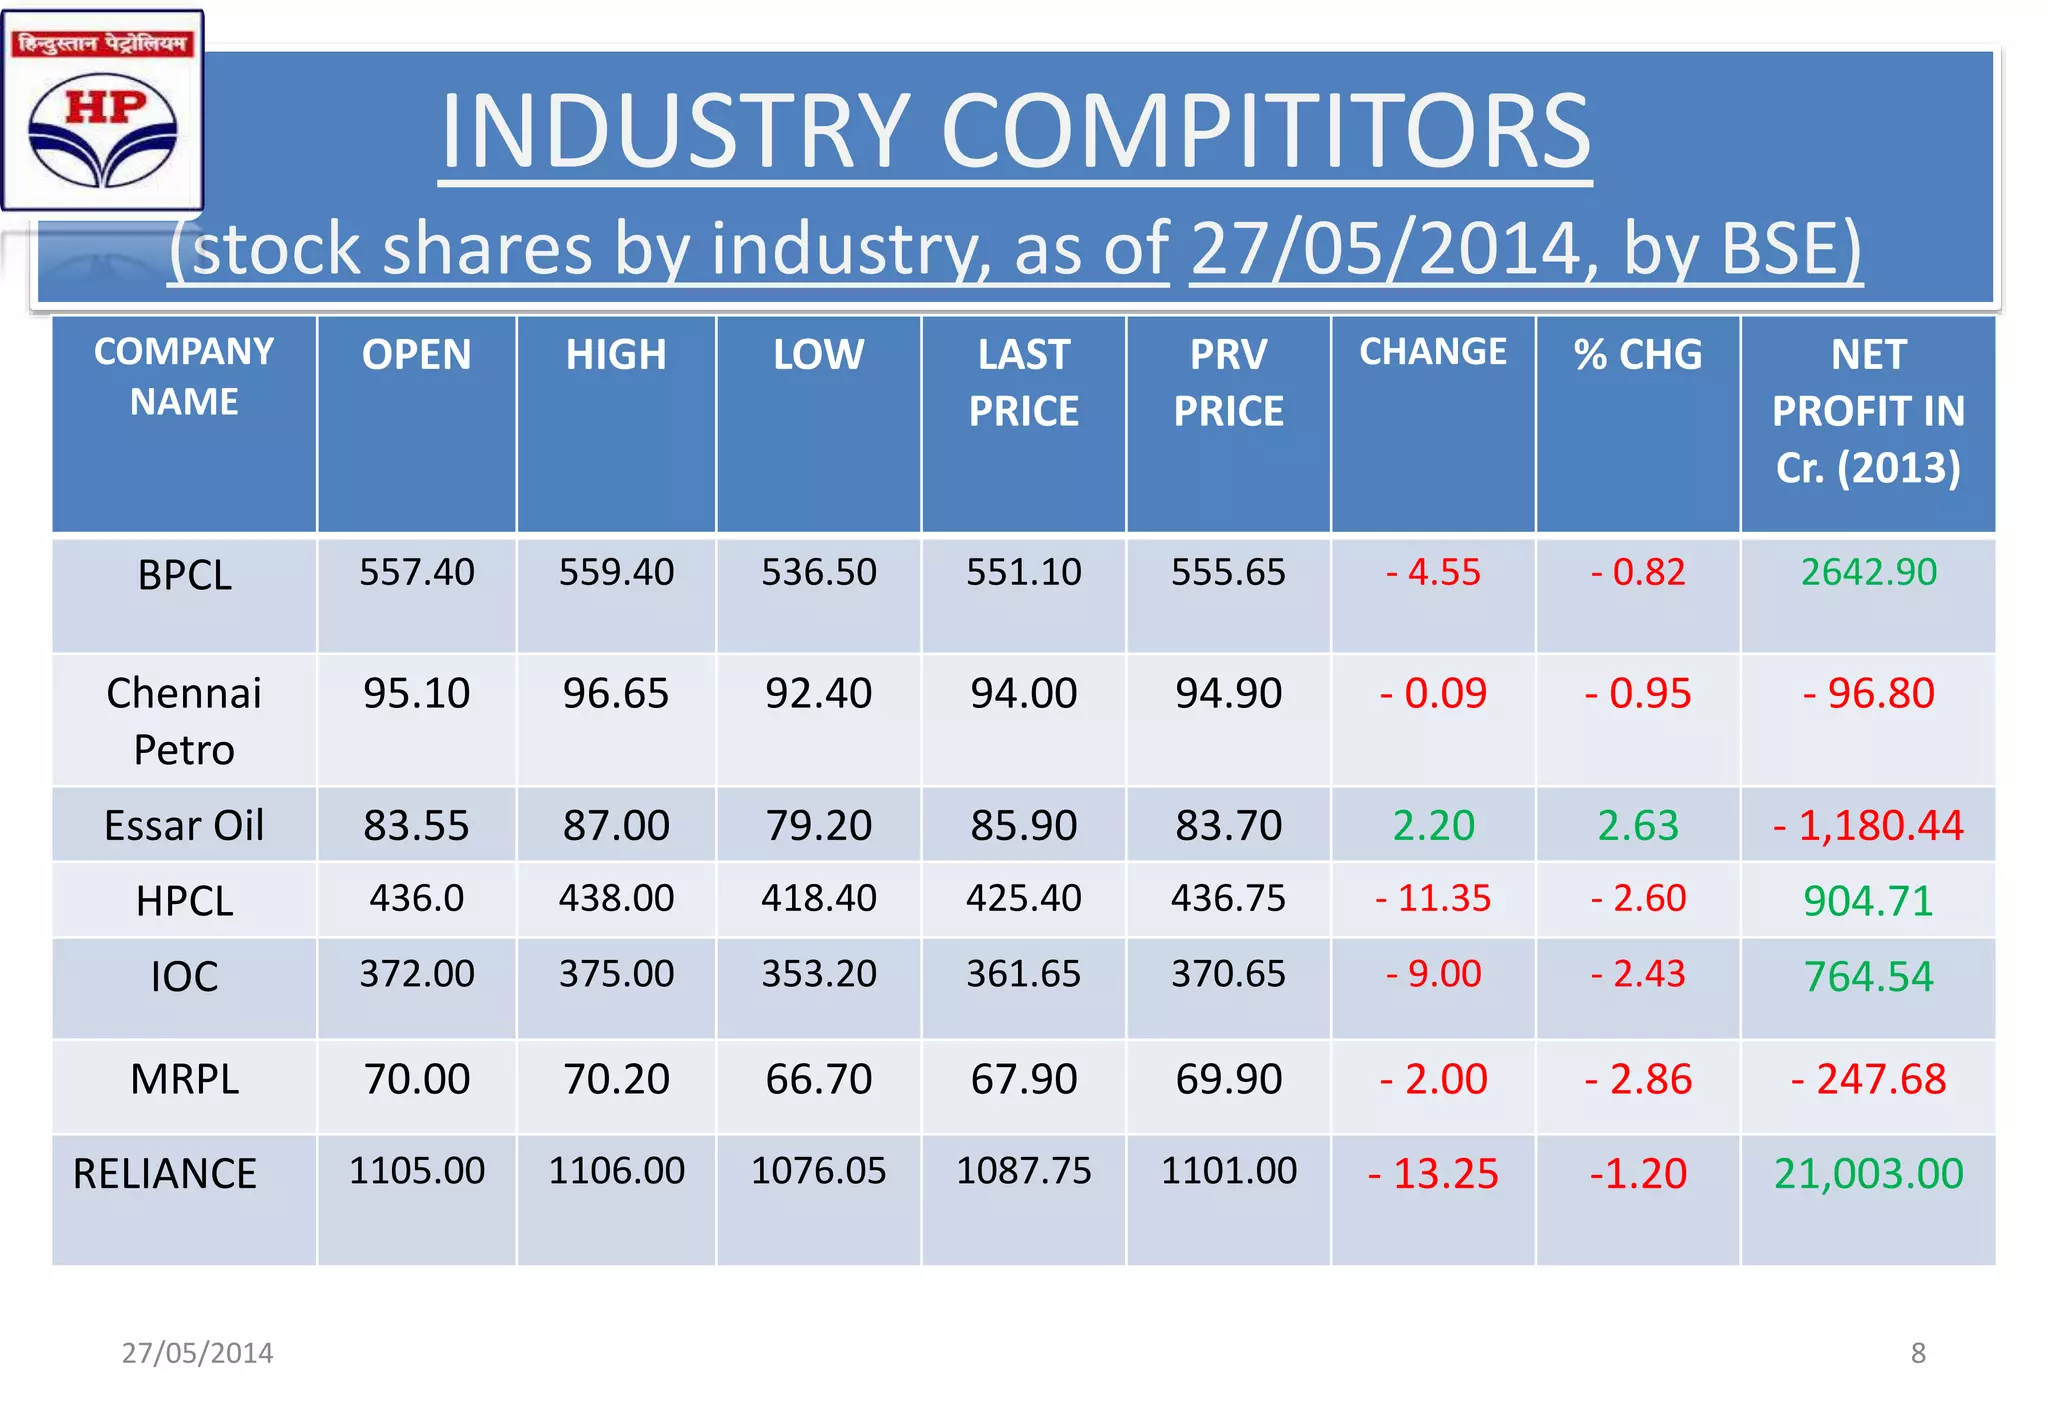
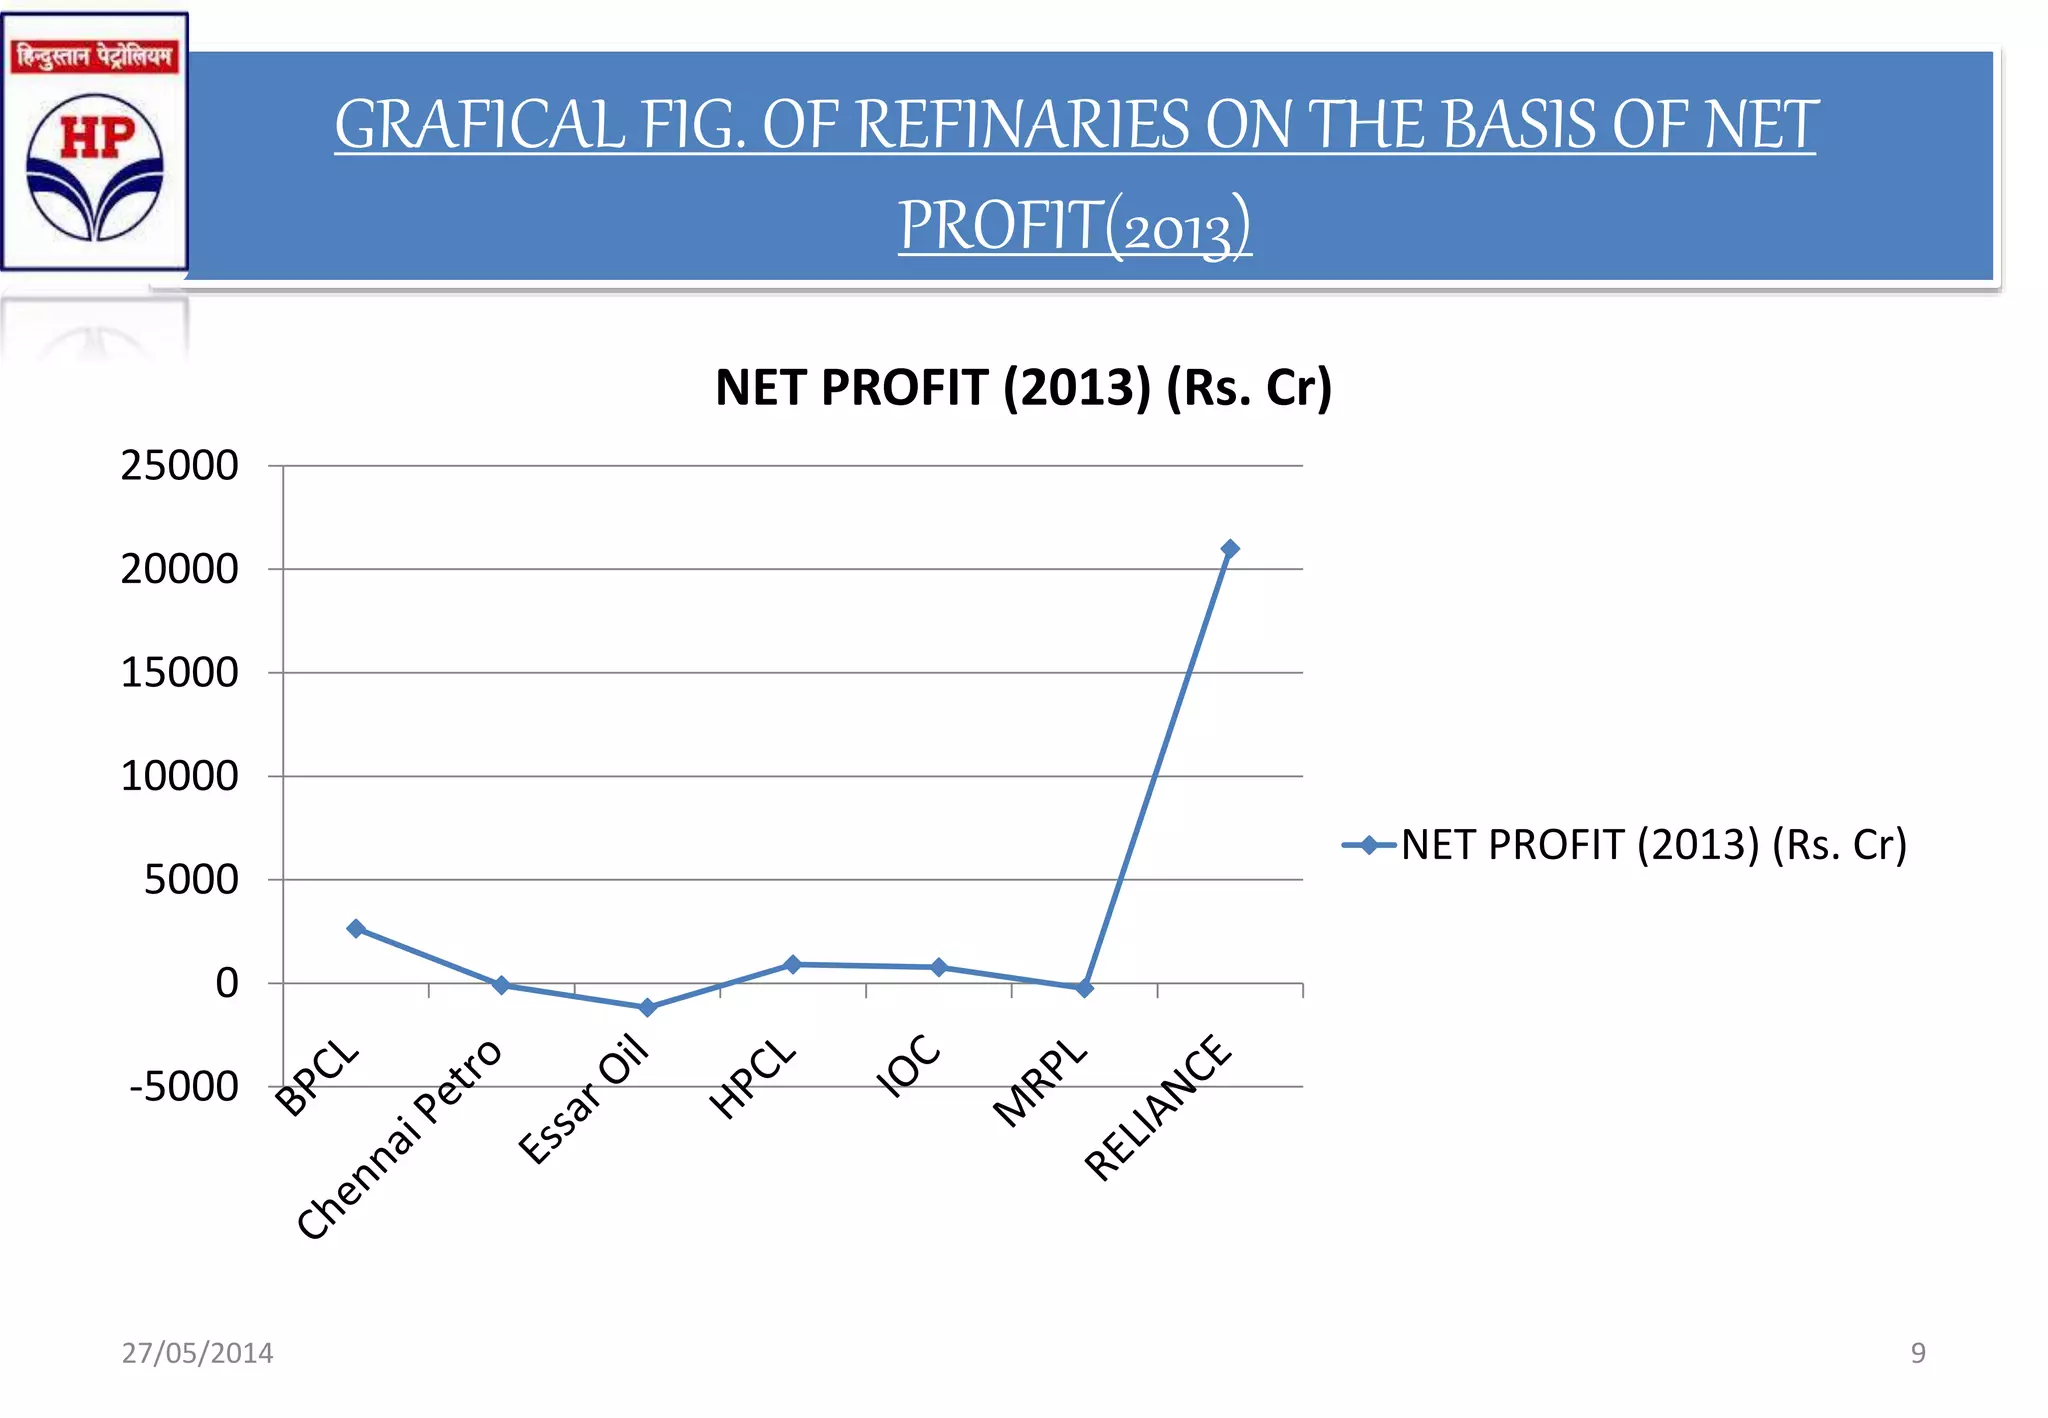
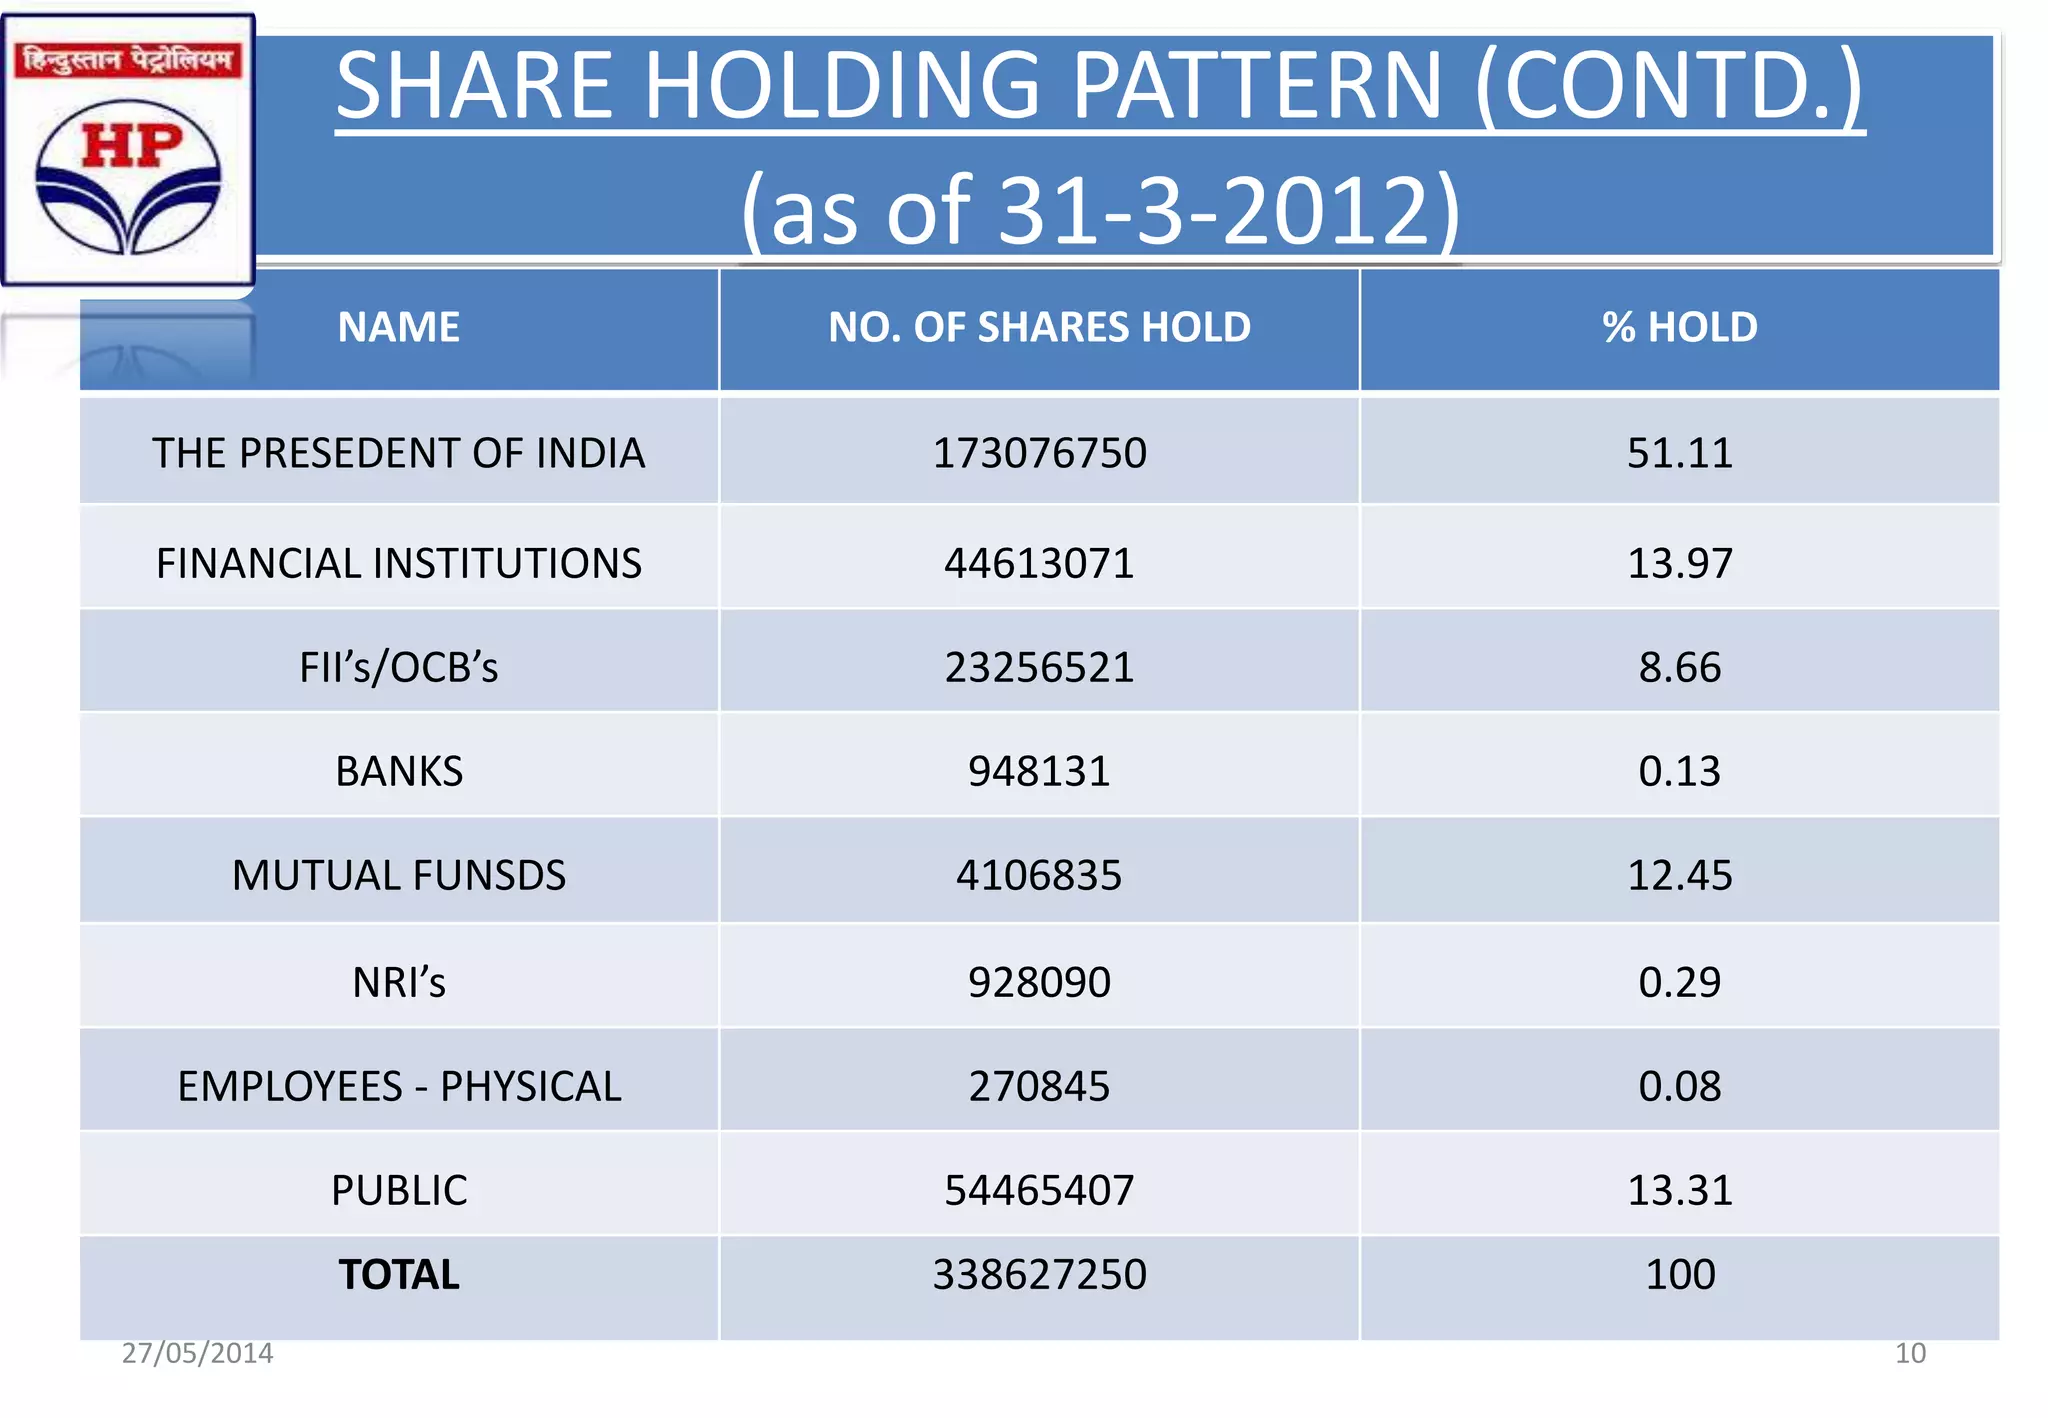
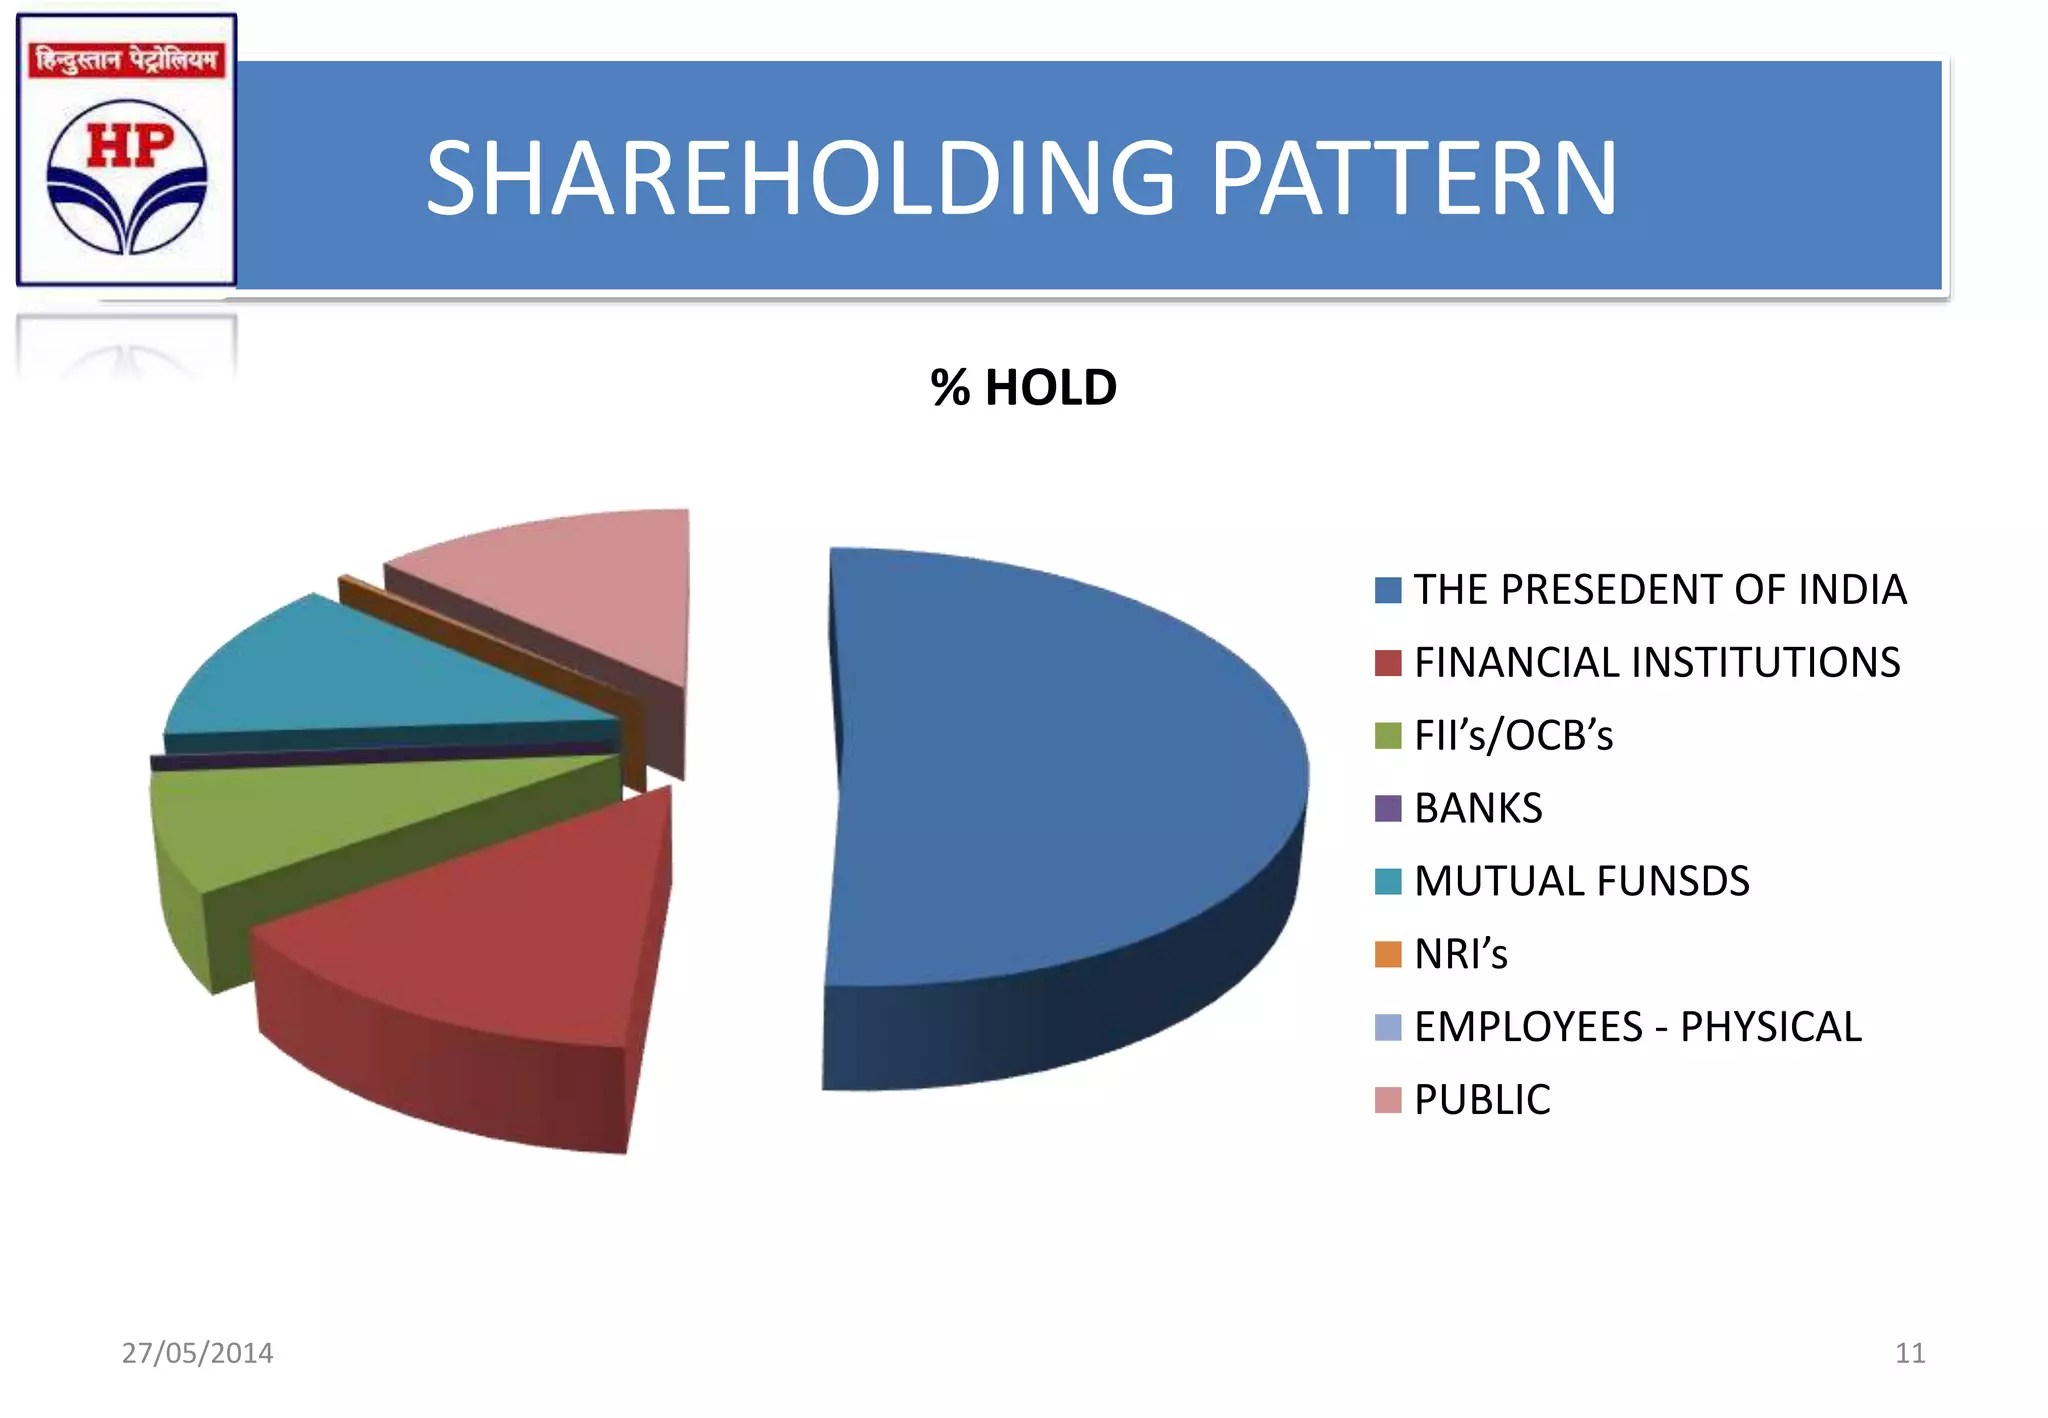
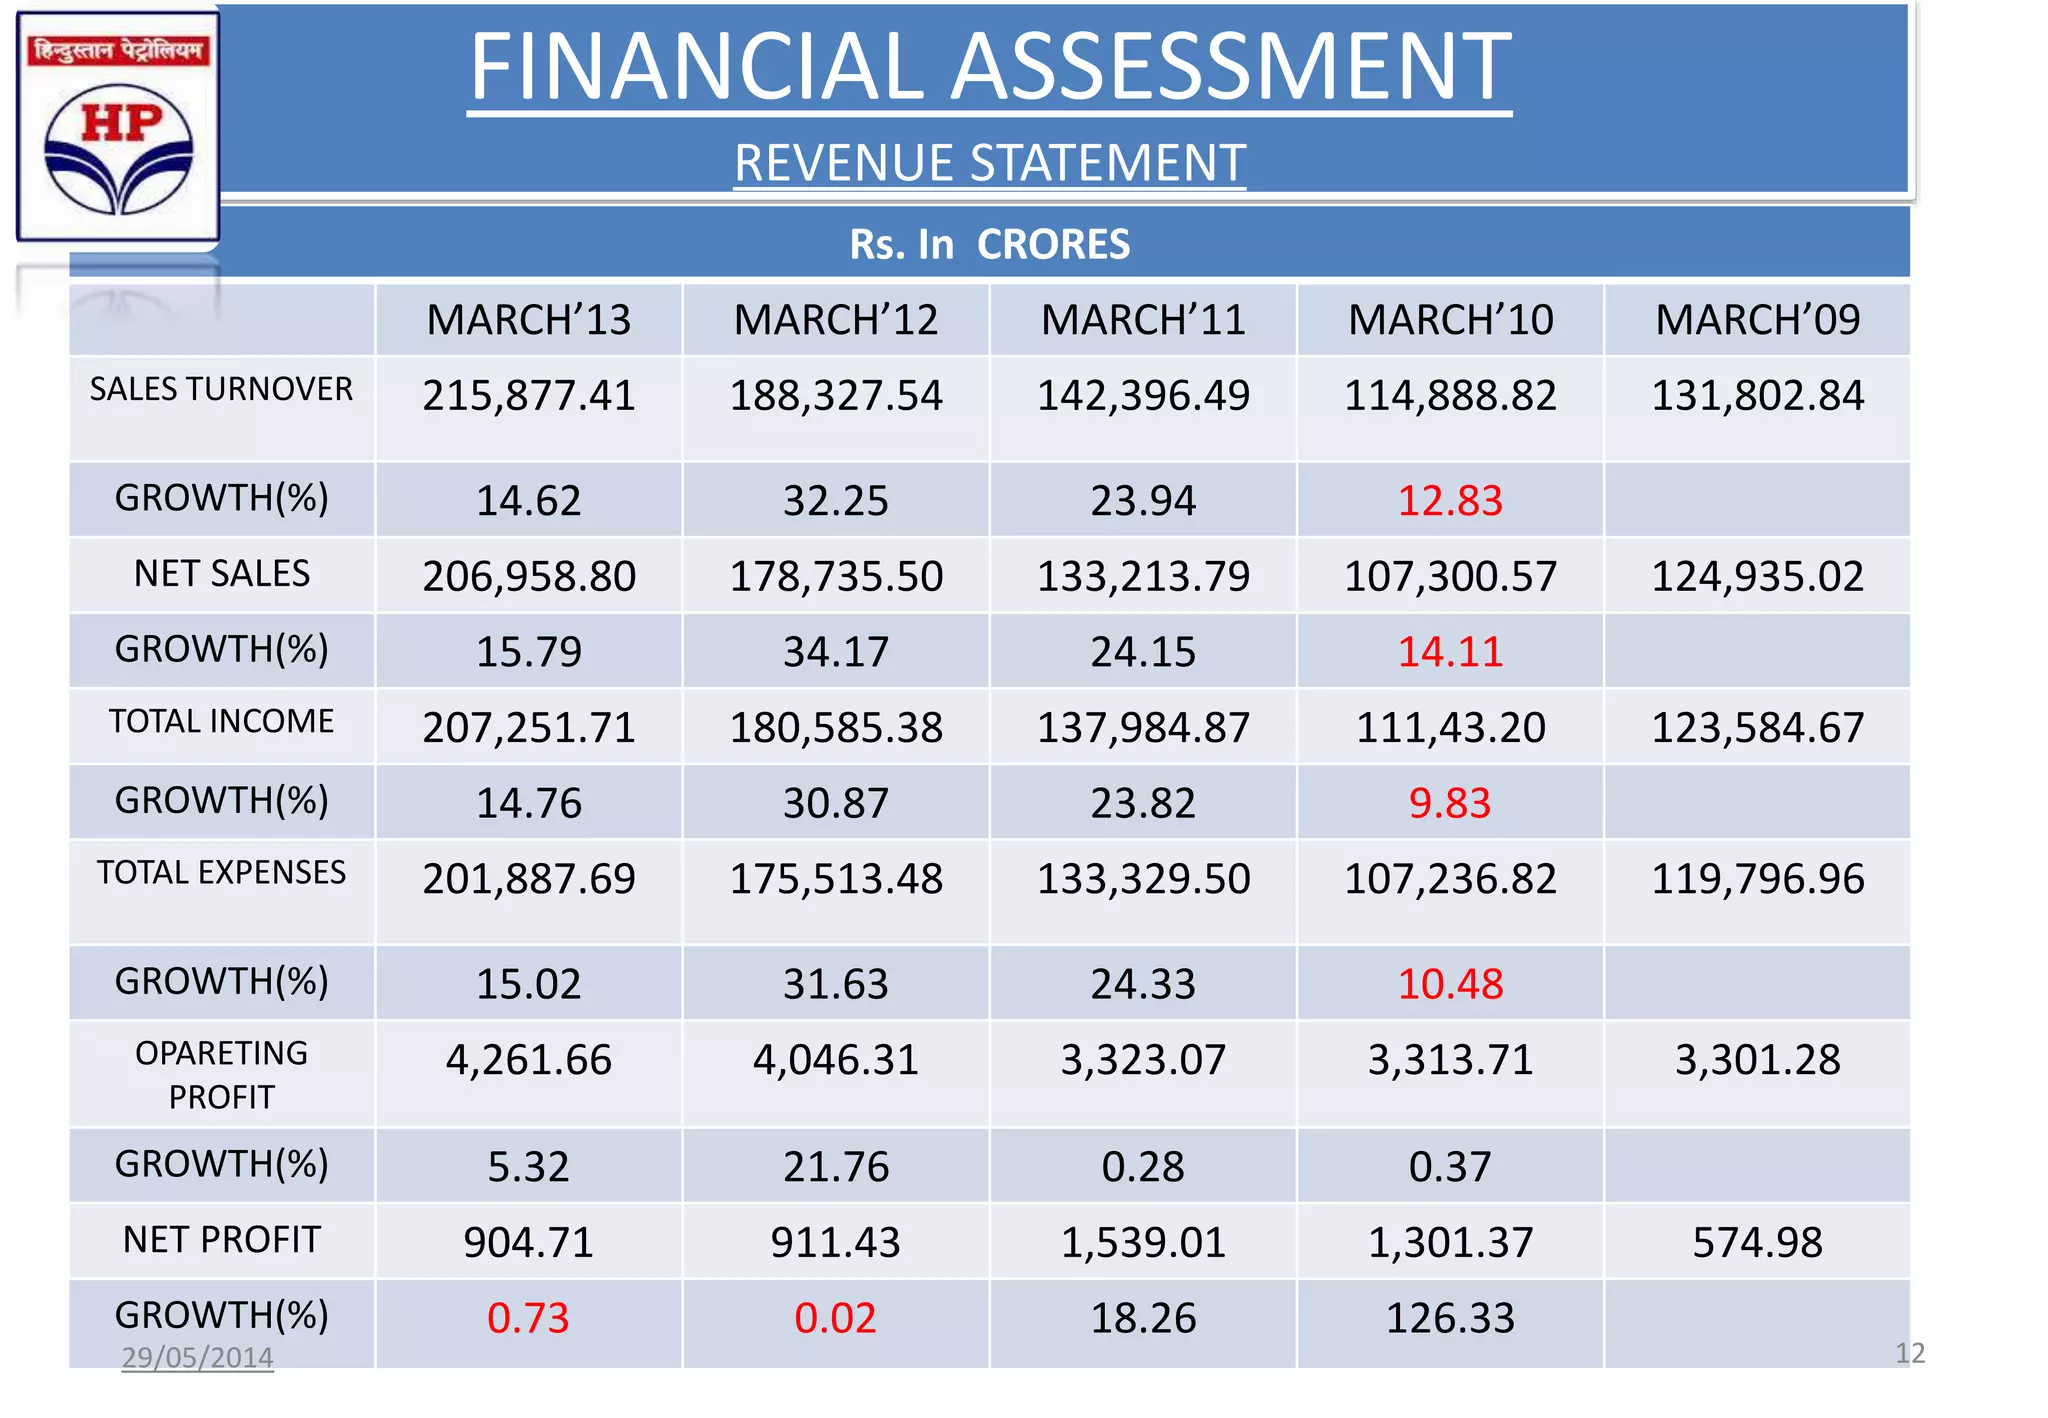
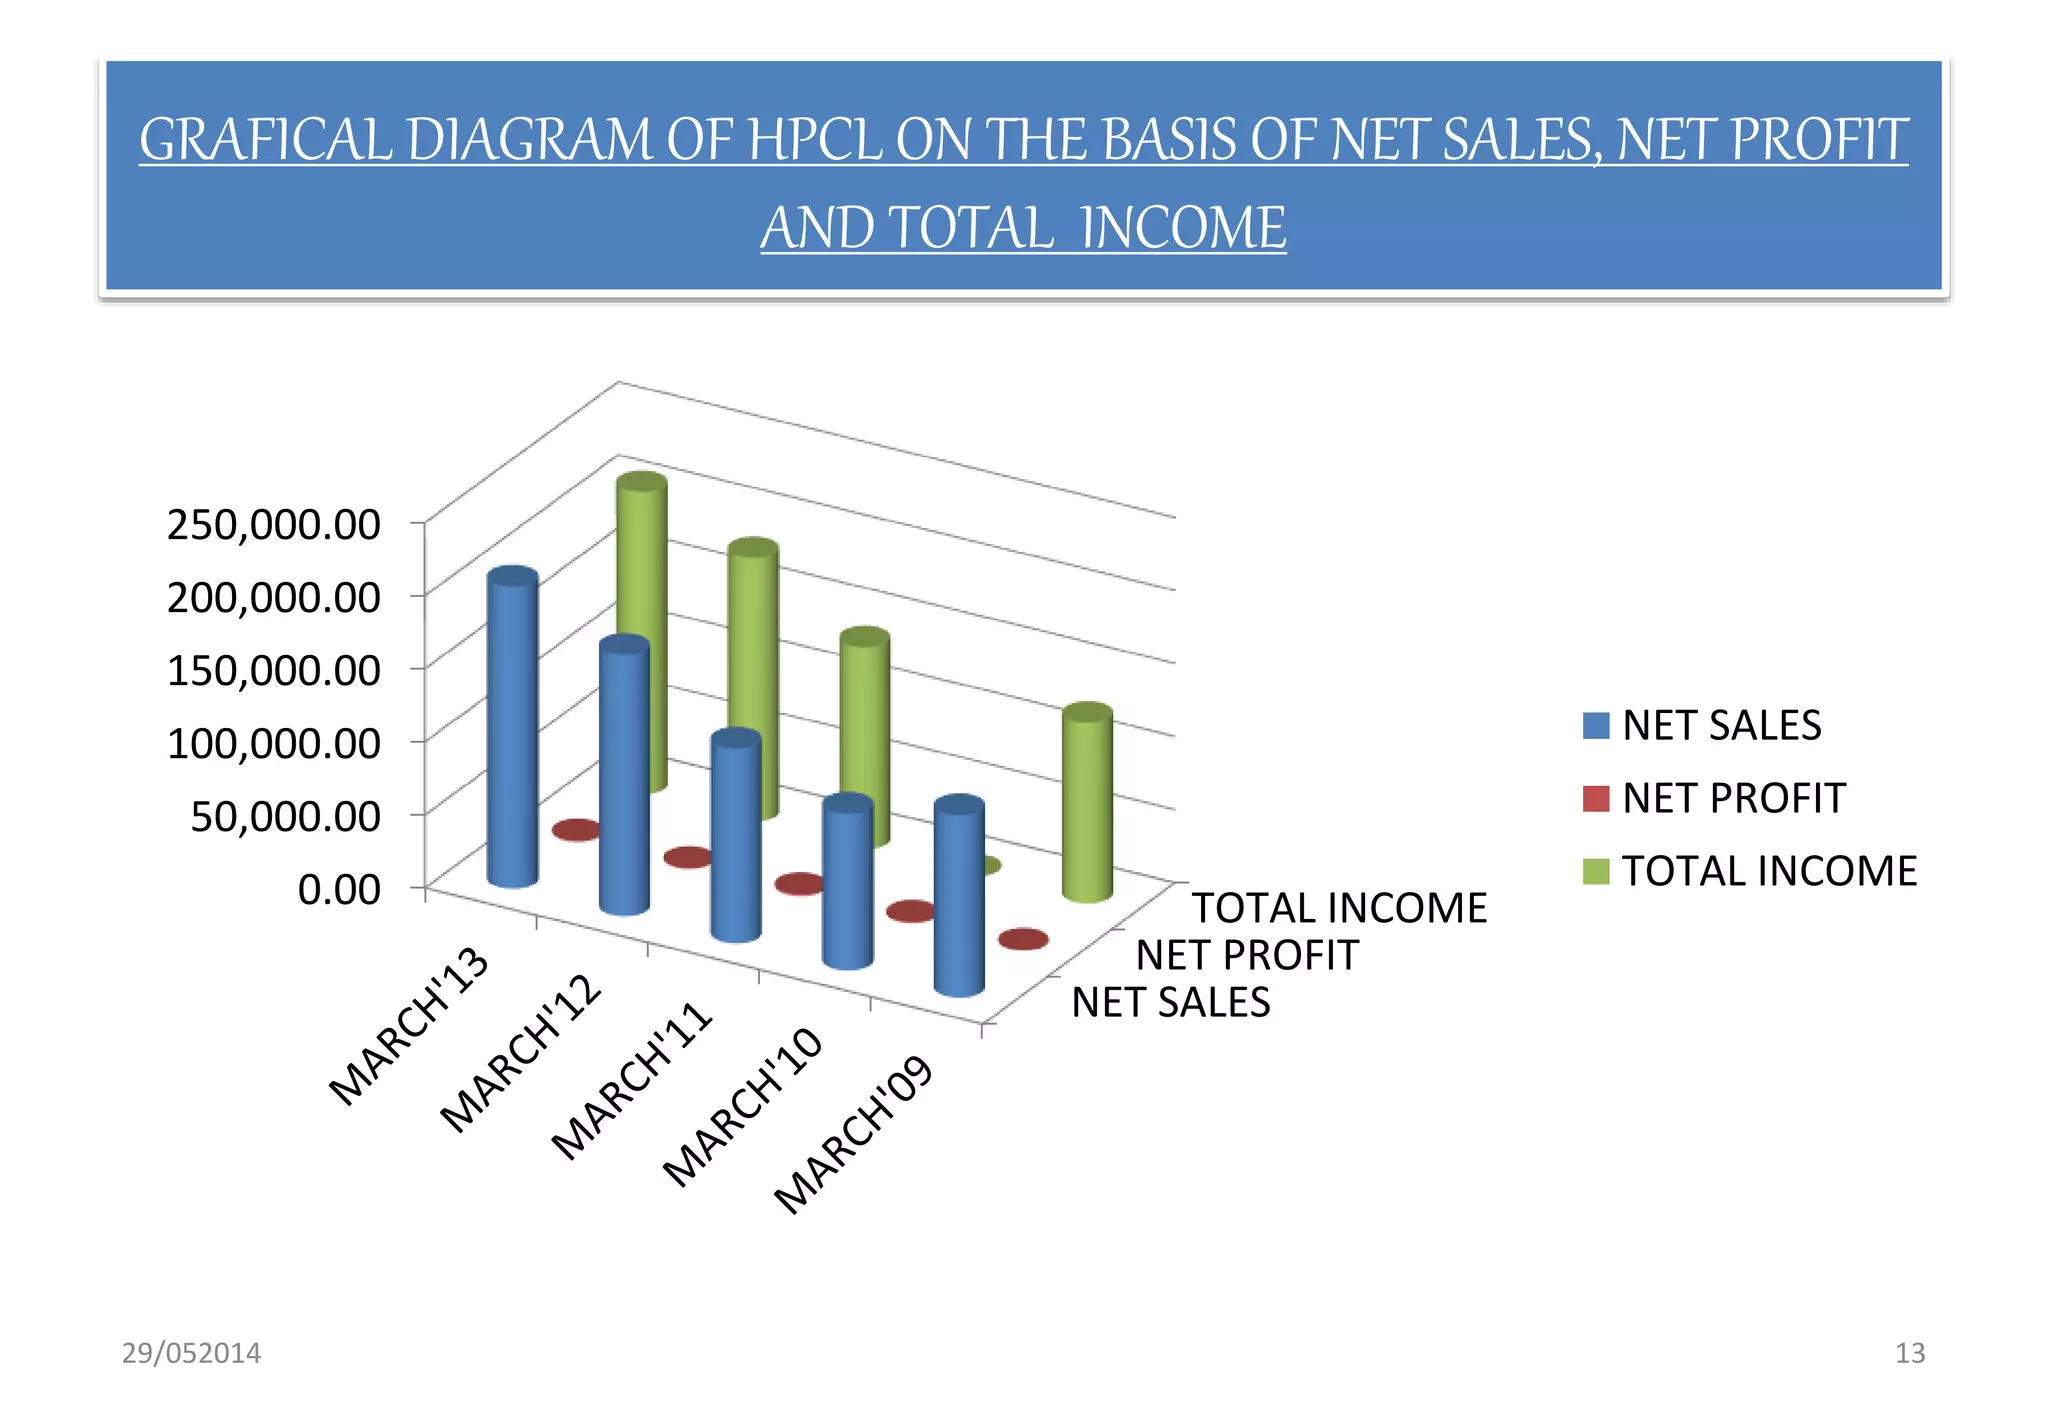
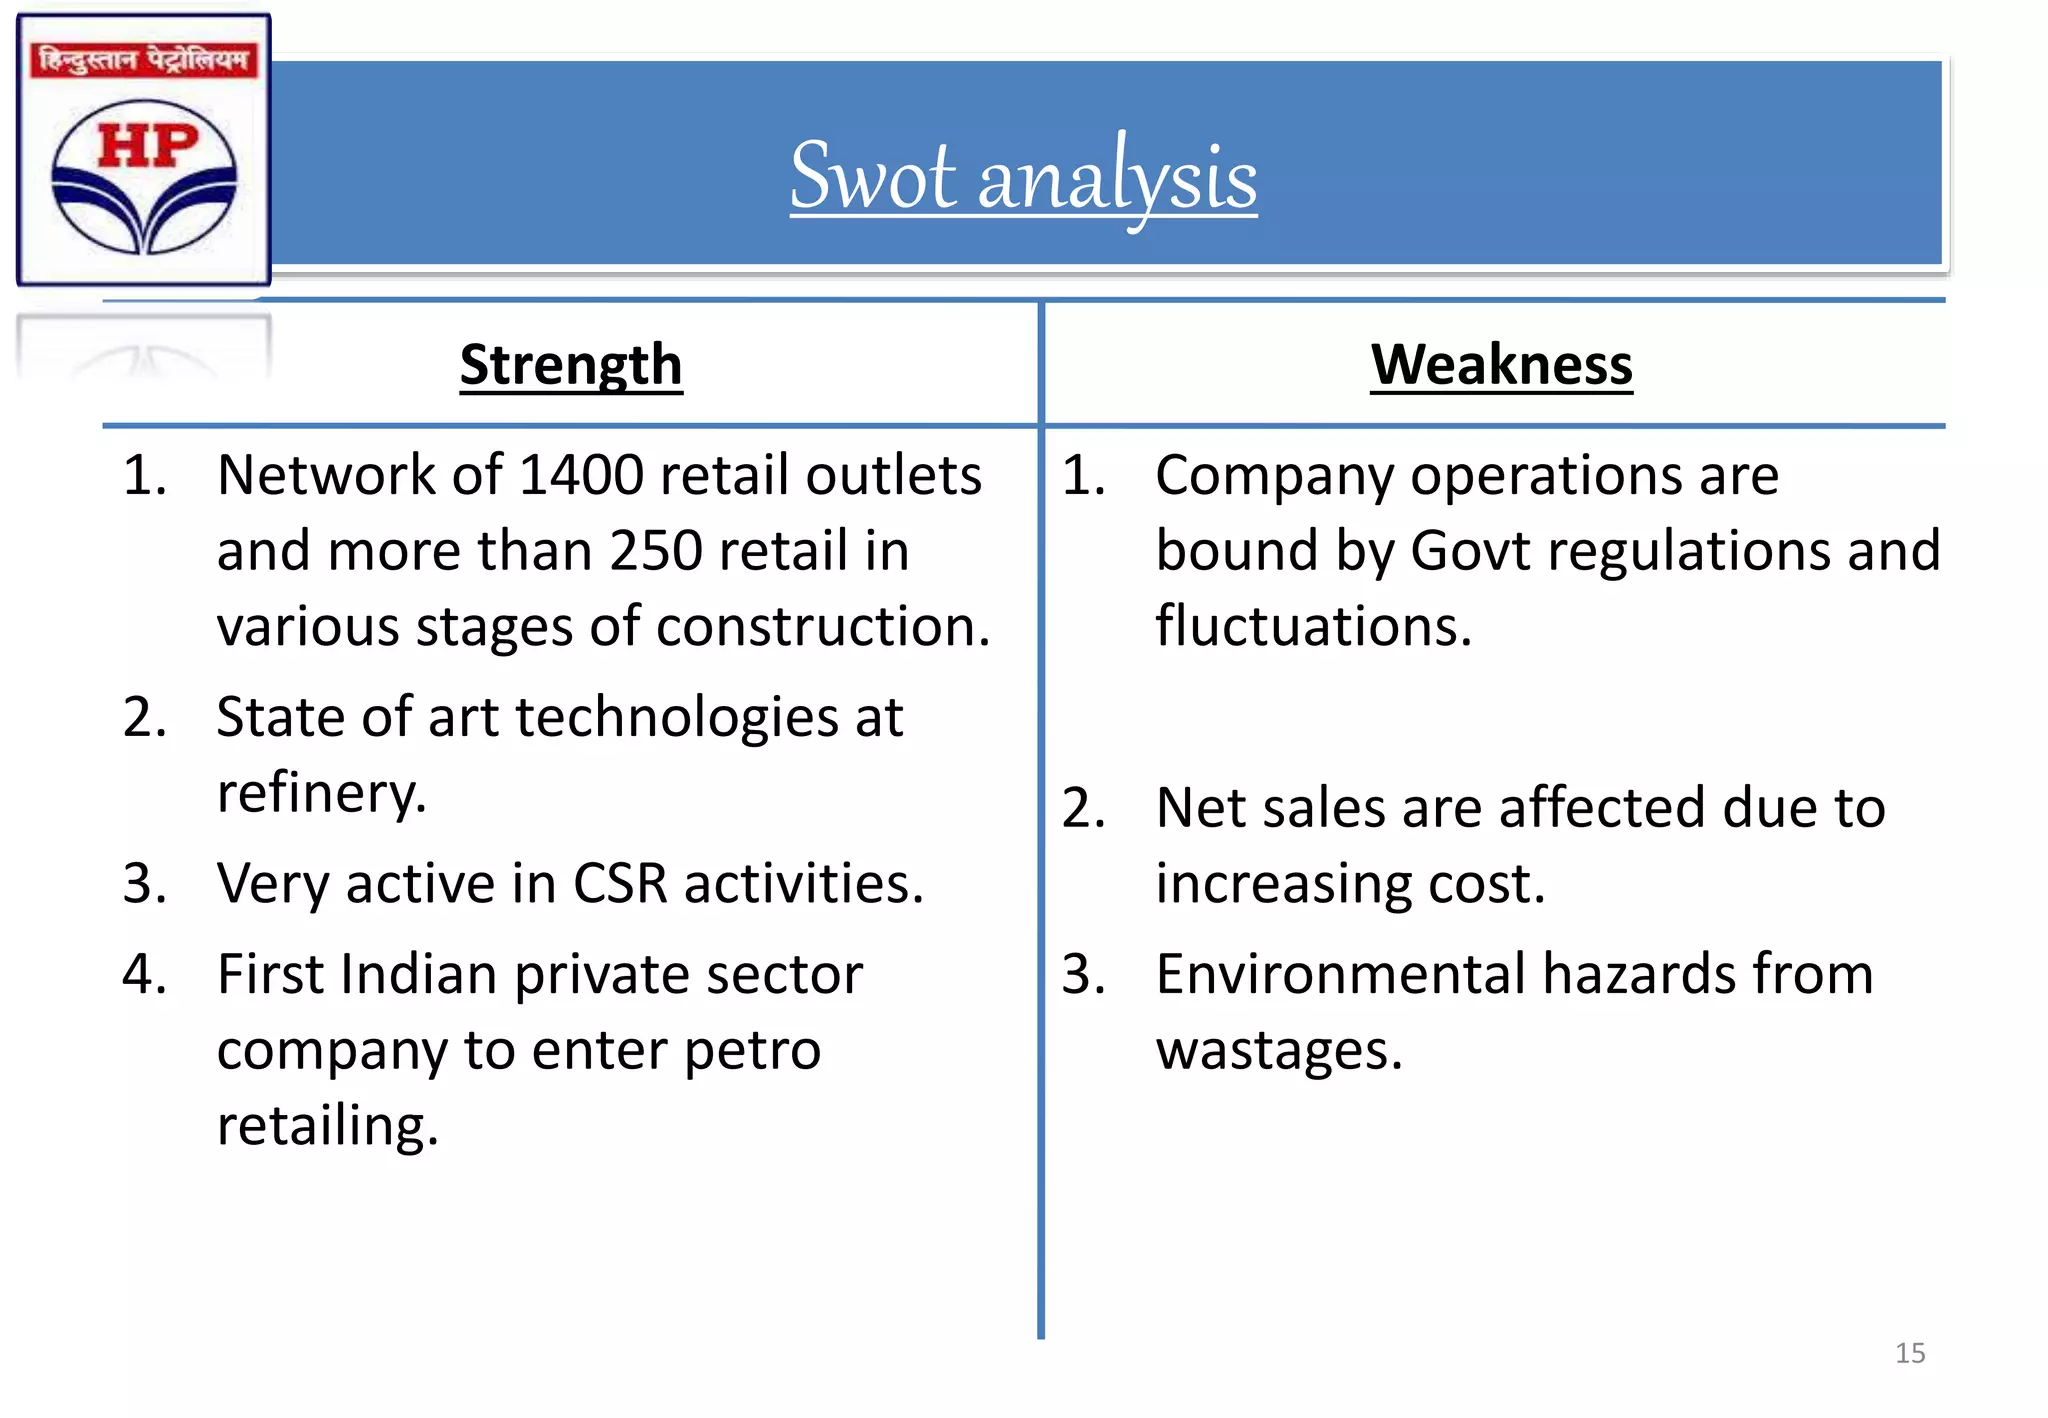
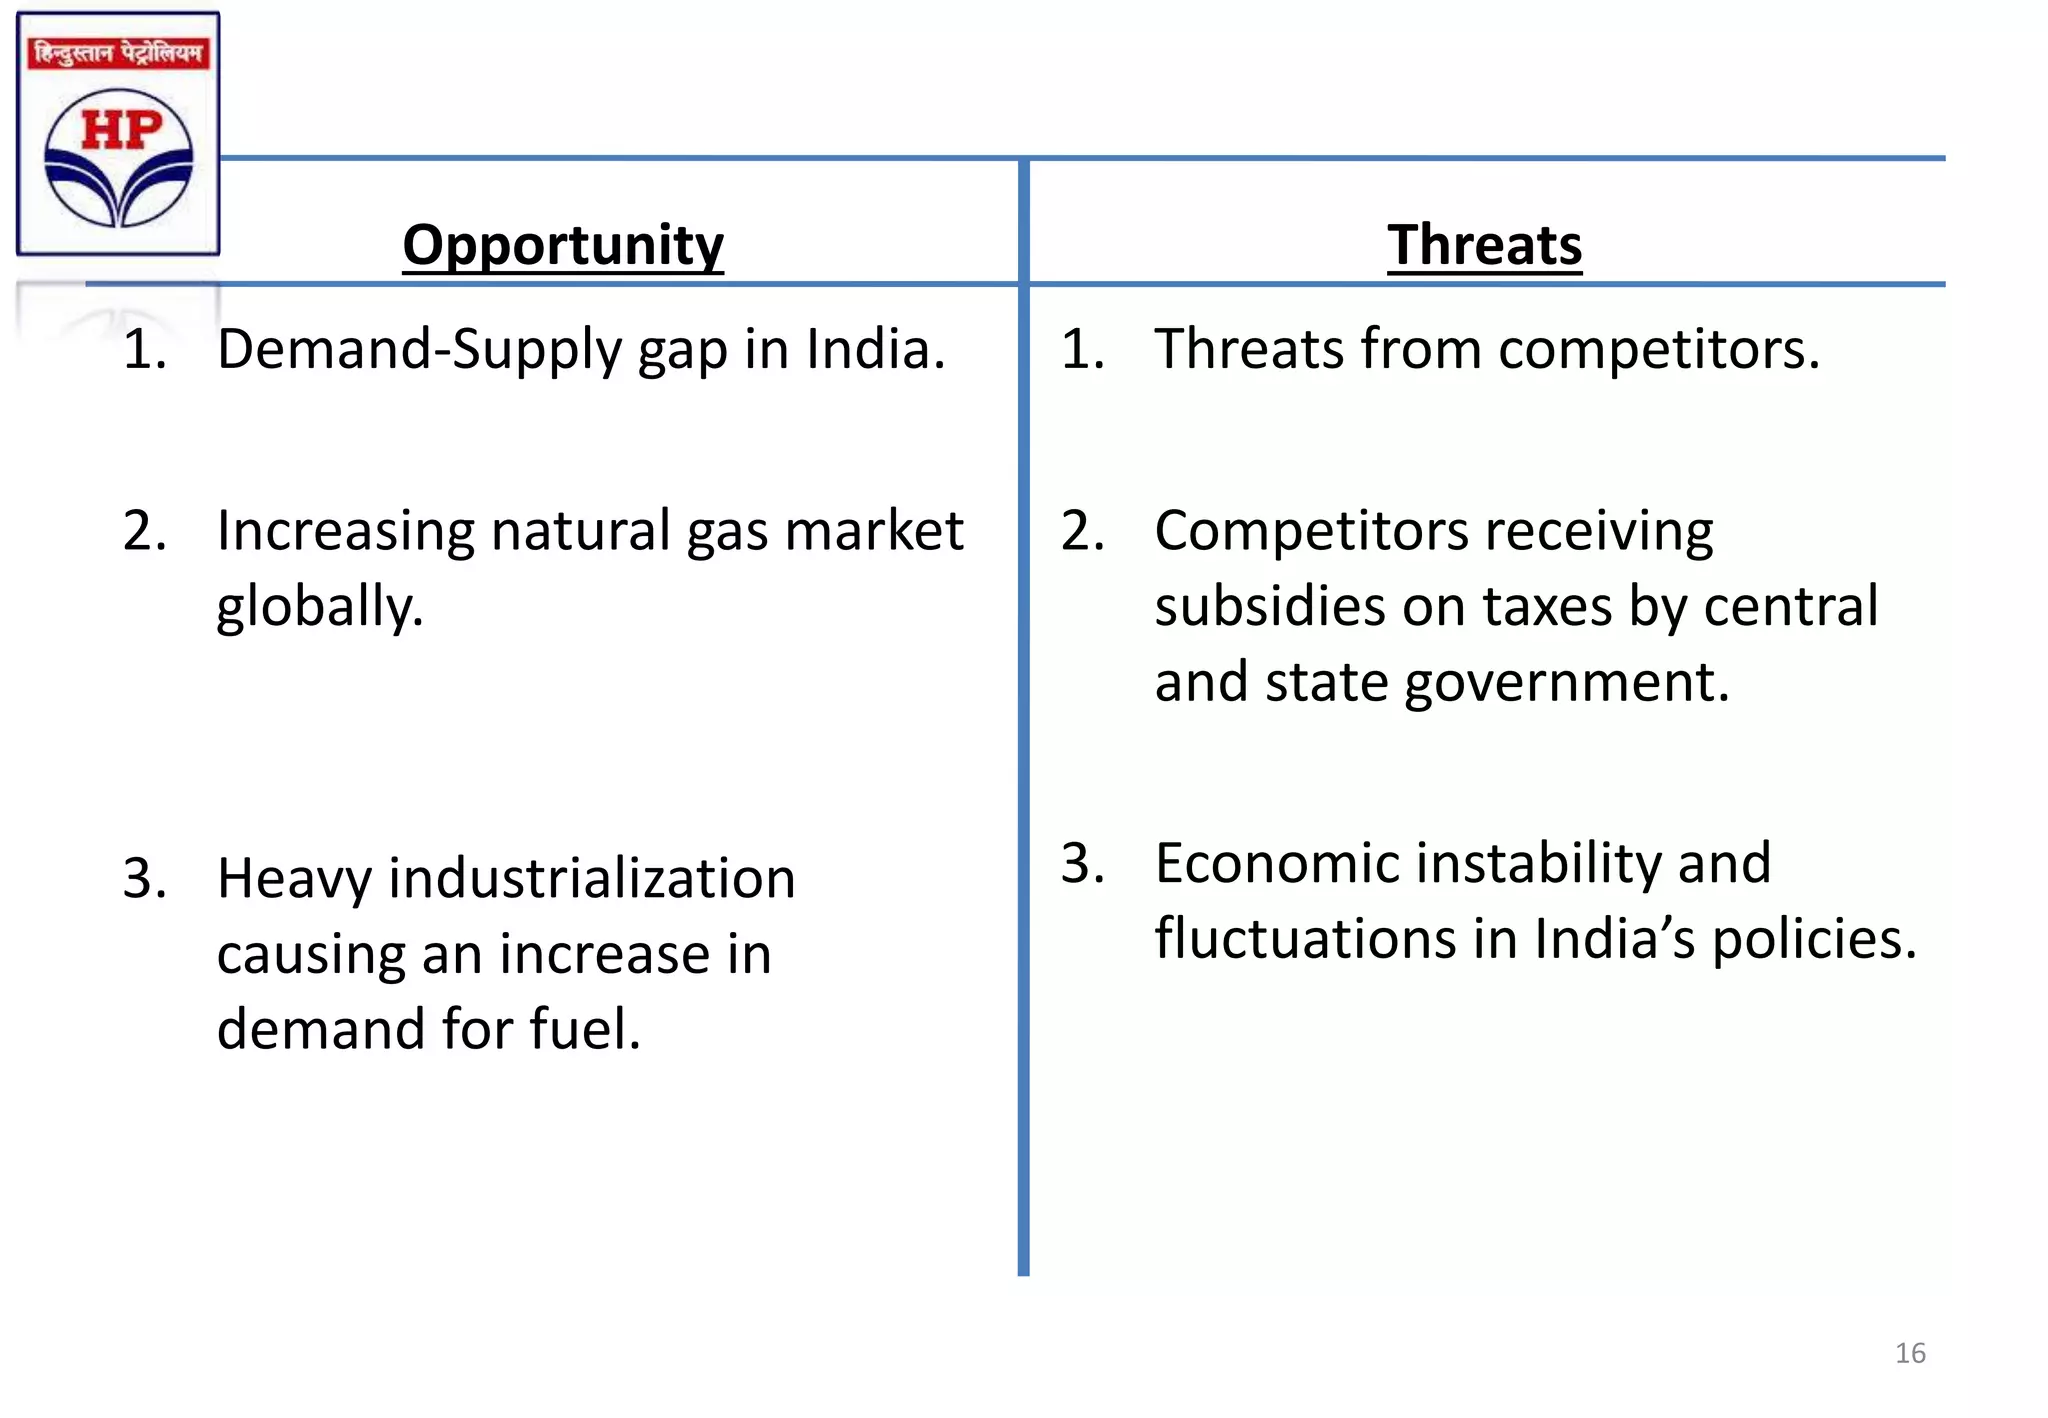
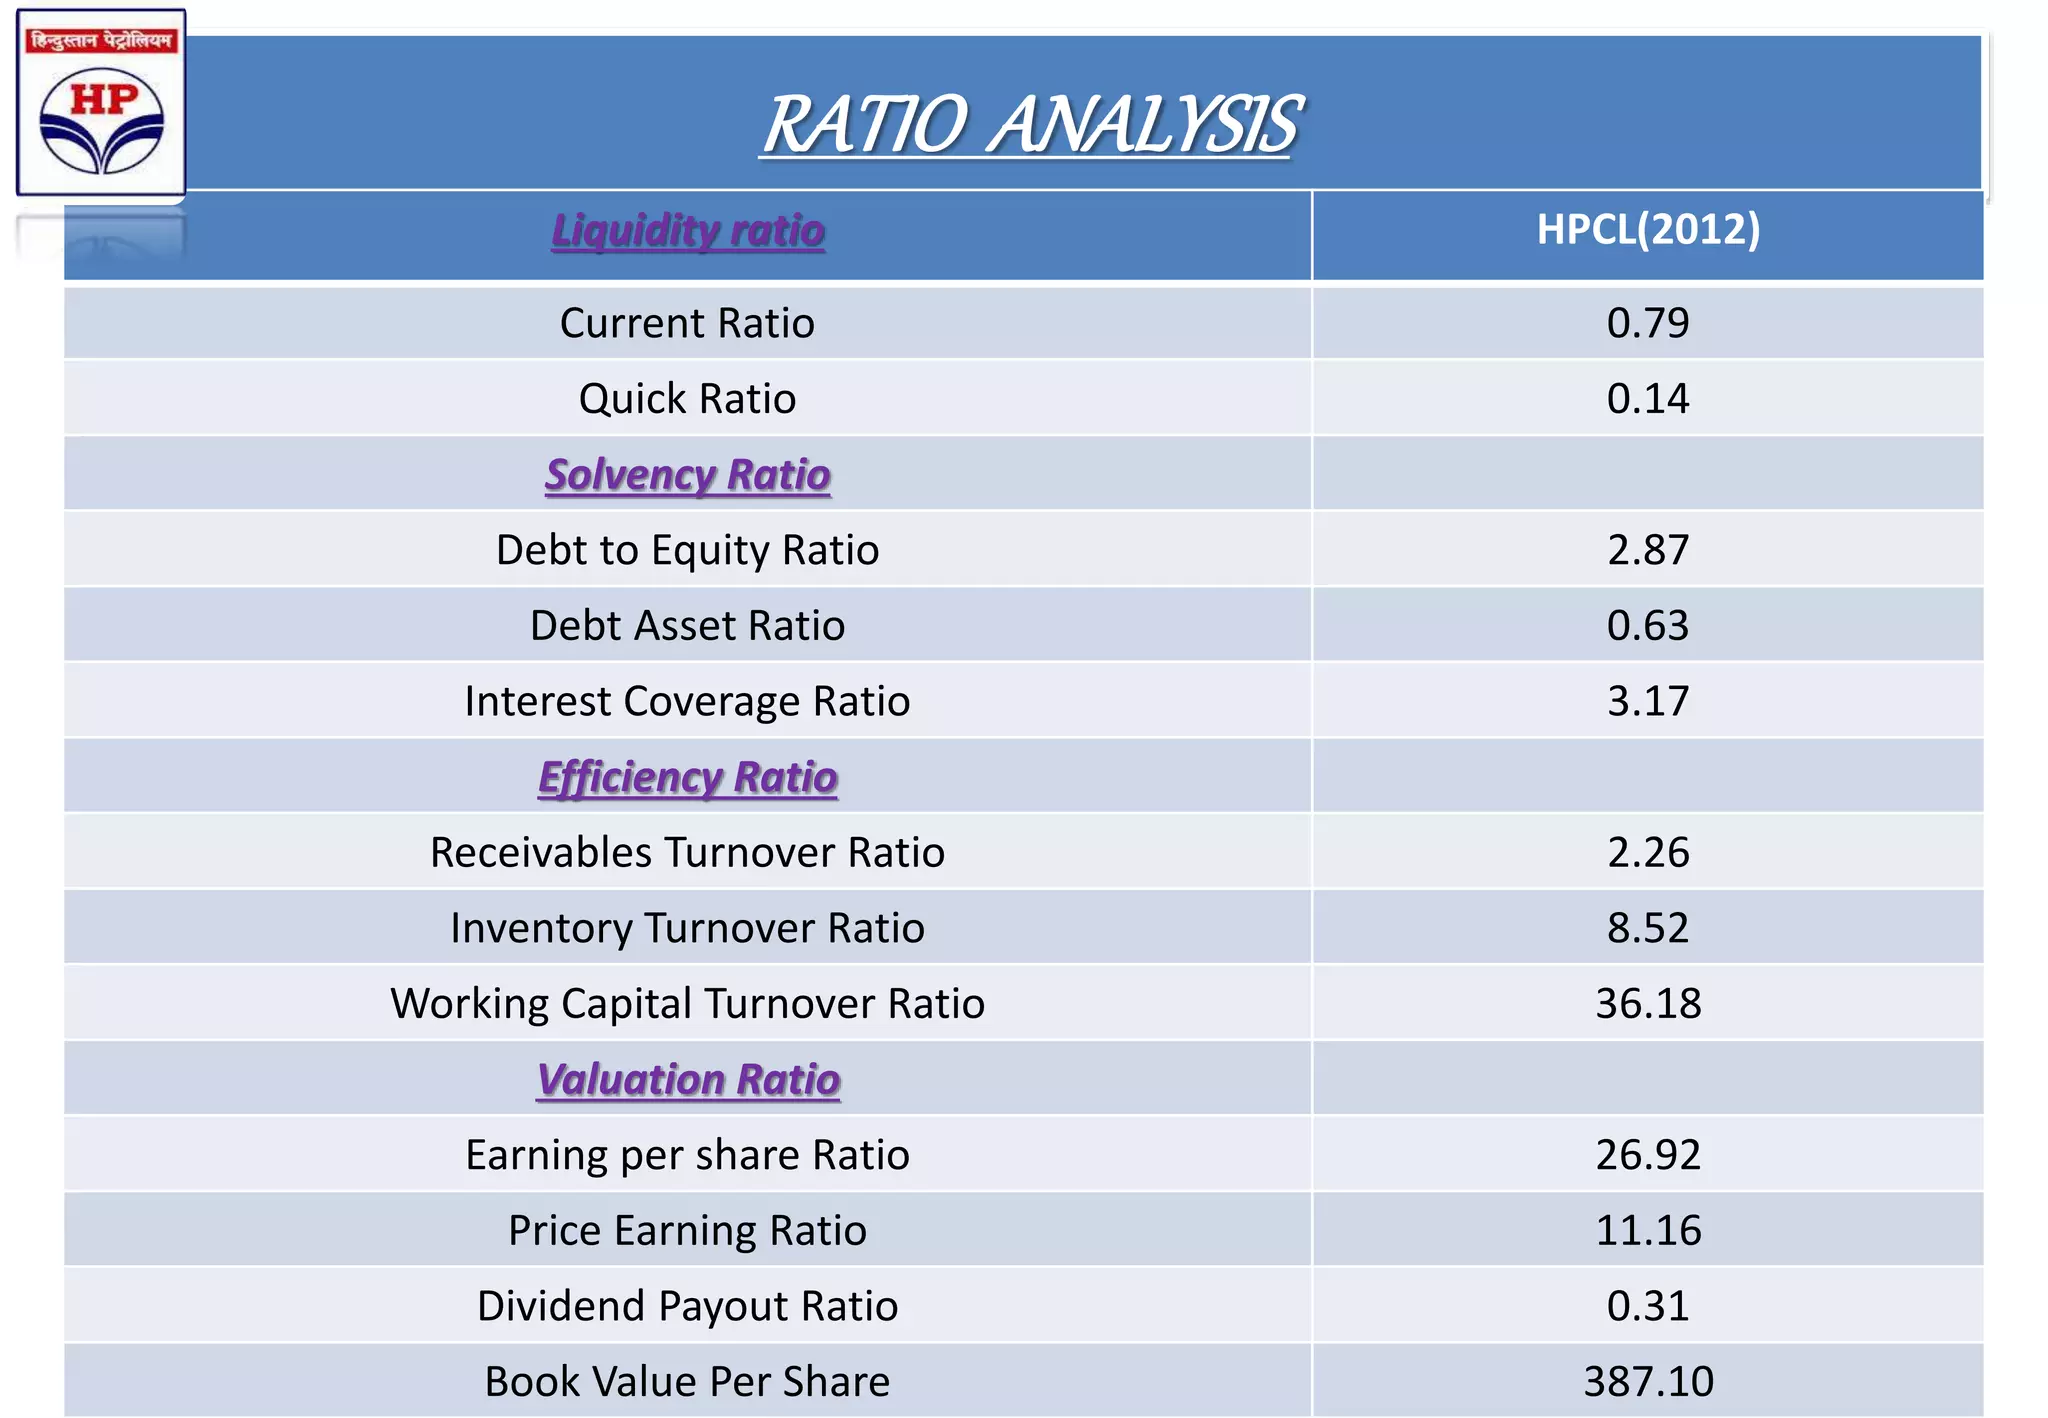

HPCL is an Indian state-owned oil and natural gas company headquartered in Mumbai. It operates two major refineries in Mumbai and Vishakhapatnam. The document analyzes HPCL's mission, vision, products, competitors, shareholding pattern, financial performance, ratio analysis, SWOT analysis, and future outlook. It recommends automating Kandla Terminal's manual operations to increase efficiency and support effective decision making.


