This document discusses effective academic writing, focusing on how to write proposals, theses, and publications using the IMRAD format. It emphasizes the importance of structuring the introduction, methods, results, and discussion sections to clearly convey research problems and findings. Additionally, it provides guidance on identifying research gaps, developing hypotheses, and ensuring that the writing is coherent and engaging.


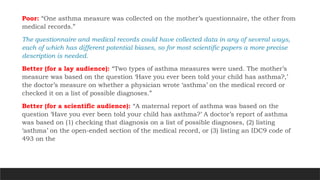
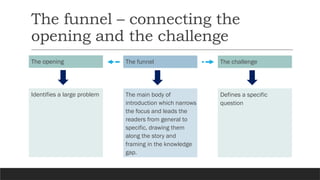
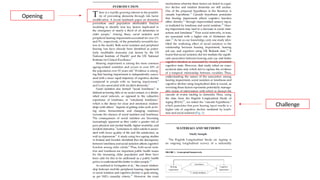
![How your opening identify your power position
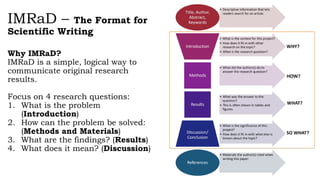
Visual and hearing impairments are associated
with cognitive decline in older people (Maharani
et al., 2018 – Age and Ageing)
Maintaining cognitive function in later life has become a public health
priority as the burden imposed by dementia in the ageing population has
increased more rapidly than that of most other diseases [1].
Trajectories of recall memory as predictive of
hearing impairment: A longitudinal cohort study
(Maharani et al., 2020 – PLOS One)
Hearing impairment has become a major concern for global health. The
2015 Global Burden of Disease estimates showed that hearing impairment
was the fourth leading cause of years lived with disability (YLDs) and those
YLDs increase from age 35 years to 64 years [1].
Healthcare system performance and
socioeconomic inequalities in hearing and visual
impairments in 17 European countries (Maharani
et al., 2020 – Eu J of Public Health)
As the world population ages, Europeans are among those enjoying the
longest life expectancies in the world: 75 years for men and 81 for women
[1].](https://image.slidesharecdn.com/howtowriteagoodproposalmanuscriptanddisertation-240828212521-09d0c568/85/How-to-write-a-good-proposal_manuscript-and-disertation-pptx-11-320.jpg)
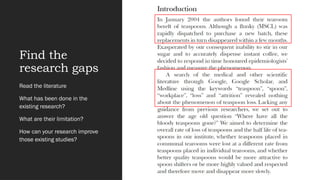
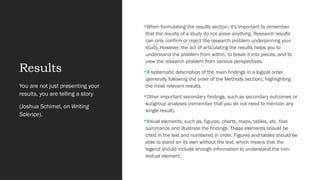
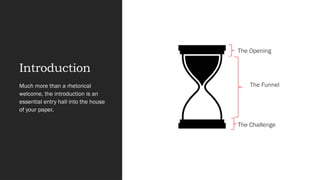
![Better: “Five out of seven recent studies (authors, dates) of the
relationship between race and birth weight in the United States found
that [pattern and example]. In contrast, Michaelson (date) found
[different pattern and example], while DiDonato (date) . . .”
Poor: “Smith and Jones (date) studied the relationship
between race and birth weight in the United States and found
[XYZ].”Michaelson (date) also studied the relationship between
race and birth weight and found [ABC]. [Separate descriptions
of results from five more studies on the topic.]](https://image.slidesharecdn.com/howtowriteagoodproposalmanuscriptanddisertation-240828212521-09d0c568/85/How-to-write-a-good-proposal_manuscript-and-disertation-pptx-17-320.jpg)
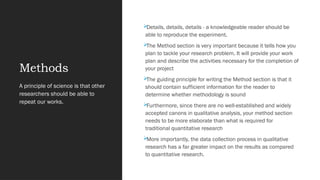

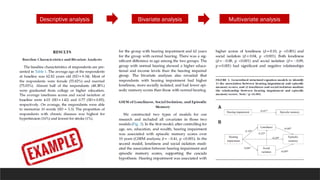
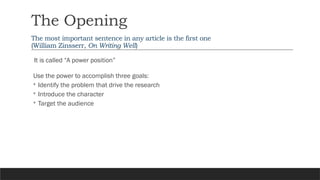
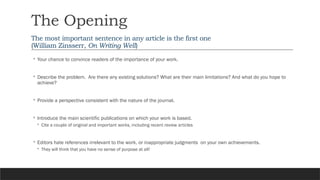
![Better: “Demographic characteristics and attitudinal factors (table A)
were drawn from the questionnaire and most health indicators from
the medical records (table B). An exception was asthma, for which
information was available from both sources.”
This description coordinates with tables (not shown) that organize
variables by data source and major conceptual groupings, eliminating
the need to specify the source for every variable individually.
Poor: “Age, sex, race, marital status, number of children, income, and
educational attainment were taken from the demographic section of the
questionnaire. Attitudes about [long list] were taken from the attitudinal
section of the questionnaire. Medical records provided information about
[long list of health items]. Asthma was also asked about on the
questionnaire.”
This description is unnecessarily long, repeating information that is far
more easily organized in a table.](https://image.slidesharecdn.com/howtowriteagoodproposalmanuscriptanddisertation-240828212521-09d0c568/85/How-to-write-a-good-proposal_manuscript-and-disertation-pptx-20-320.jpg)