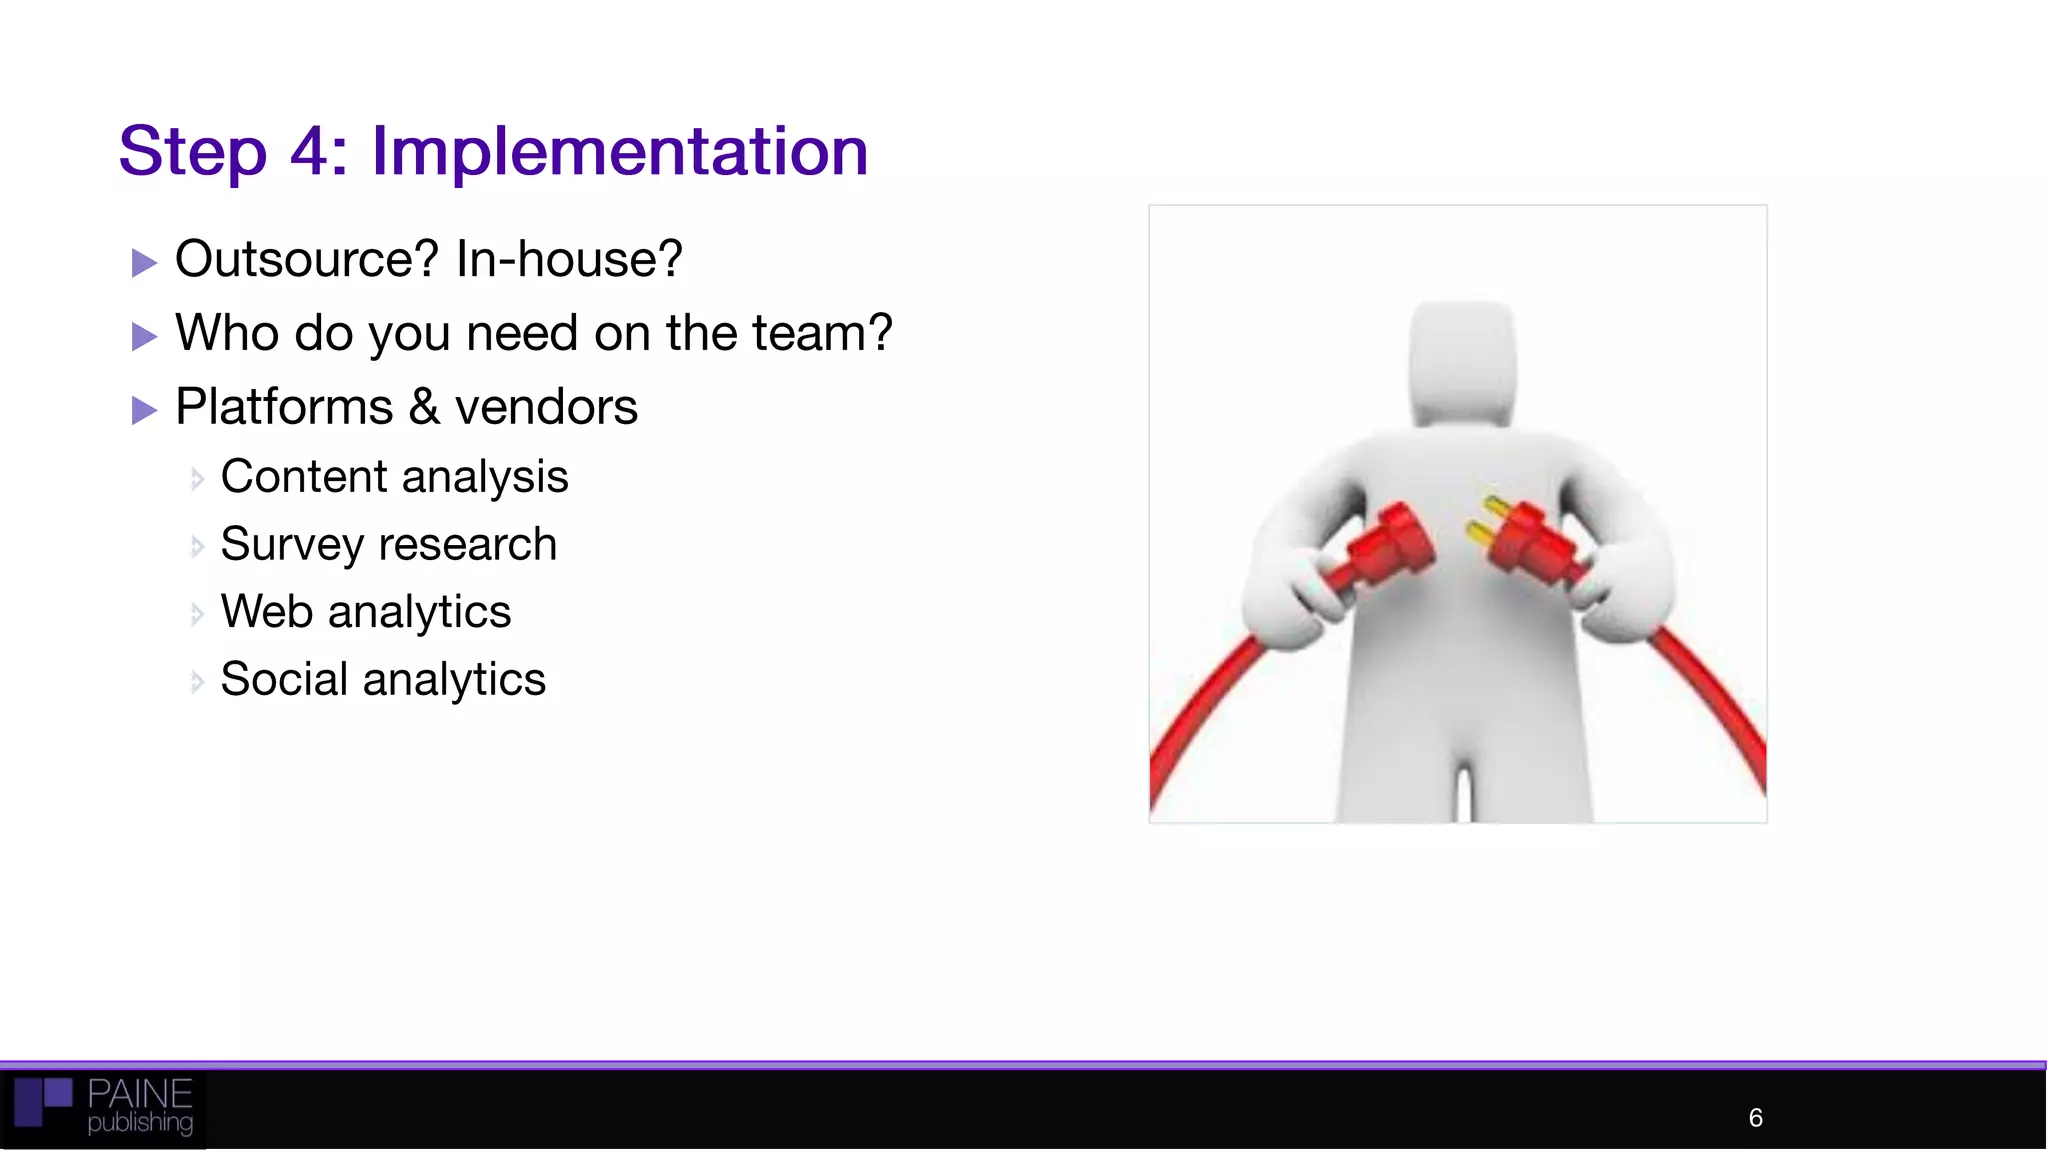
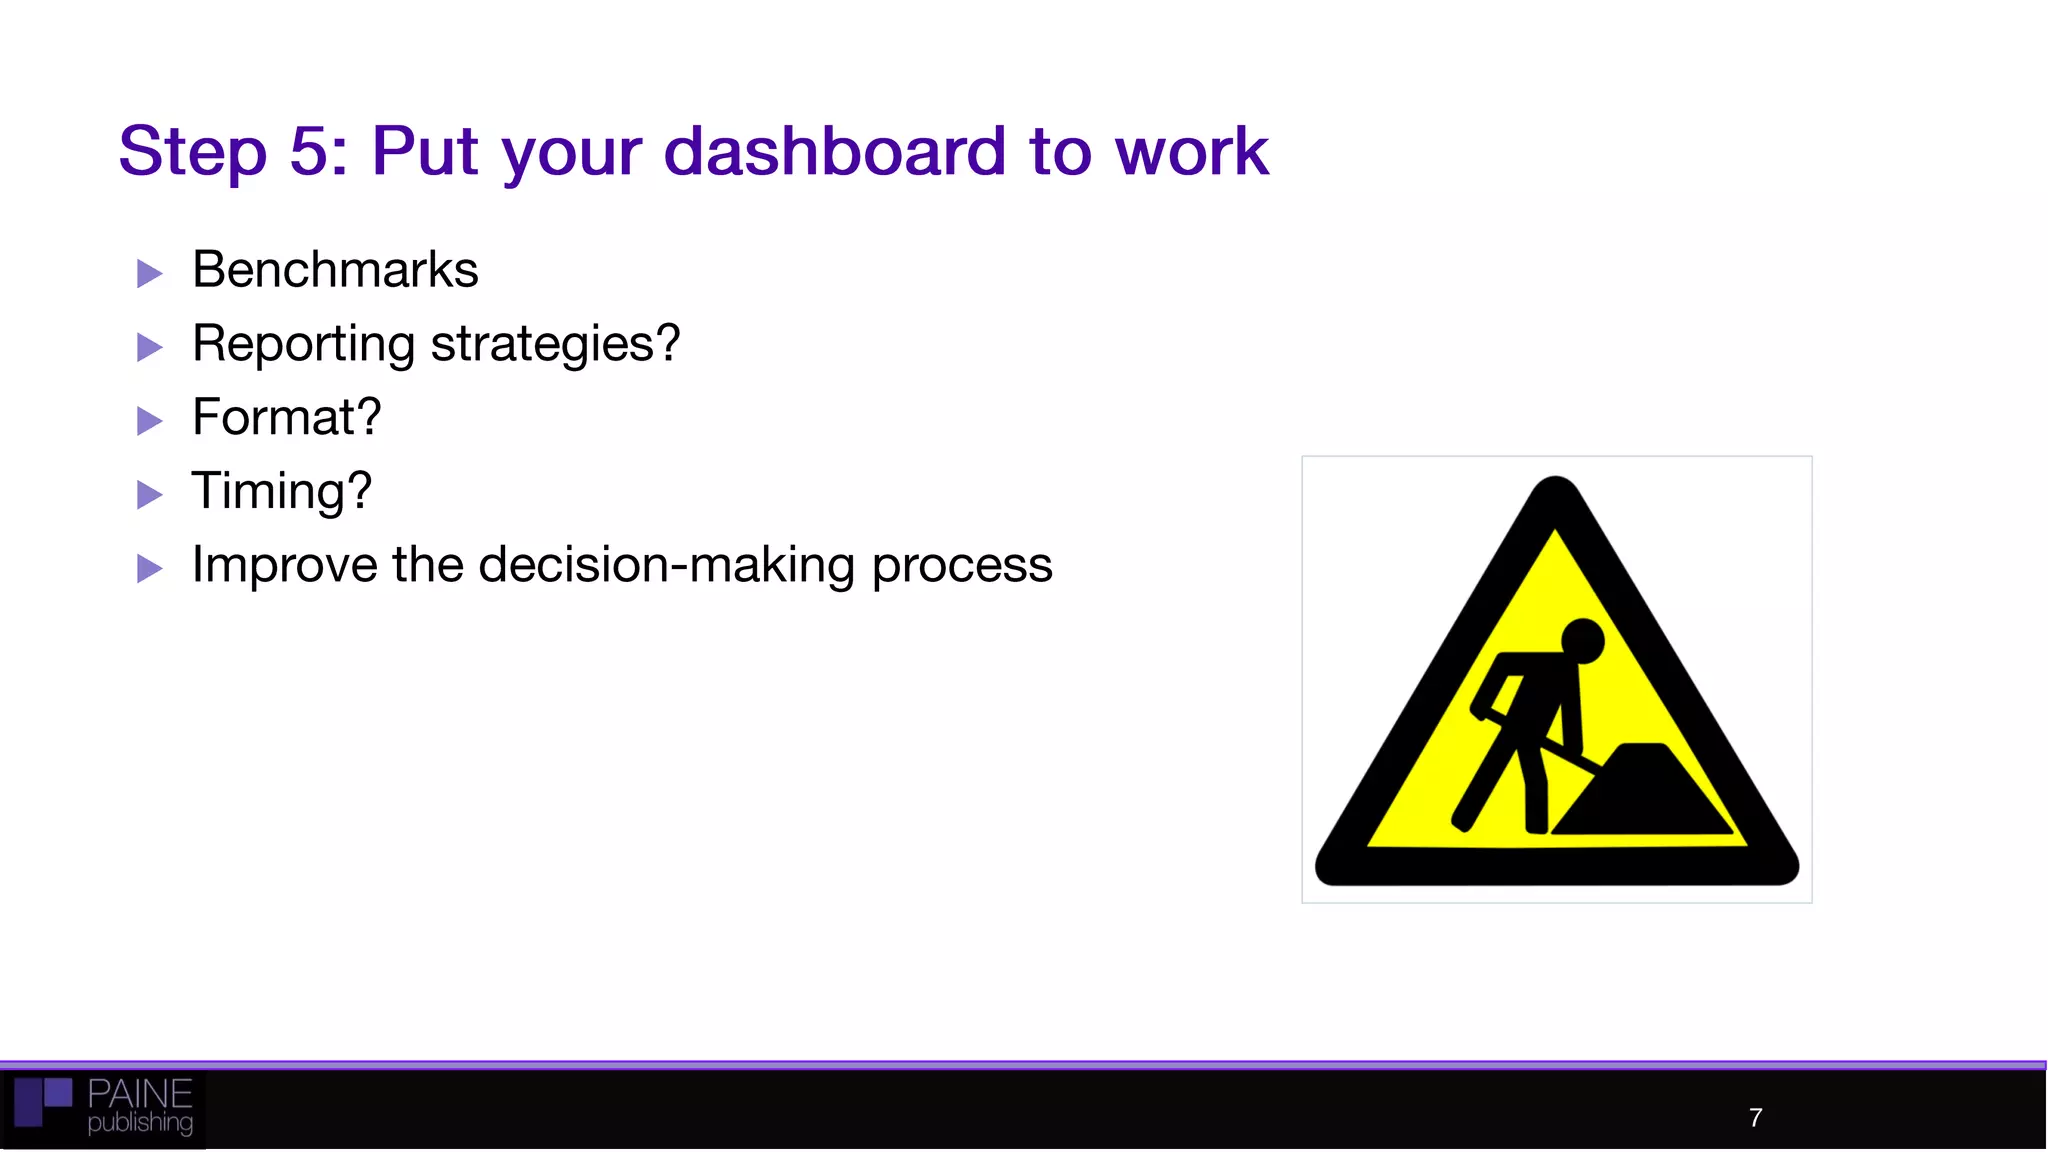
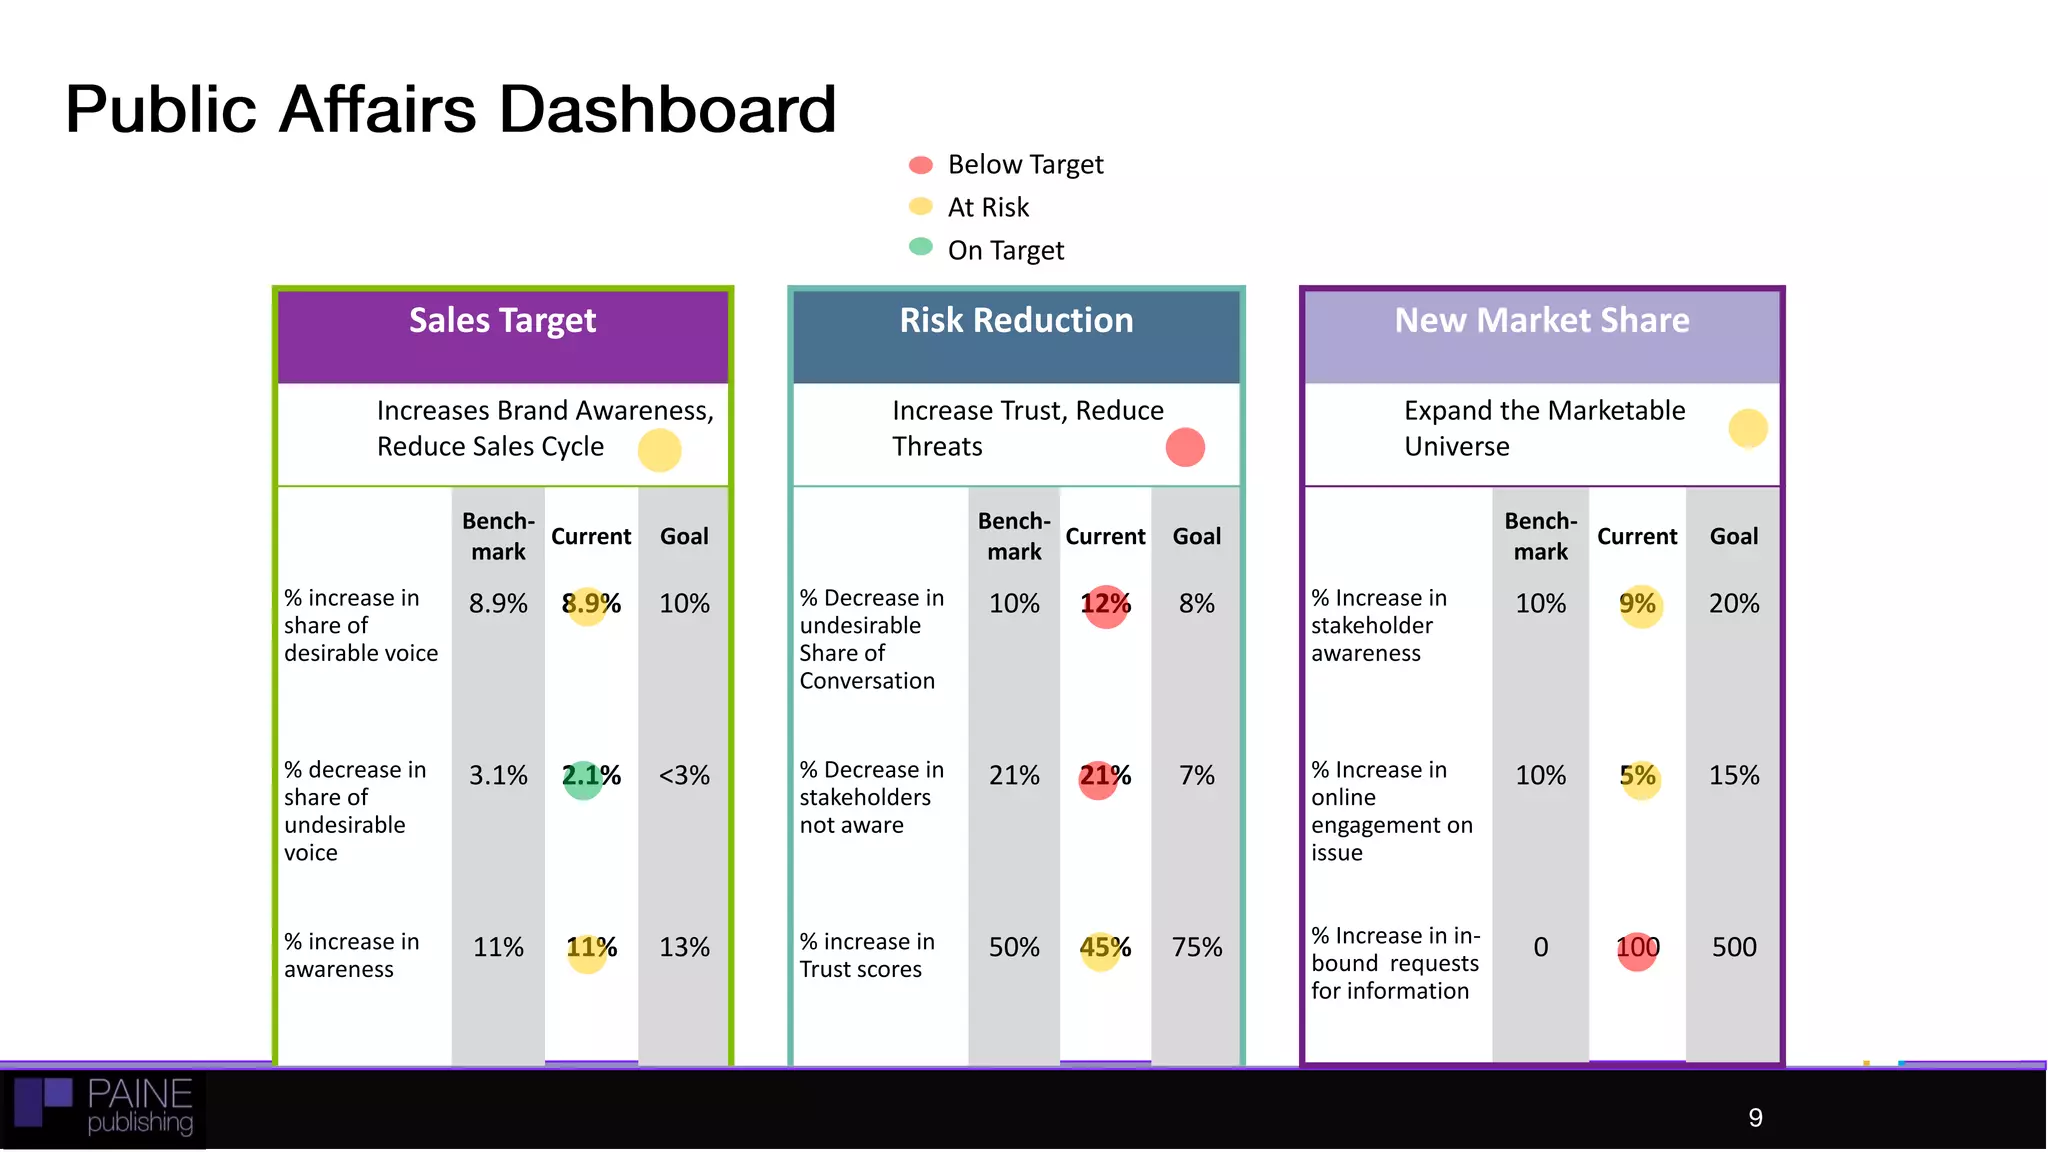
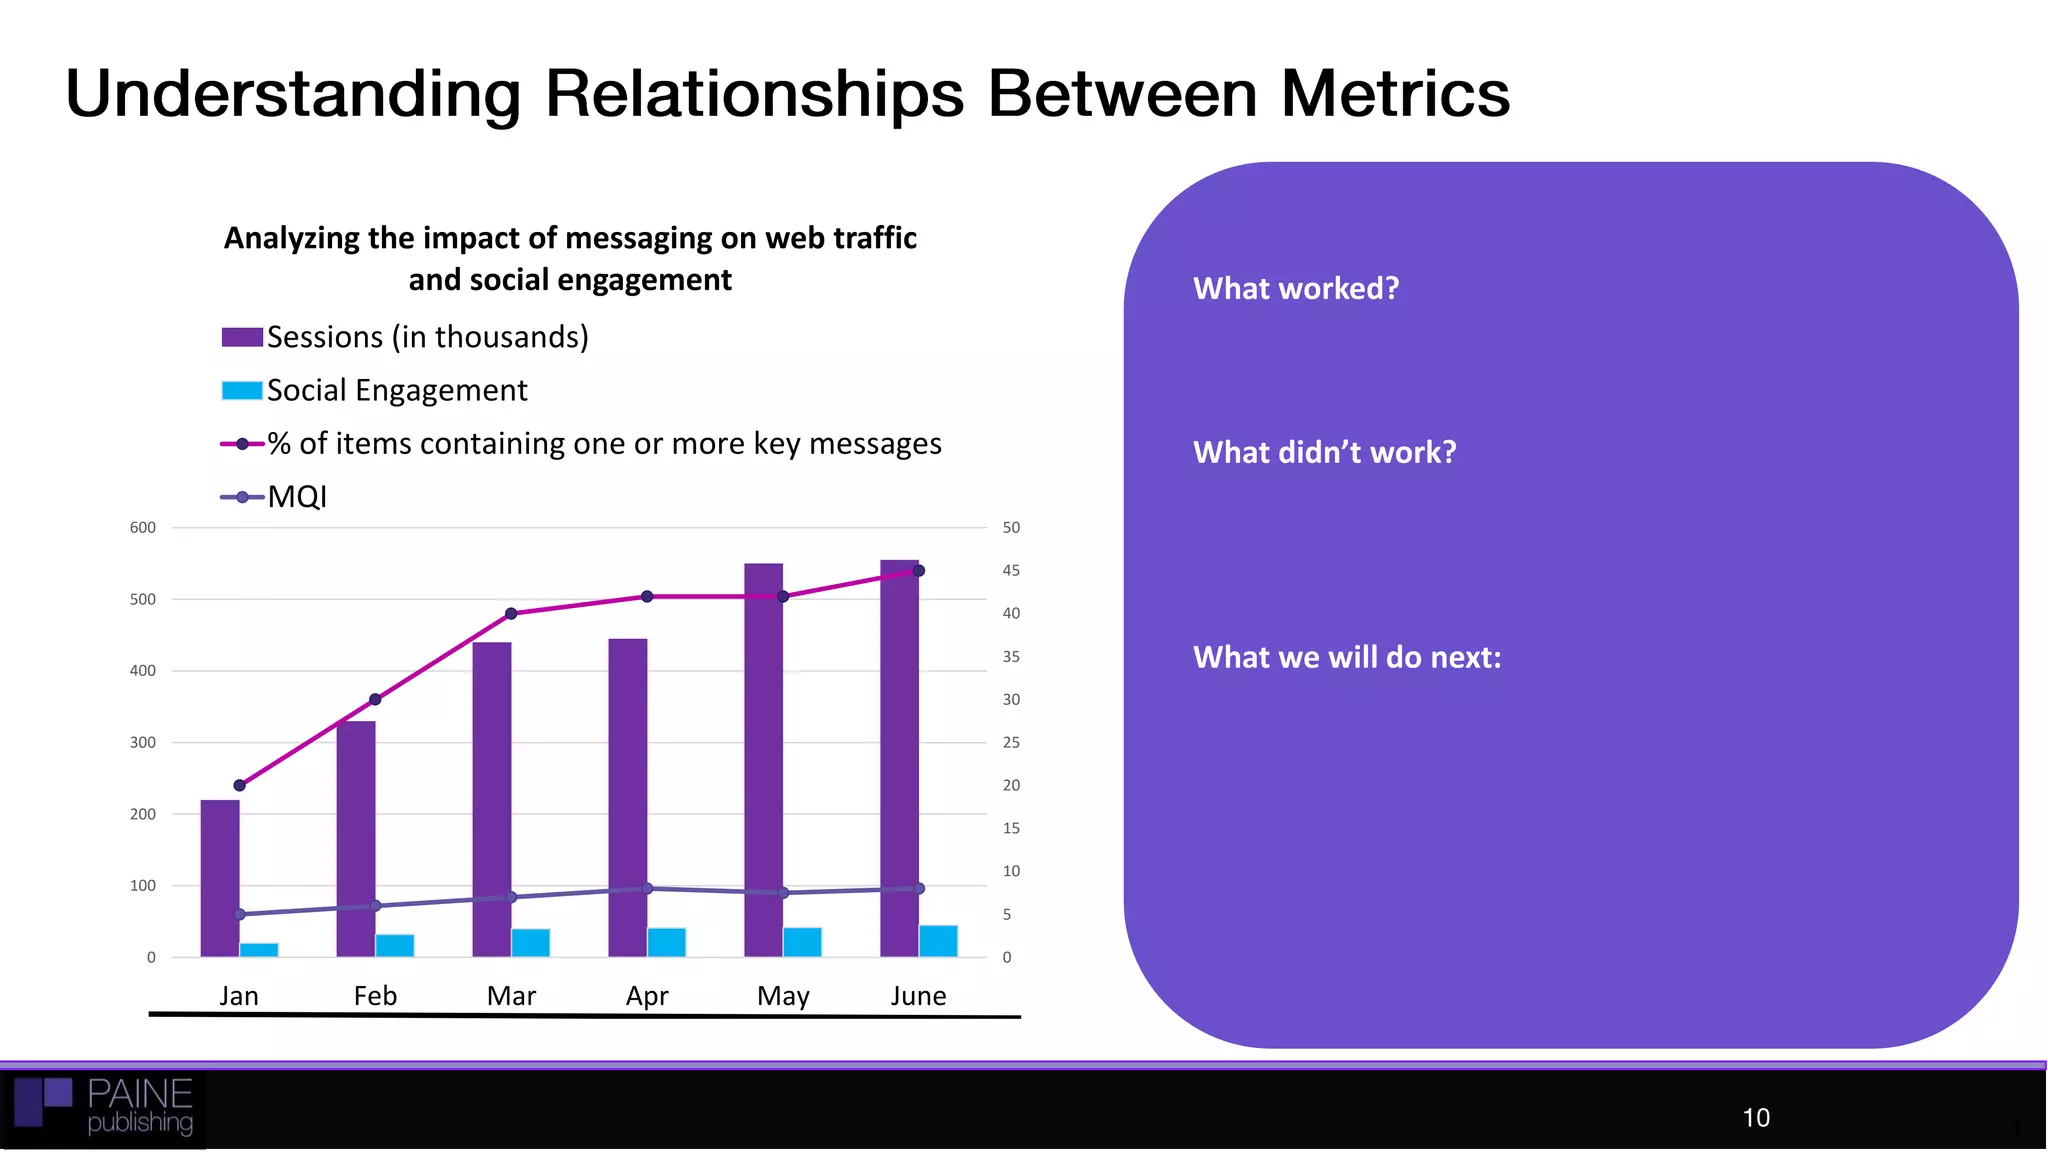
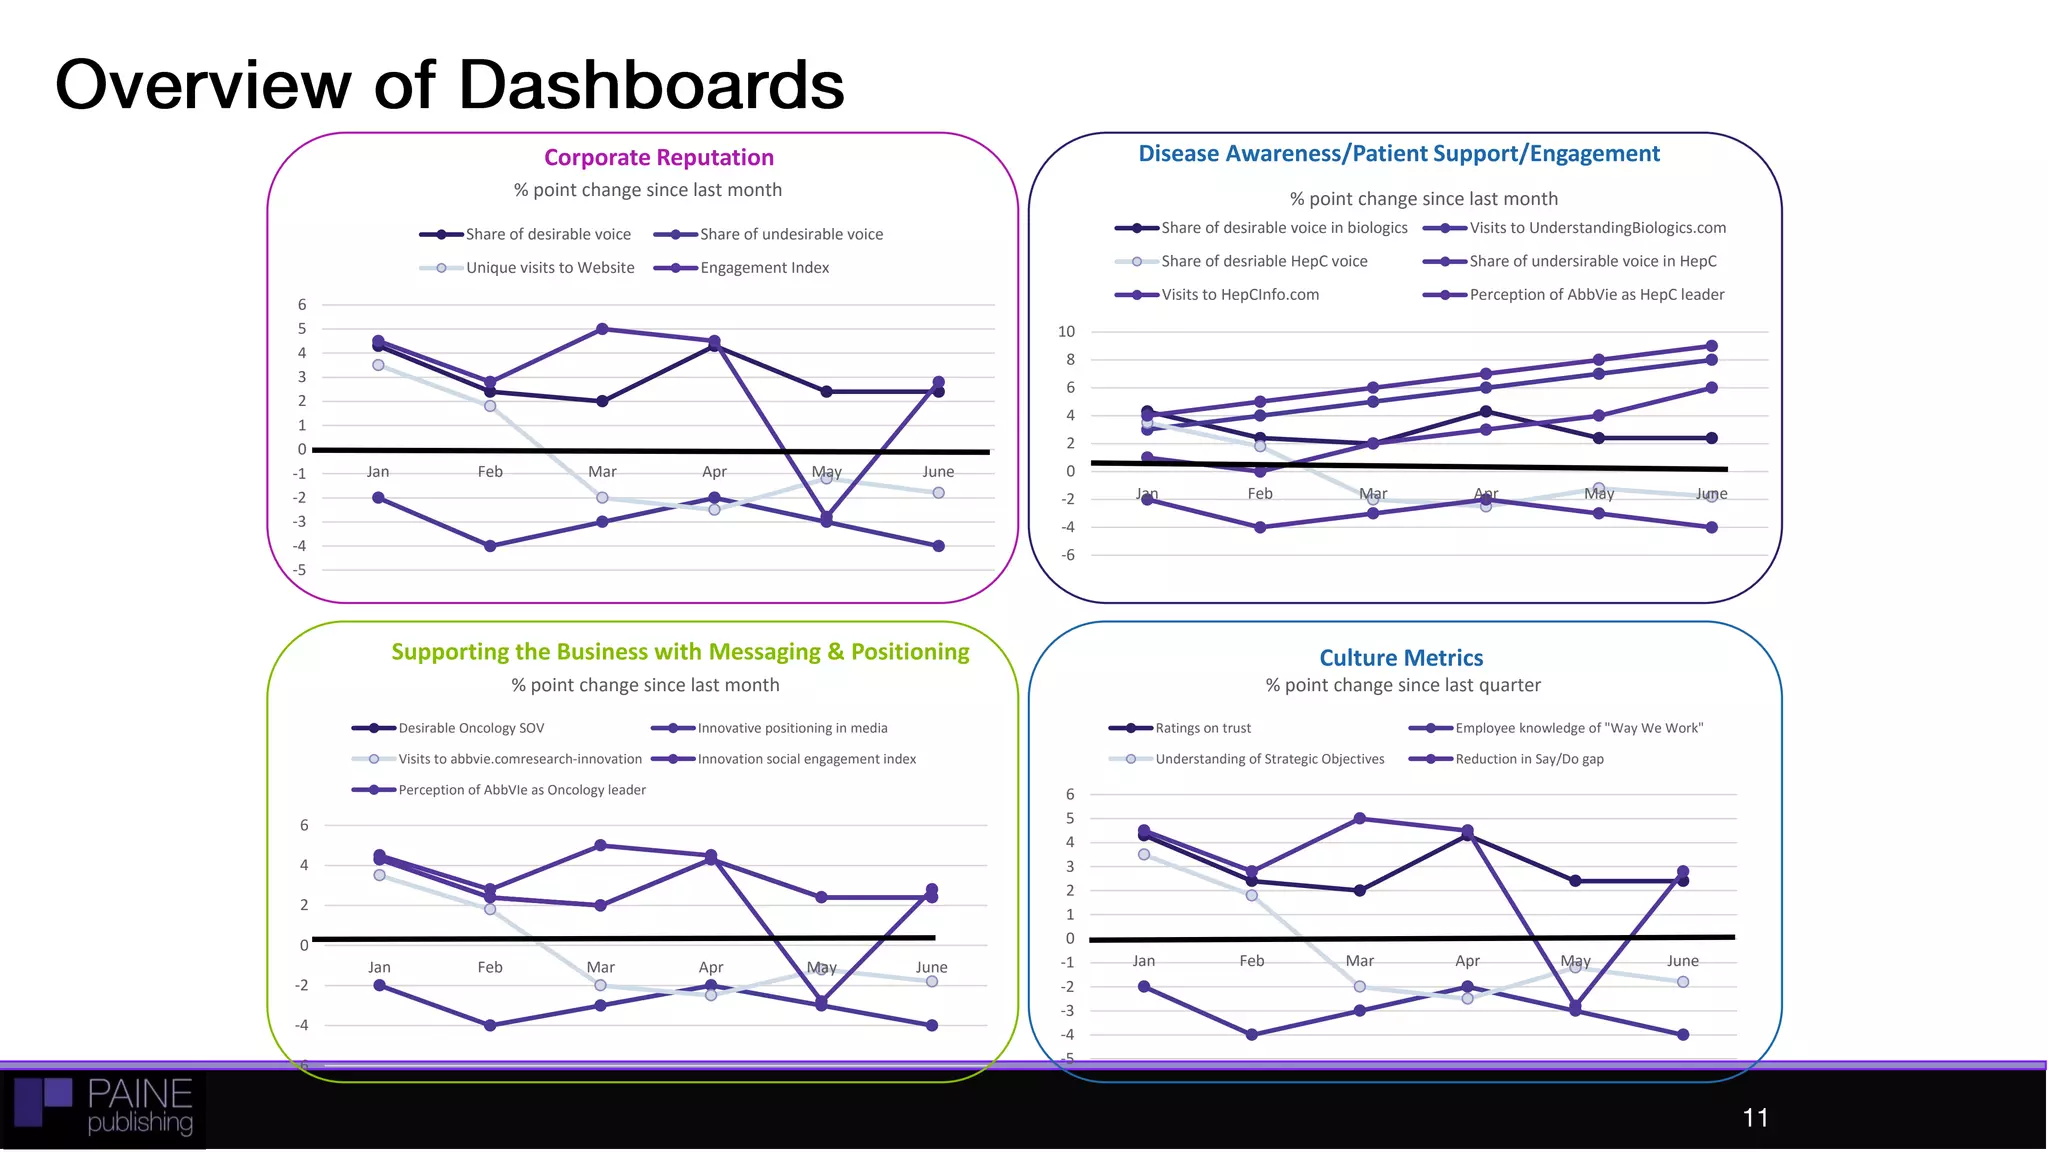
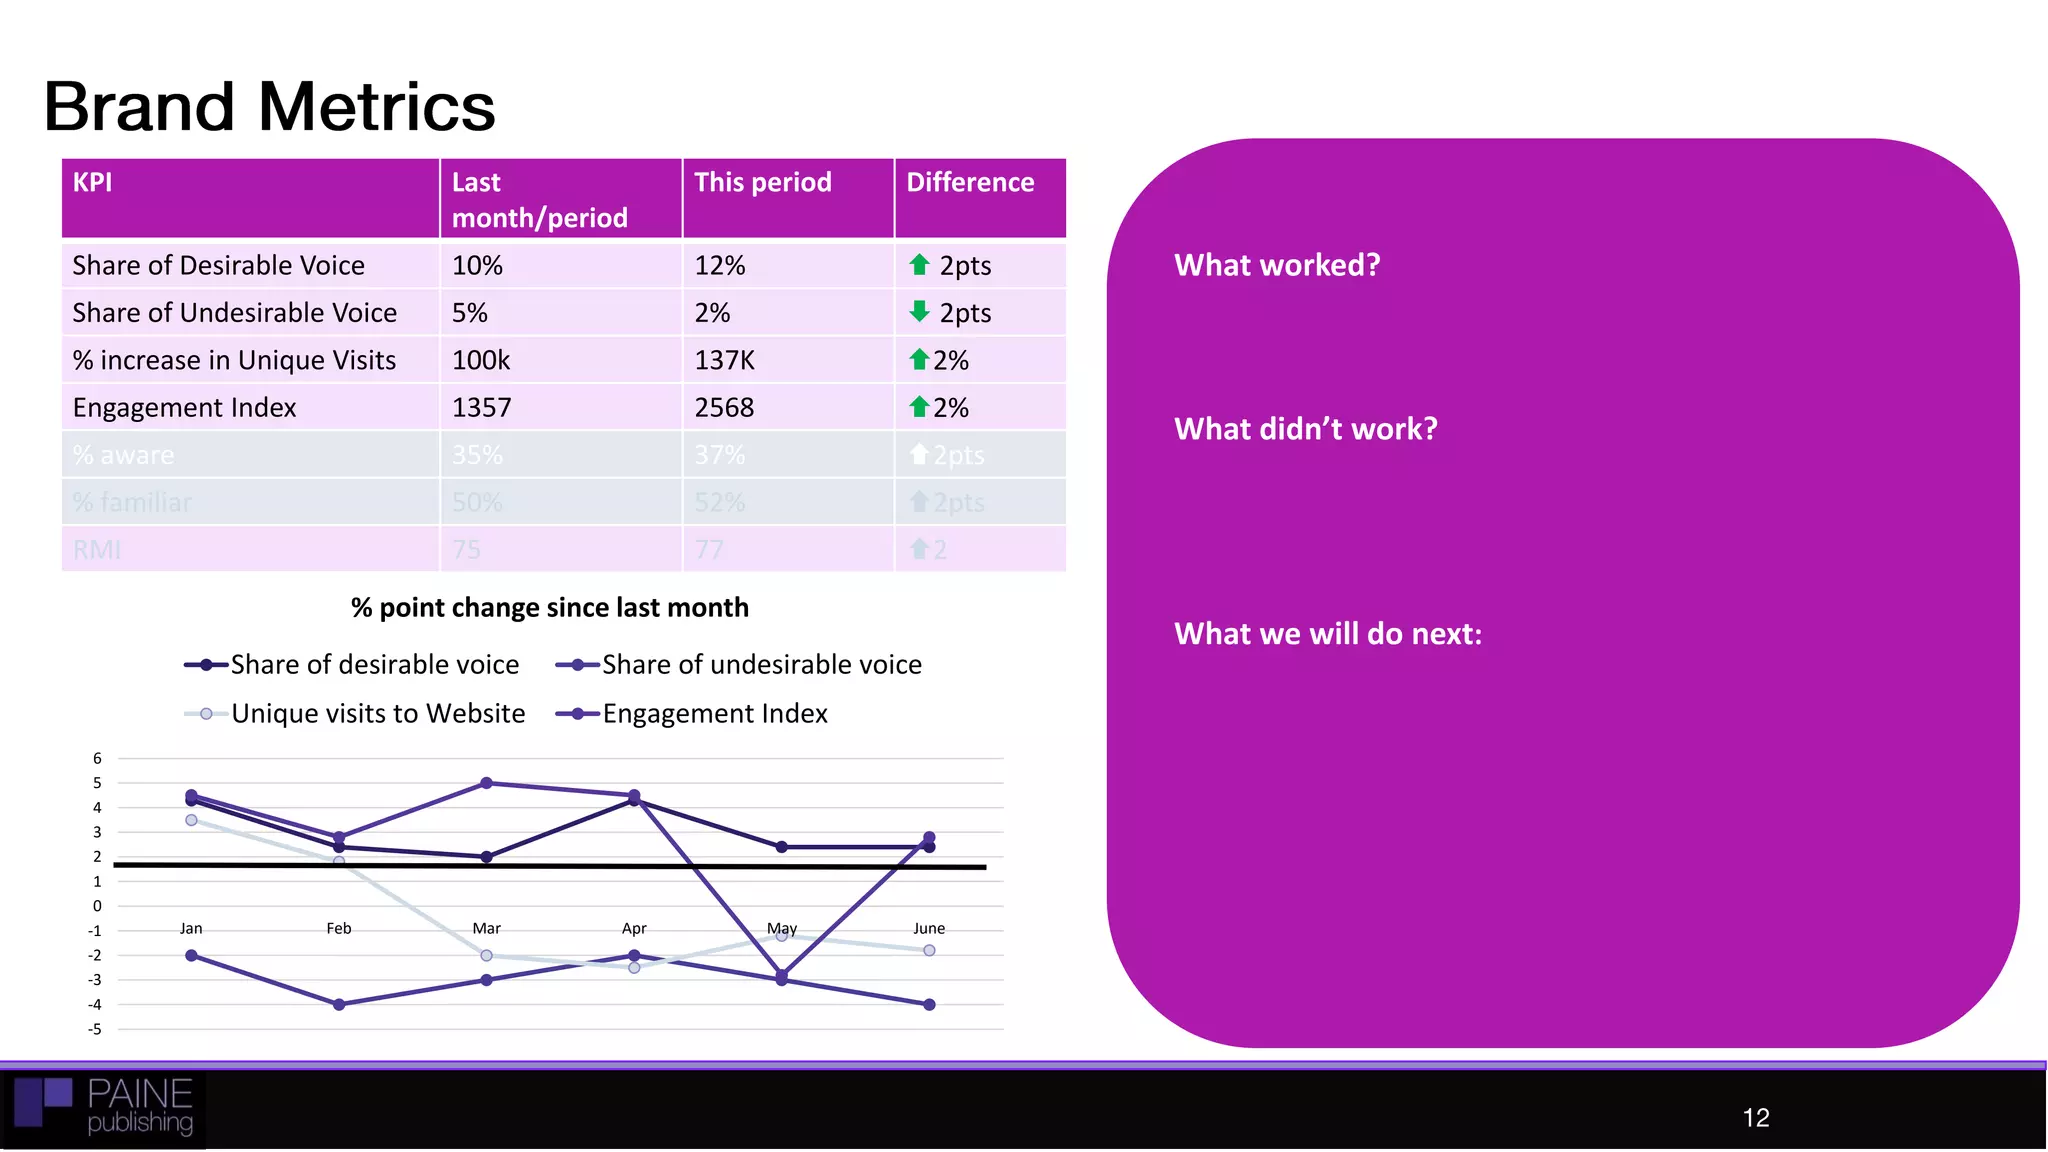
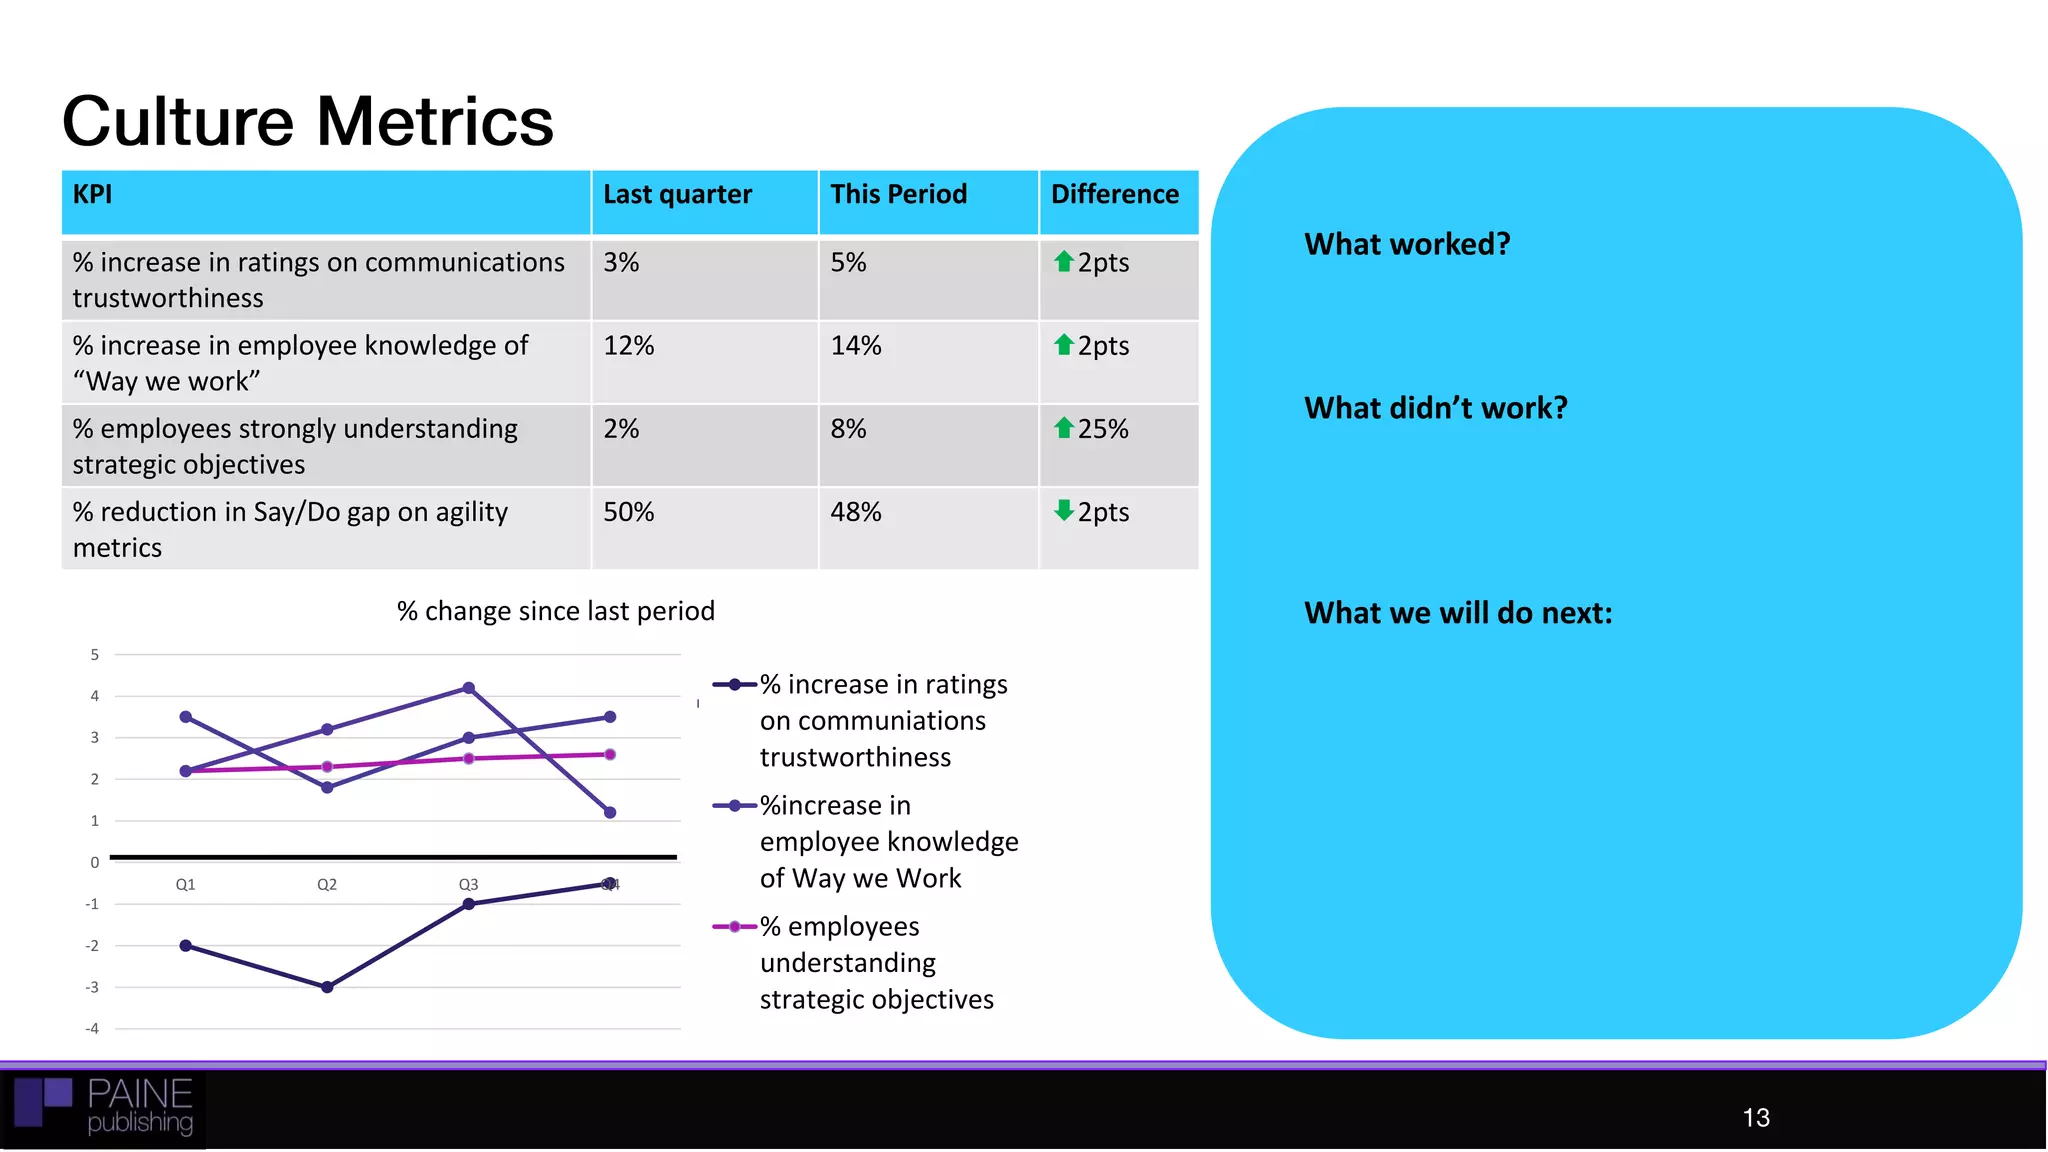
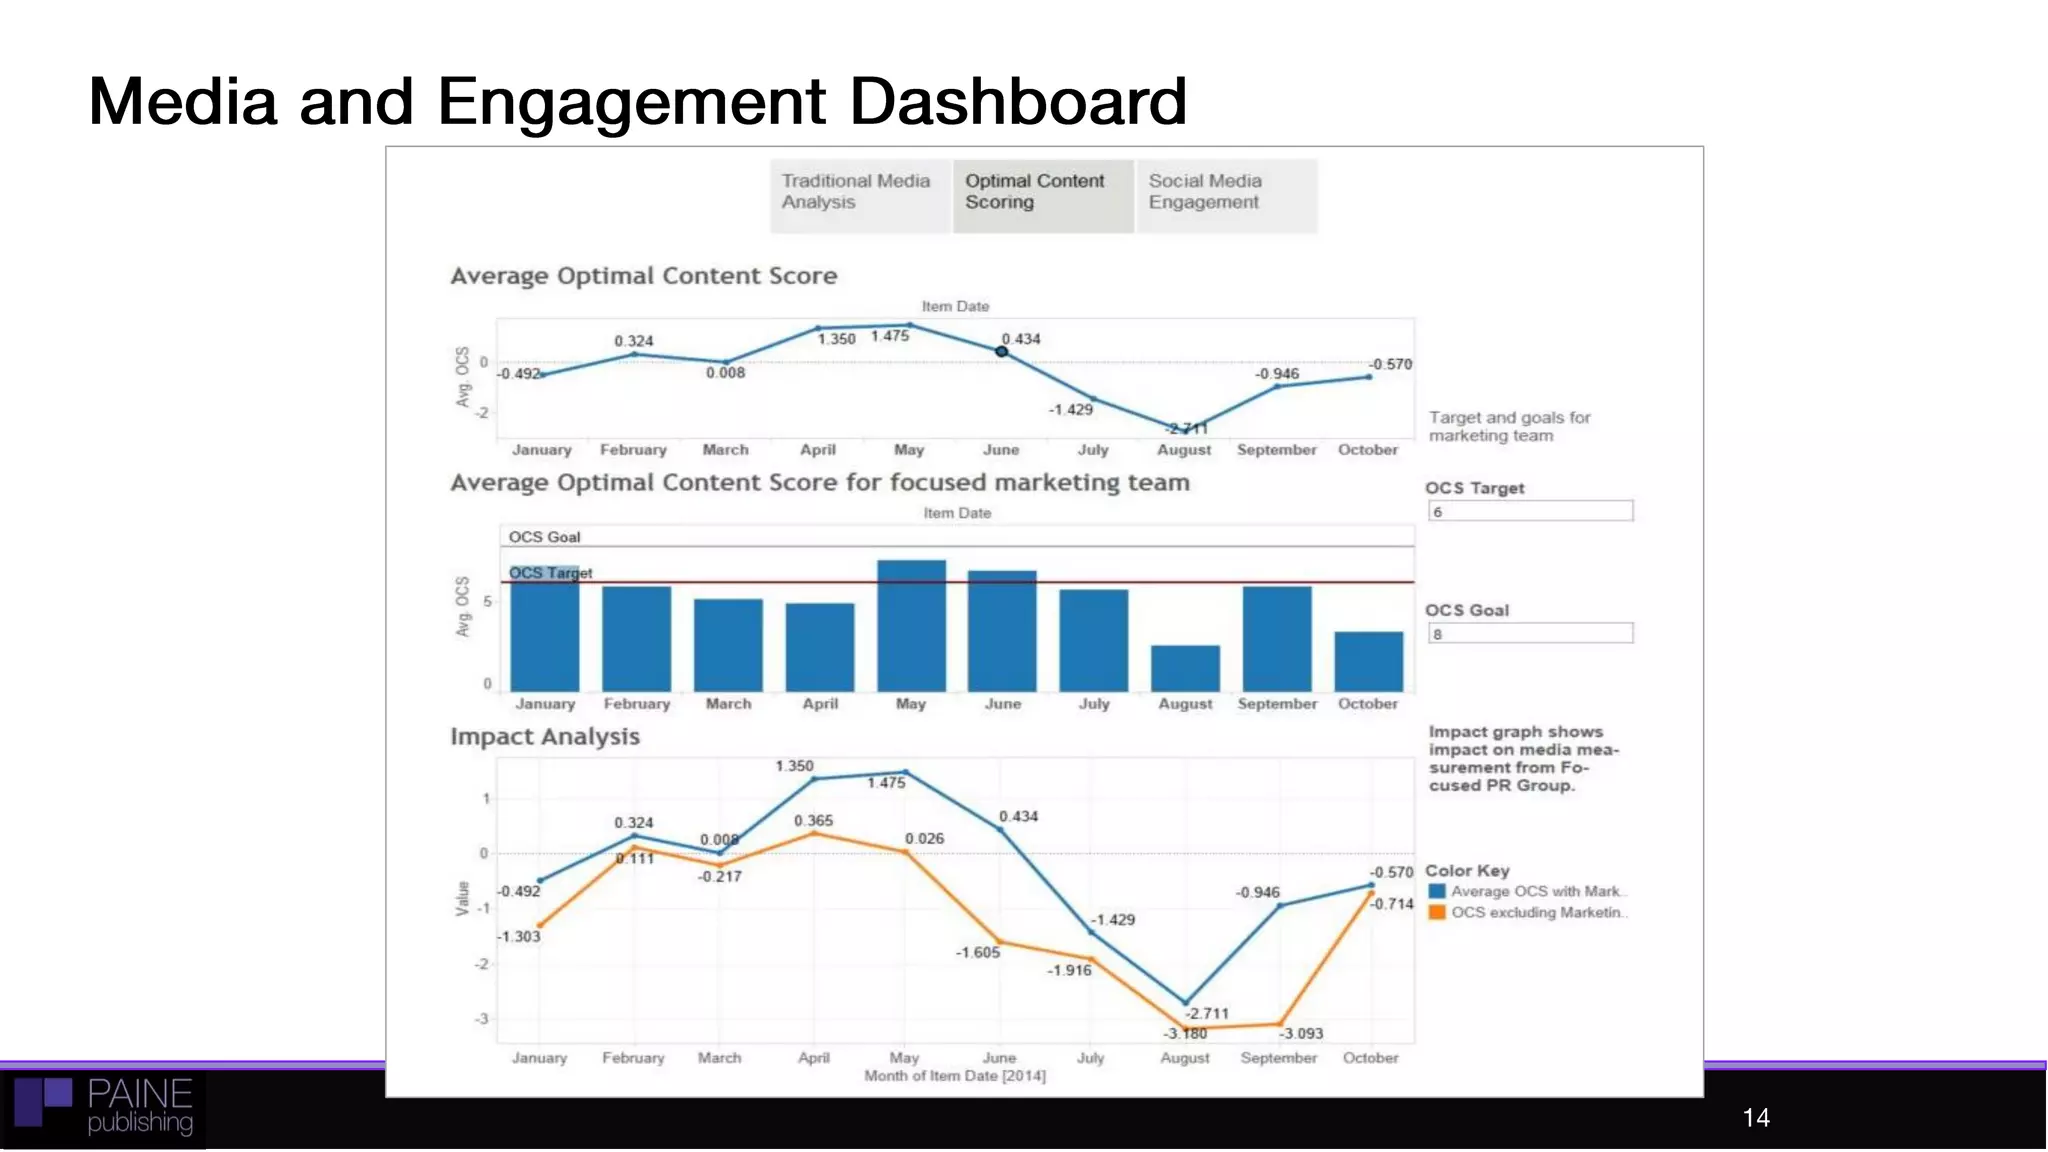
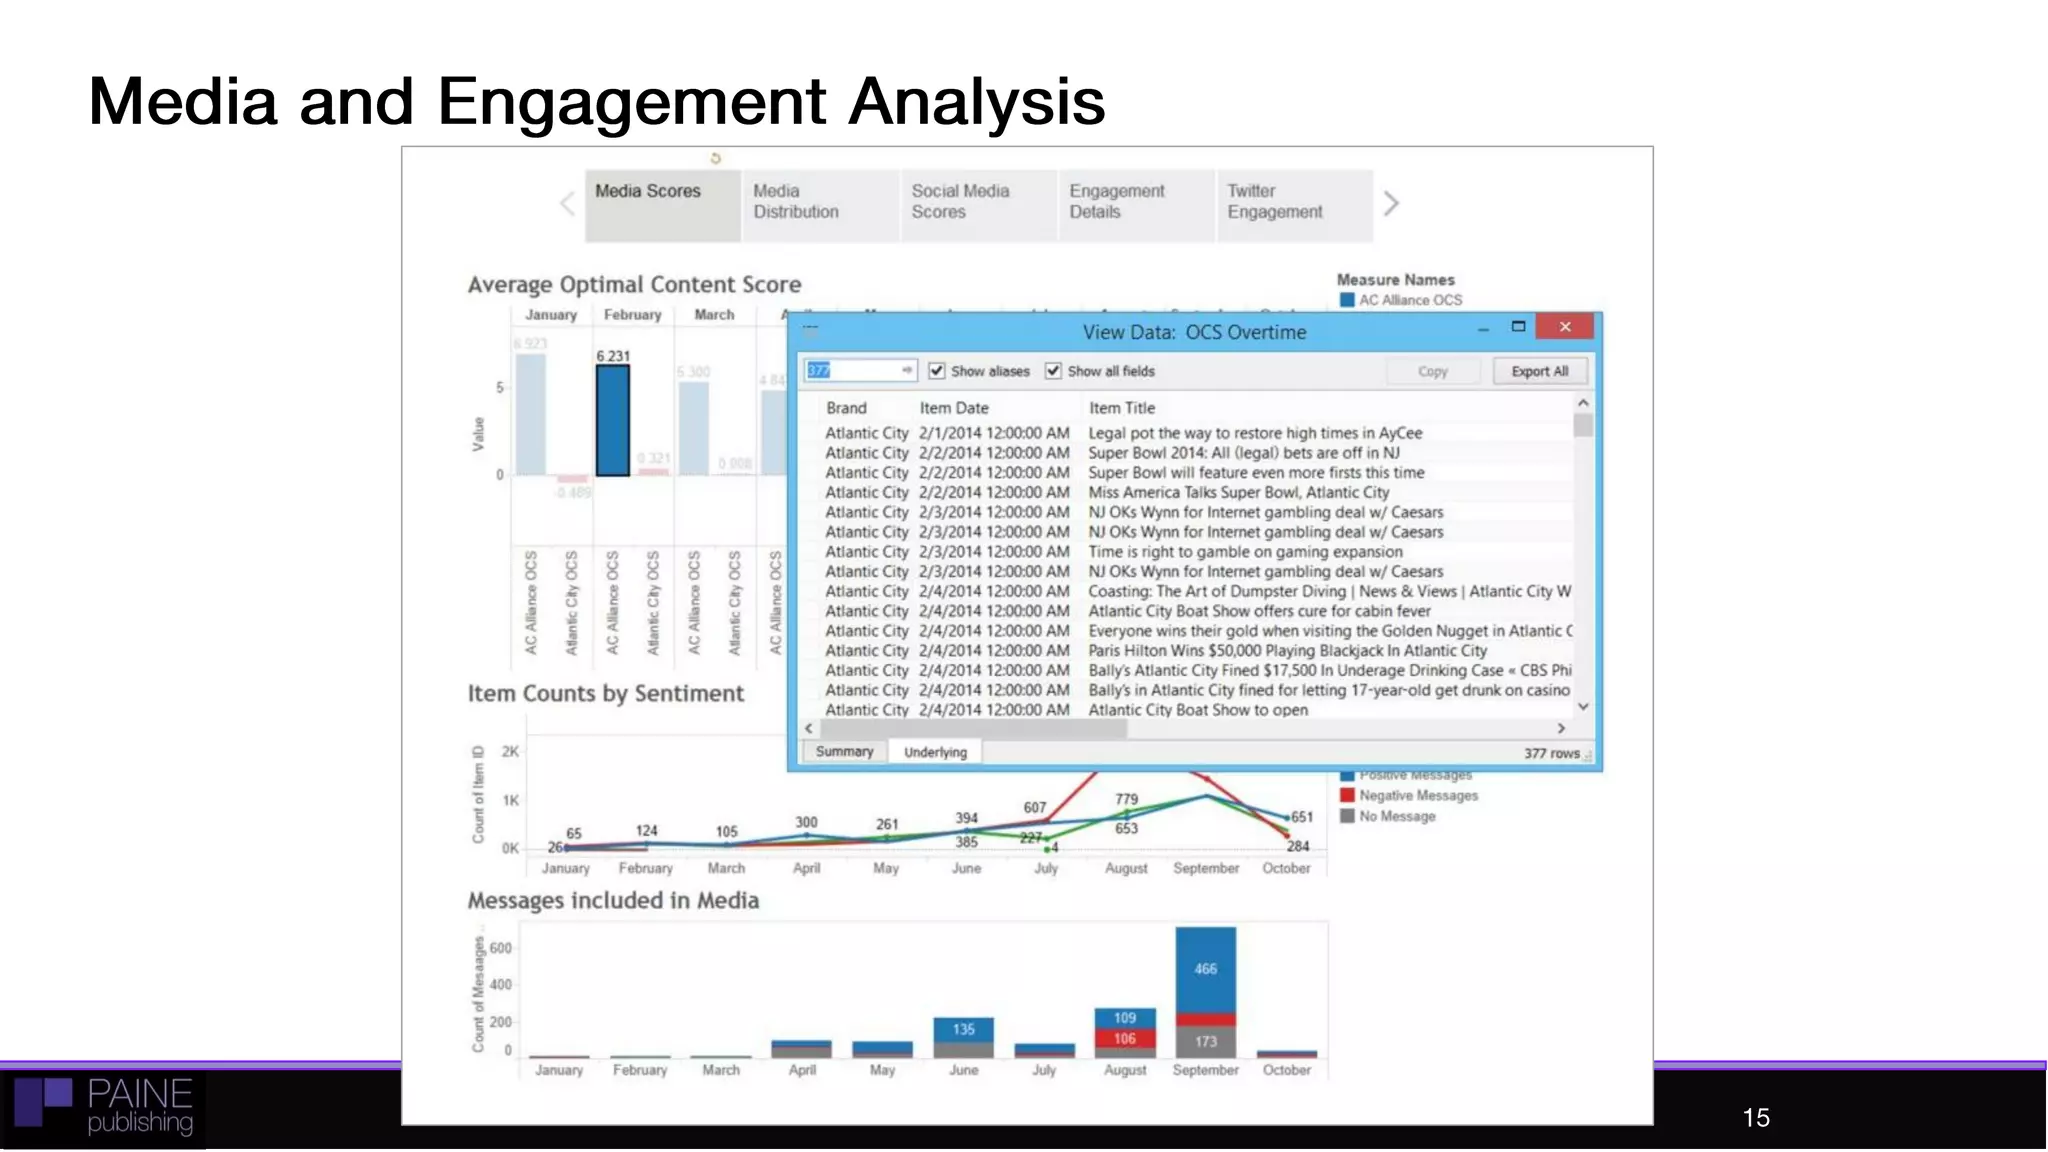
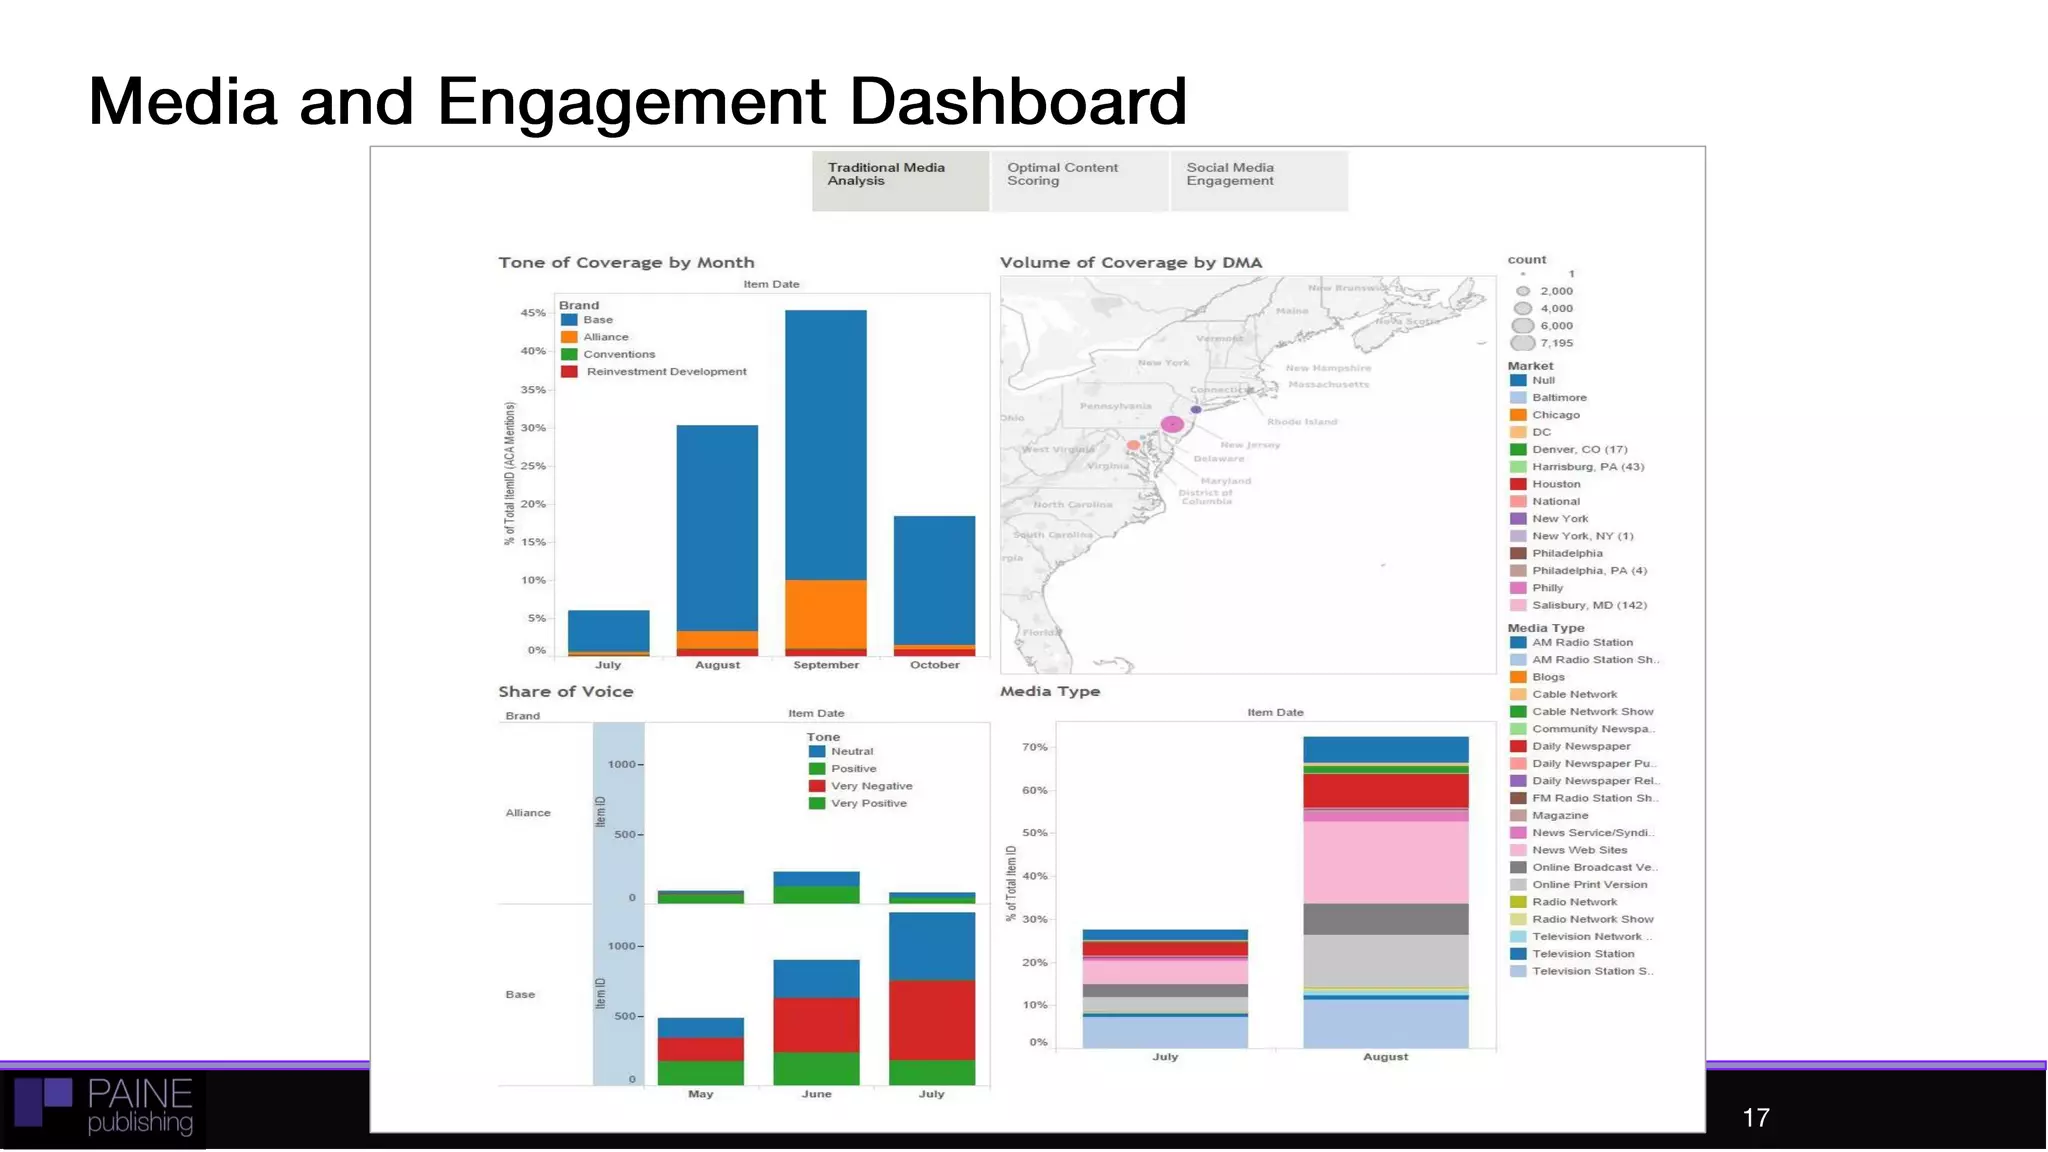
Measurement Hour
May 25, 2016
Katie Delahaye Paine
CEO, Paine Publishing
www.painepublishing.com | @queenofmetrics | measurementqueen@gmail.com
How To Plan for, Design, and Implement
a Communications Dashboard
Steps to follow when creating a dashboard:
 Step 1: Get consensus on goals & objectives
 Step 2: The audit
 Step 3: Track down data
 Step 4: Implementation
 Step 5: Put your dashboard to work
2
Step 1: Get consensus on goals & objectives
 Set up a meeting to decide:
 What’s the definition of “success”?
 What outcomes need to be measured?
 Who will use it?
 Who will maintain it?
 What will it be used for?
For your department or funct
For the dashboard itself
3
Step 2: The audit
 Who else is using dashboards?
 What technology exists?
 What tools are available?
 Who are the experts?
 Outsource vs. in-house
4
Step 3: Track down data
 How will you get the data you need?
 What sources of data exist?
 How valid is the data you have?
 Accuracy tests
 Validity tests
5
Step 4: Implementation
 Outsource? In-house?
 Who do you need on the team?
 Platforms & vendors
 Content analysis
 Survey research
 Web analytics
 Social analytics
6
Step 5: Put your dashboard to work
 Benchmarks
 Reporting strategies?
 Format?
 Timing?
 Improve the decision-making process
7
Examples of Dashboards
Sales Target Risk Reduction New Market Share
Increases Brand
Awareness, Reduce
Sales Cycle
Increase Trust, Reduce
Threats
Expand the Marketable
Universe
Bench-
mark
Current Goal
Bench-
mark
Current Goal
Bench-
mark
Current Goal
% increase in
share of
desirable
voice
8.9% 8.9% 10% % decrease
in
undesirable
Share of
Conversation
10% 12% 8% % Increase in
stakeholder
awareness
10% 9% 20%
% decrease
in share of
undesirable
voice
3.1% 2.1% <3% % decrease
in
stakeholders
not aware
21% 21% 7% % Increase in
online
engagement
on issue
% Increase in
in-bound
requests for
information
10% 5% 15%
% increase in
awareness
11% 11% 13% % increase in
Trust scores
50% 45% 75% 0 100 500
Below Target
At Risk
On Target
9
Public Affairs Dashboard
Understanding Relationships Between Metrics
What worked?
What didn’t work?
What we will do next:
0
5
10
15
20
25
30
35
40
45
50
0
100
200
300
400
500
600
Jan Feb Mar Apr May June
Analyzing the impact of messaging on
web traffic and social engagement
Sessions (in thousands)
Social Engagement
410
-5
-4
-3
-2
-1
0
1
2
3
4
5
6
Jan Feb Mar Apr May June
% point change since last month
Share of desirable voice Share of undesirable voice
Unique visits to Website Engagement Index
Overview of Dashboards
Corporate Reputation
-5
0
5
10
Jan Feb Mar Apr May June
% point change since last month
Share of desirable voice in biologics
Visits to UnderstandingBiologics.com
Share of desriable HepC voice
Share of undersirable voice in HepC
Visits to HepCInfo.com
Perception of AbbVie as HepC leader
-6
-4
-2
0
2
4
6
Jan Feb Mar Apr May June
% point change since last month
Desirable Oncology SOV
Innovative positioning in media
Visits to abbvie.comresearch-innovation
Innovation social engagement index
Perception of AbbVIe as Oncology leader
-6
-4
-2
0
2
4
6
Jan Feb Mar Apr May June
% point change since last quarter
Ratings on trust
Employee knowledge of "Way We Work"
Understanding of Strategic Objectives
Reduction in Say/Do gap
Culture MetricsSupporting the Business with Messaging & Positioning
Disease Awareness/Patient Support/Engagement
11
Brand Metrics
KPI Last month/period This period Difference
Share of Desirable
Voice
10% 12%  2pts
Share of Undesirable
Voice
5% 2%  2pts
% increase in Unique
Visits
100k 137K 2%
Engagement Index 1357 2568 2%
What worked?
What didn’t work?
What we will do next:
-5
0
5
10
Jan Feb Mar Apr May June
% point change since last month
Share of desirable voice
Share of undesirable voice
Unique visits to Website
Engagement Index
12
Culture Metrics
KPI Last quarter This
Period
Difference
% increase in ratings on
communications
trustworthiness
3% 5% 2pts
% increase in employee
knowledge of “Way we
work”
12% 14% 2pts
% employees strongly
understanding strategic
objectives
2% 8% 25%
% reduction in Say/Do gap on
agility metrics
50% 48% 2pts
What worked?
What didn’t work?
What we will do next:
-4
-3
-2
-1
0
1
2
3
4
5
Q1 Q2 Q3 Q4
% change since last period
% increase in
ratings on
communiations
trustworthiness
13
14
Media and Engagement Dashboard
Media and Engagement Analysis
15
Suggested calculation of “value” (to be validated by
actual sales and marketing numbers)
 100 reps contact physicians and these contacts produce on
average 100 scripts/month or 12,000 scripts/year.
 85% of reps actively engage with communications events.
 85% x 12,000 = There are 10,200 scripts that are potentially
influenced by communications programs each year.
 An average communications event for reps costs $10,000
and Communications does 50 programs a year. So,
assuming communications programs cost $500,000 annually,
the communications contribution cost is per script written is
$49/script.
 The $49 per script written cost can be compared to the cost
of in-office visits @ $300 per script.
16
Media and Engagement Dashboard
17
Thank you!
 Click here to explore the newest articles from The
Measurement Advisor
 Don’t forget: as a paid subscriber you have 24/7
access to all the articles we’ve ever published on
TMA’s homepage!
 Follow me on Twitter: @queenofmetrics
 Follow Paine Publishing on Facebook and LinkedIn
18
18

How To Plan for, Design, and Implement a Communications Dashboard

  • 1.
    Measurement Hour May 25,2016 Katie Delahaye Paine CEO, Paine Publishing www.painepublishing.com | @queenofmetrics | measurementqueen@gmail.com How To Plan for, Design, and Implement a Communications Dashboard
  • 2.
    Steps to followwhen creating a dashboard:  Step 1: Get consensus on goals & objectives  Step 2: The audit  Step 3: Track down data  Step 4: Implementation  Step 5: Put your dashboard to work 2
  • 3.
    Step 1: Getconsensus on goals & objectives  Set up a meeting to decide:  What’s the definition of “success”?  What outcomes need to be measured?  Who will use it?  Who will maintain it?  What will it be used for? For your department or funct For the dashboard itself 3
  • 4.
    Step 2: Theaudit  Who else is using dashboards?  What technology exists?  What tools are available?  Who are the experts?  Outsource vs. in-house 4
  • 5.
    Step 3: Trackdown data  How will you get the data you need?  What sources of data exist?  How valid is the data you have?  Accuracy tests  Validity tests 5
  • 6.
    Step 4: Implementation Outsource? In-house?  Who do you need on the team?  Platforms & vendors  Content analysis  Survey research  Web analytics  Social analytics 6
  • 7.
    Step 5: Putyour dashboard to work  Benchmarks  Reporting strategies?  Format?  Timing?  Improve the decision-making process 7
  • 8.
  • 9.
    Sales Target RiskReduction New Market Share Increases Brand Awareness, Reduce Sales Cycle Increase Trust, Reduce Threats Expand the Marketable Universe Bench- mark Current Goal Bench- mark Current Goal Bench- mark Current Goal % increase in share of desirable voice 8.9% 8.9% 10% % decrease in undesirable Share of Conversation 10% 12% 8% % Increase in stakeholder awareness 10% 9% 20% % decrease in share of undesirable voice 3.1% 2.1% <3% % decrease in stakeholders not aware 21% 21% 7% % Increase in online engagement on issue % Increase in in-bound requests for information 10% 5% 15% % increase in awareness 11% 11% 13% % increase in Trust scores 50% 45% 75% 0 100 500 Below Target At Risk On Target 9 Public Affairs Dashboard
  • 10.
    Understanding Relationships BetweenMetrics What worked? What didn’t work? What we will do next: 0 5 10 15 20 25 30 35 40 45 50 0 100 200 300 400 500 600 Jan Feb Mar Apr May June Analyzing the impact of messaging on web traffic and social engagement Sessions (in thousands) Social Engagement 410
  • 11.
    -5 -4 -3 -2 -1 0 1 2 3 4 5 6 Jan Feb MarApr May June % point change since last month Share of desirable voice Share of undesirable voice Unique visits to Website Engagement Index Overview of Dashboards Corporate Reputation -5 0 5 10 Jan Feb Mar Apr May June % point change since last month Share of desirable voice in biologics Visits to UnderstandingBiologics.com Share of desriable HepC voice Share of undersirable voice in HepC Visits to HepCInfo.com Perception of AbbVie as HepC leader -6 -4 -2 0 2 4 6 Jan Feb Mar Apr May June % point change since last month Desirable Oncology SOV Innovative positioning in media Visits to abbvie.comresearch-innovation Innovation social engagement index Perception of AbbVIe as Oncology leader -6 -4 -2 0 2 4 6 Jan Feb Mar Apr May June % point change since last quarter Ratings on trust Employee knowledge of "Way We Work" Understanding of Strategic Objectives Reduction in Say/Do gap Culture MetricsSupporting the Business with Messaging & Positioning Disease Awareness/Patient Support/Engagement 11
  • 12.
    Brand Metrics KPI Lastmonth/period This period Difference Share of Desirable Voice 10% 12%  2pts Share of Undesirable Voice 5% 2%  2pts % increase in Unique Visits 100k 137K 2% Engagement Index 1357 2568 2% What worked? What didn’t work? What we will do next: -5 0 5 10 Jan Feb Mar Apr May June % point change since last month Share of desirable voice Share of undesirable voice Unique visits to Website Engagement Index 12
  • 13.
    Culture Metrics KPI Lastquarter This Period Difference % increase in ratings on communications trustworthiness 3% 5% 2pts % increase in employee knowledge of “Way we work” 12% 14% 2pts % employees strongly understanding strategic objectives 2% 8% 25% % reduction in Say/Do gap on agility metrics 50% 48% 2pts What worked? What didn’t work? What we will do next: -4 -3 -2 -1 0 1 2 3 4 5 Q1 Q2 Q3 Q4 % change since last period % increase in ratings on communiations trustworthiness 13
  • 14.
  • 15.
  • 16.
    Suggested calculation of“value” (to be validated by actual sales and marketing numbers)  100 reps contact physicians and these contacts produce on average 100 scripts/month or 12,000 scripts/year.  85% of reps actively engage with communications events.  85% x 12,000 = There are 10,200 scripts that are potentially influenced by communications programs each year.  An average communications event for reps costs $10,000 and Communications does 50 programs a year. So, assuming communications programs cost $500,000 annually, the communications contribution cost is per script written is $49/script.  The $49 per script written cost can be compared to the cost of in-office visits @ $300 per script. 16
  • 17.
  • 18.
    Thank you!  Clickhere to explore the newest articles from The Measurement Advisor  Don’t forget: as a paid subscriber you have 24/7 access to all the articles we’ve ever published on TMA’s homepage!  Follow me on Twitter: @queenofmetrics  Follow Paine Publishing on Facebook and LinkedIn 18 18