Download to read offline

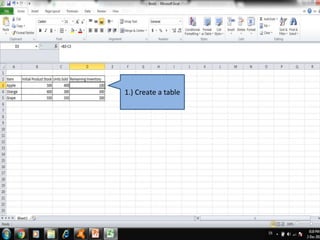
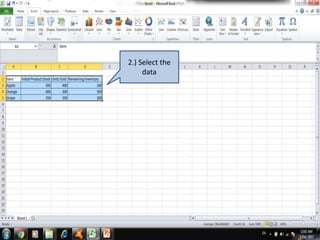
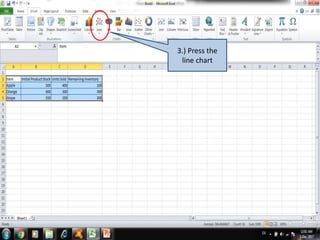
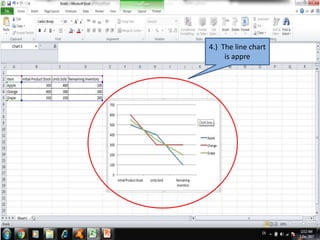
To insert a line chart in Microsoft Excel, create a table with your data and select the cells containing the data. Then, press the line chart button to generate a line chart visualizing the trends in the selected data. The line chart will then appear displaying the relationships between the values over time or categories.


