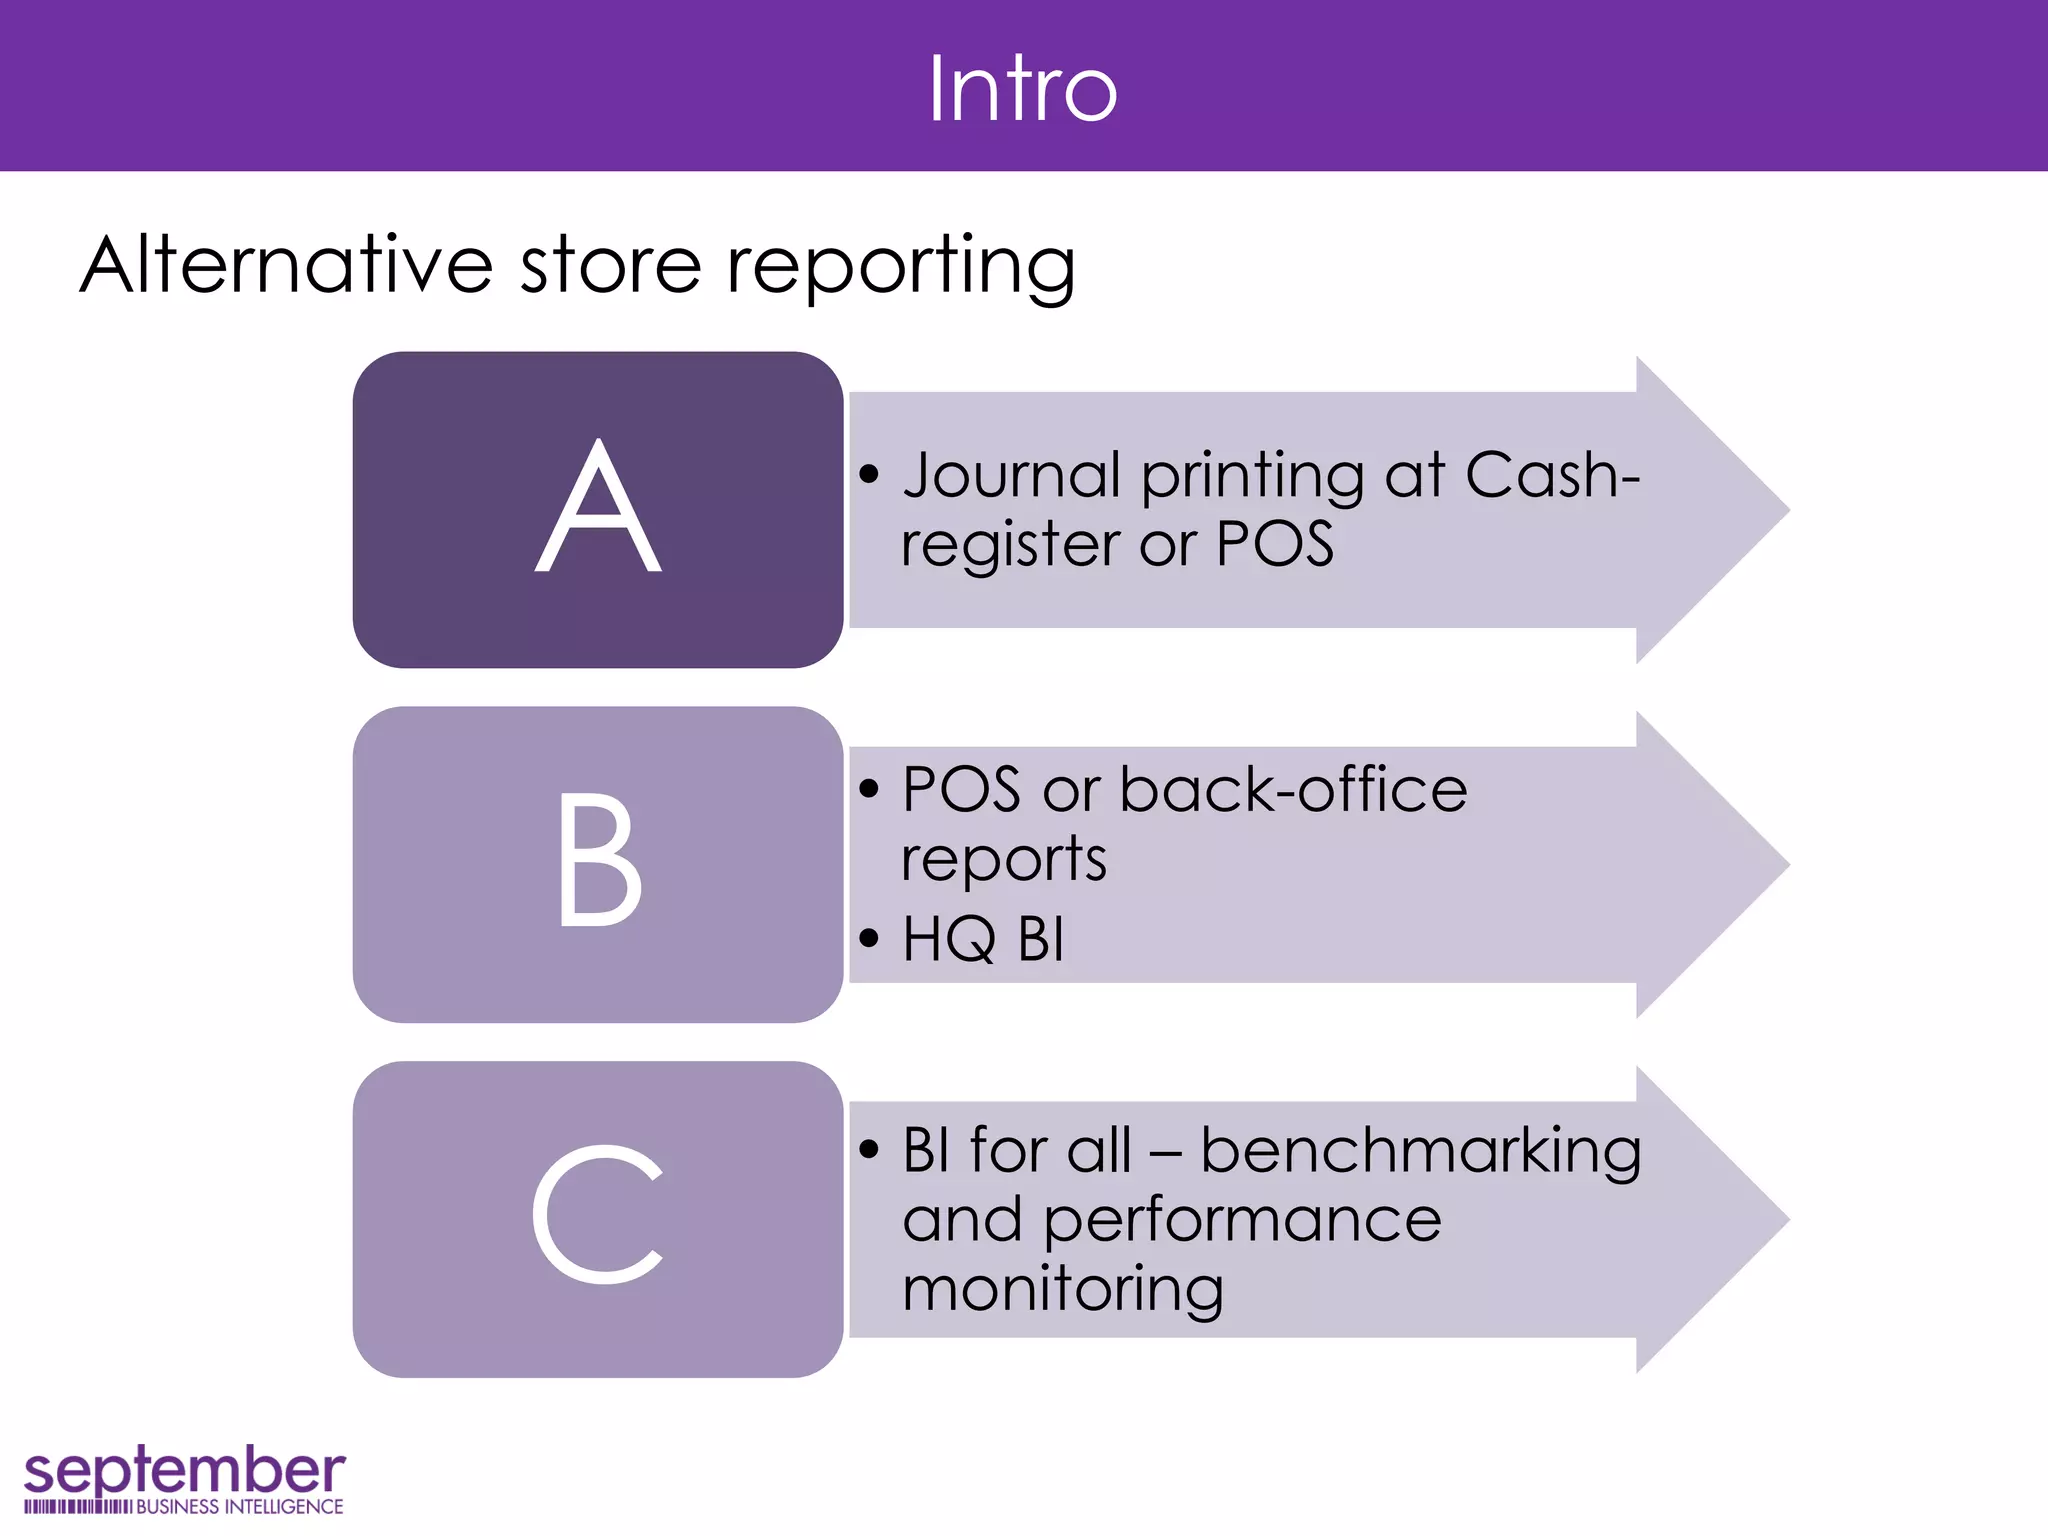
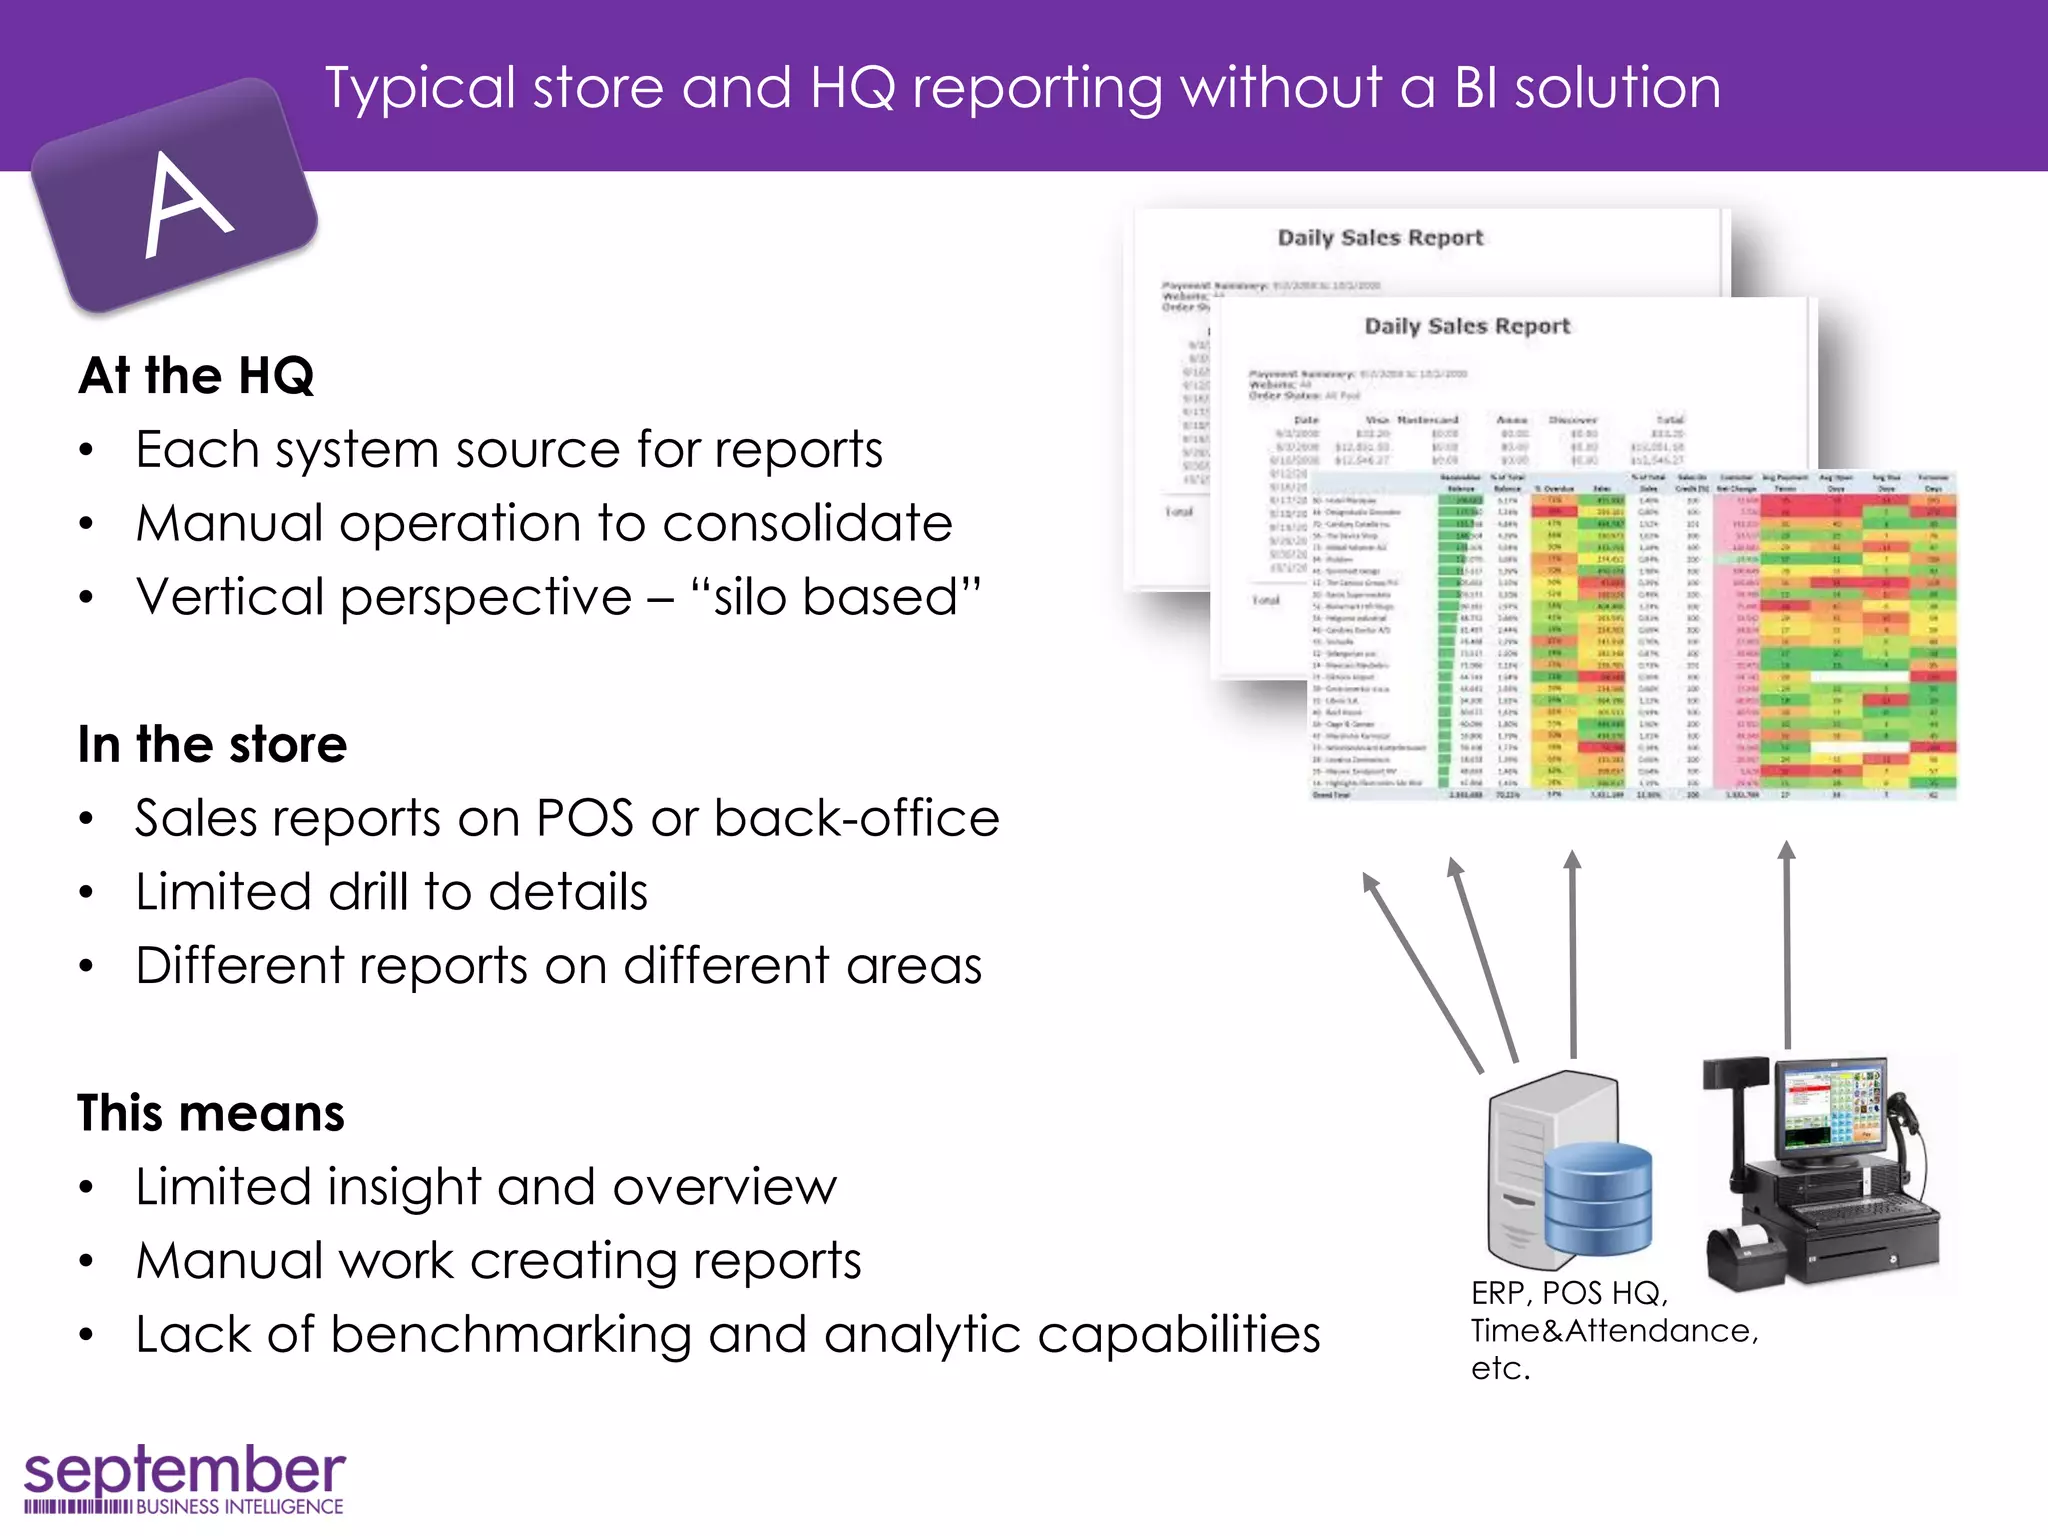
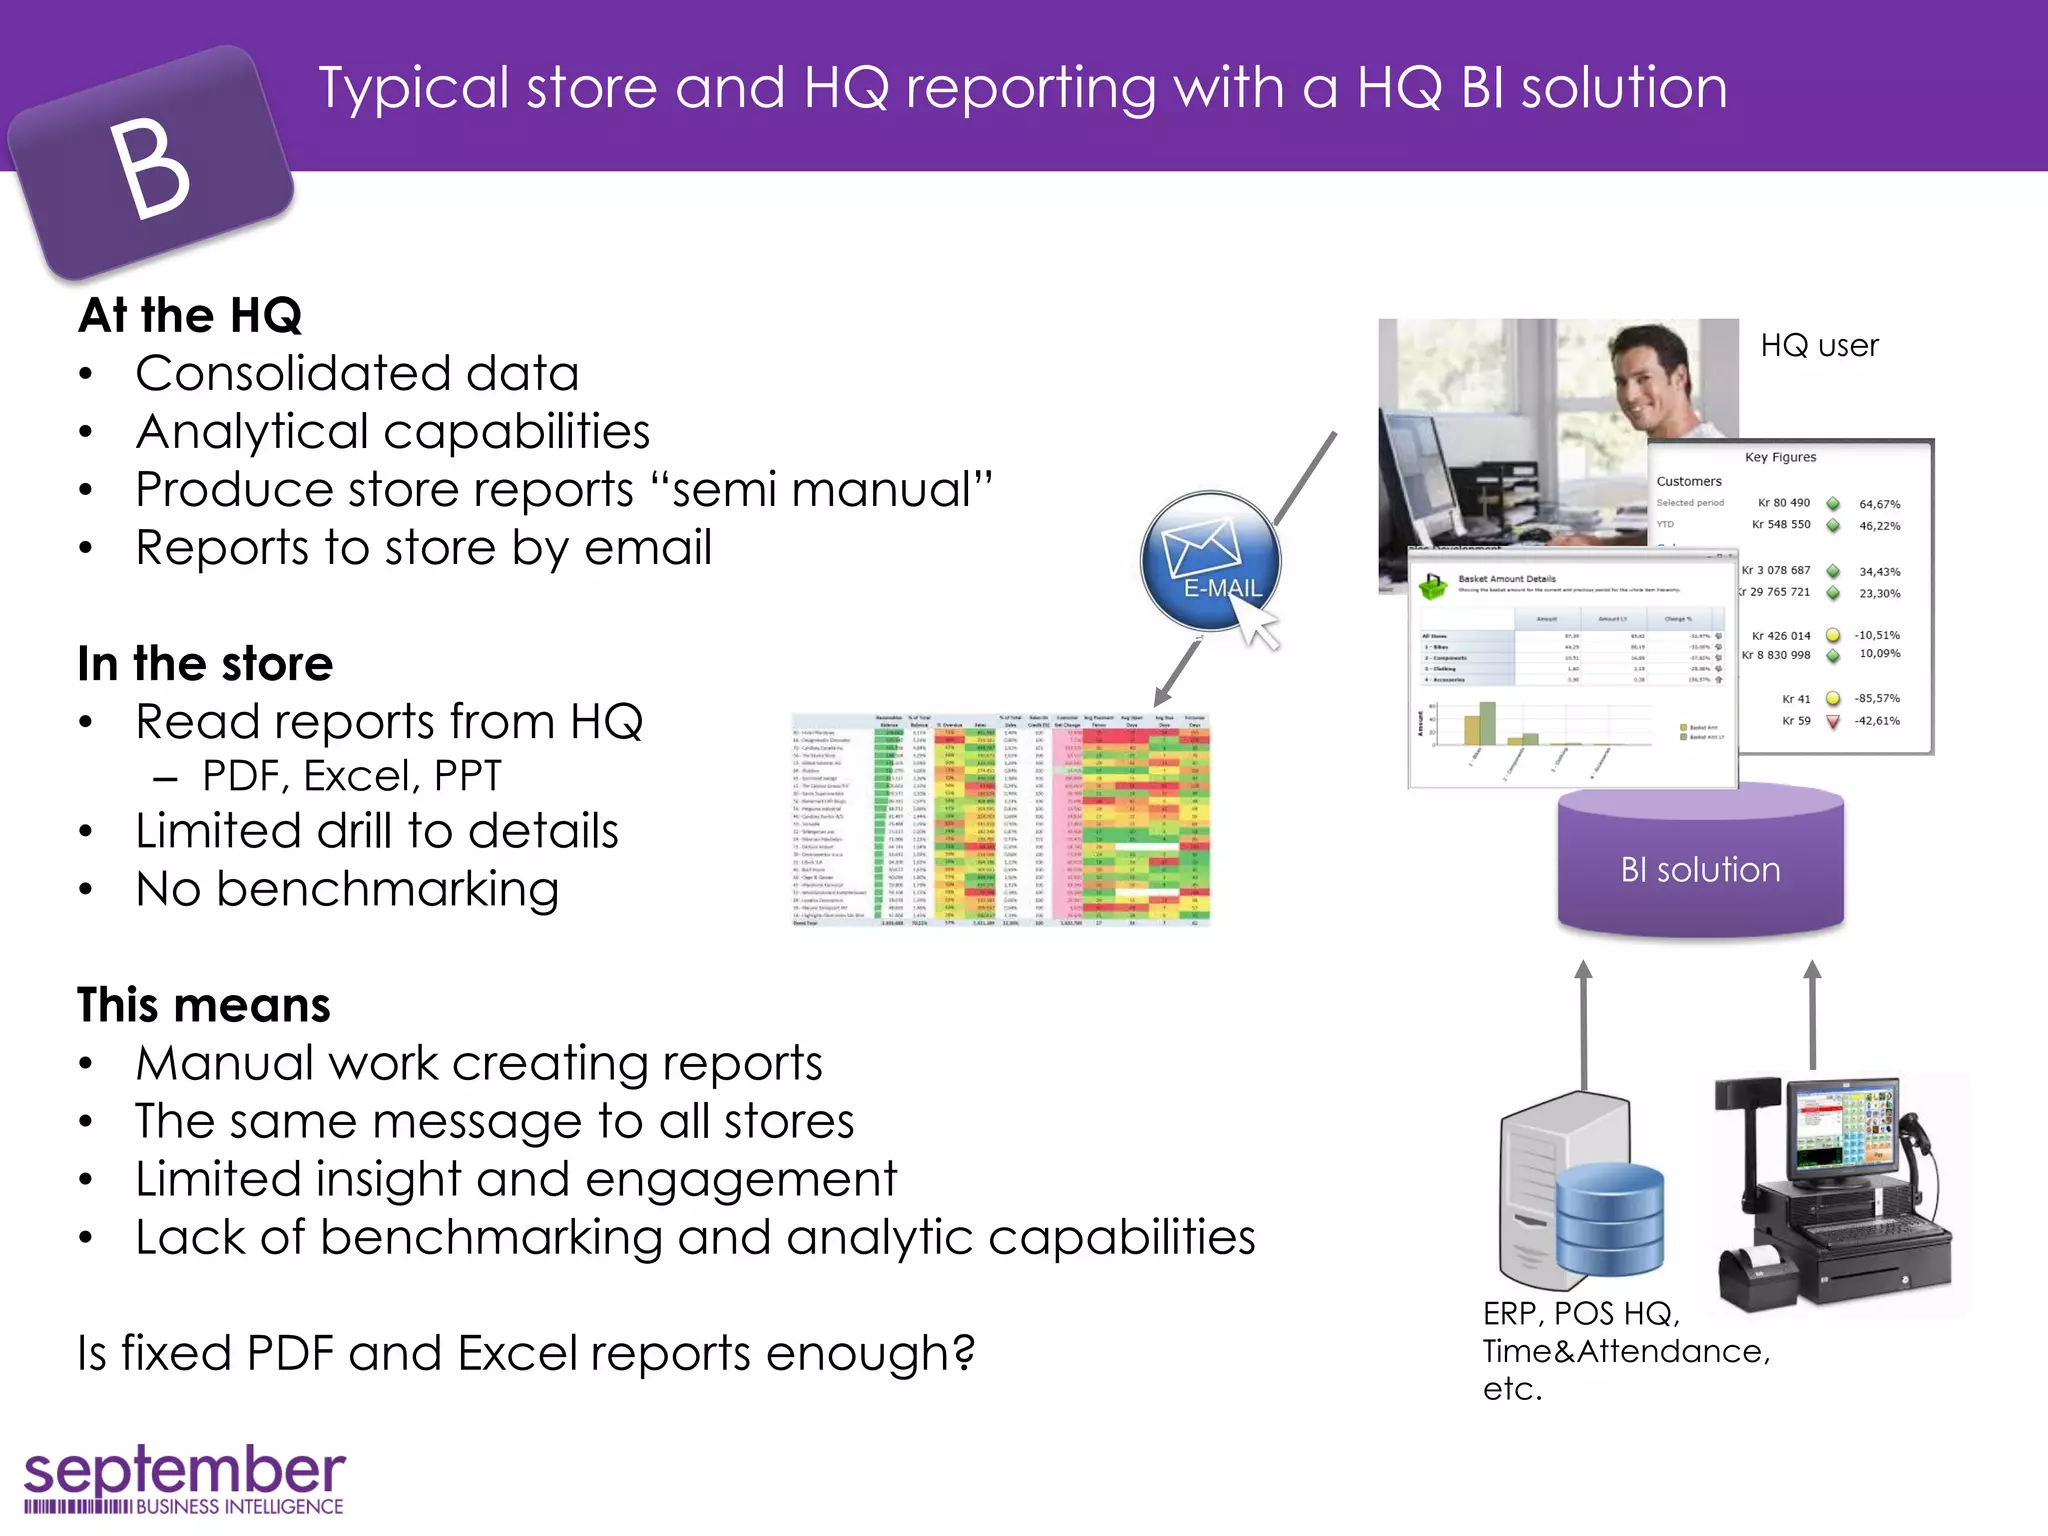
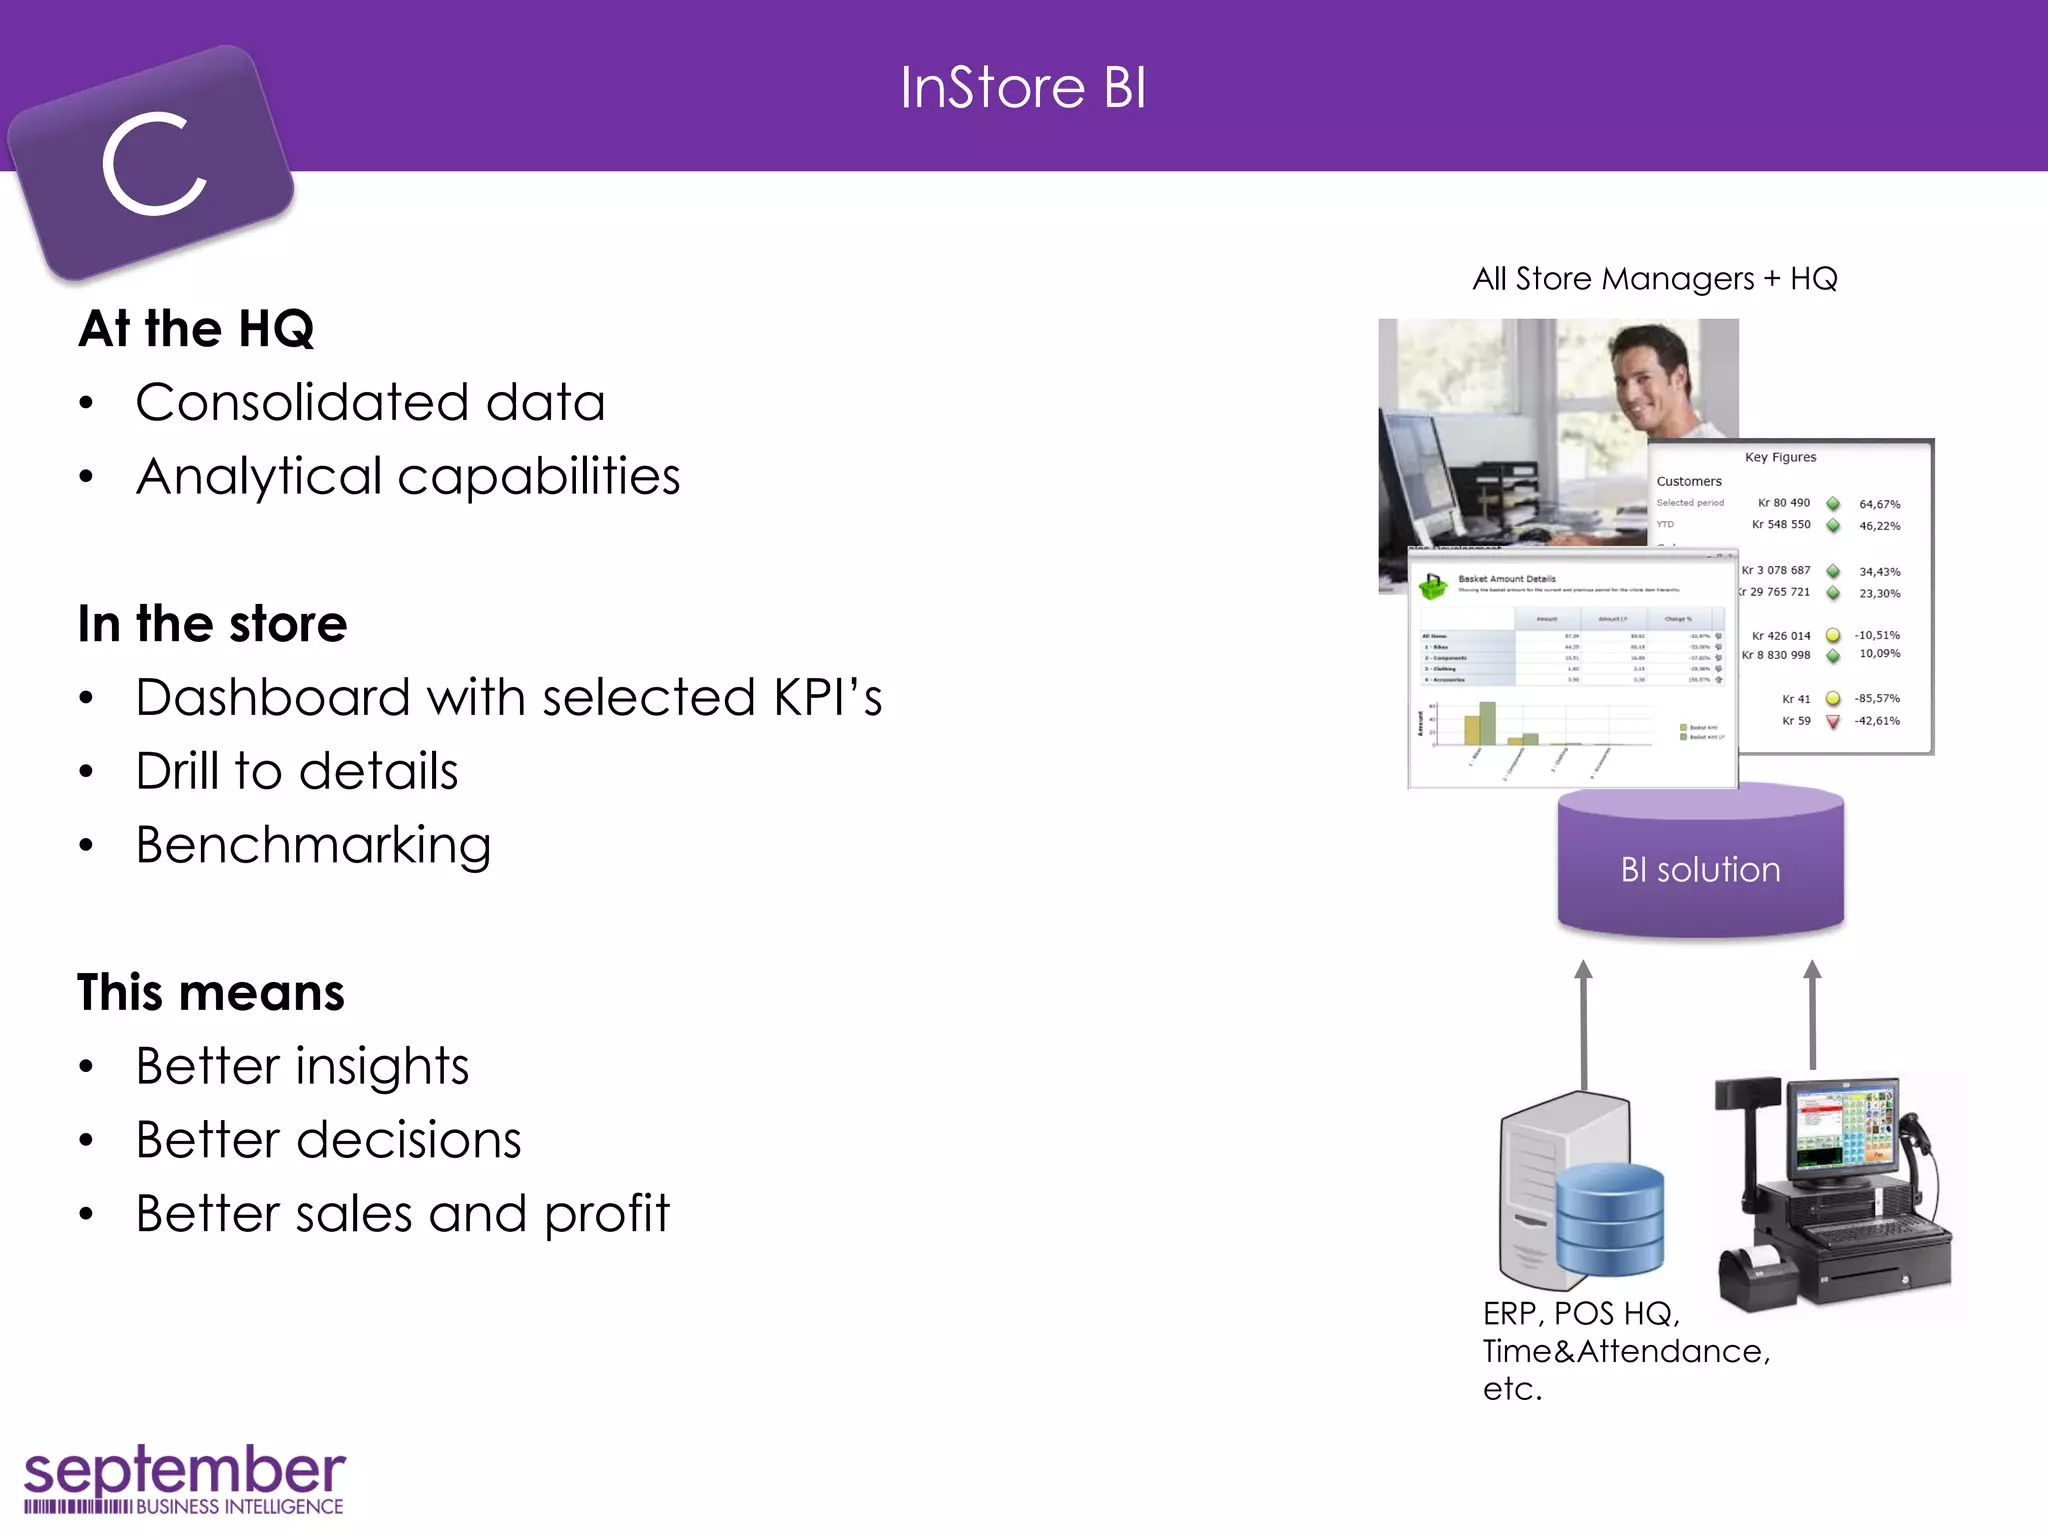
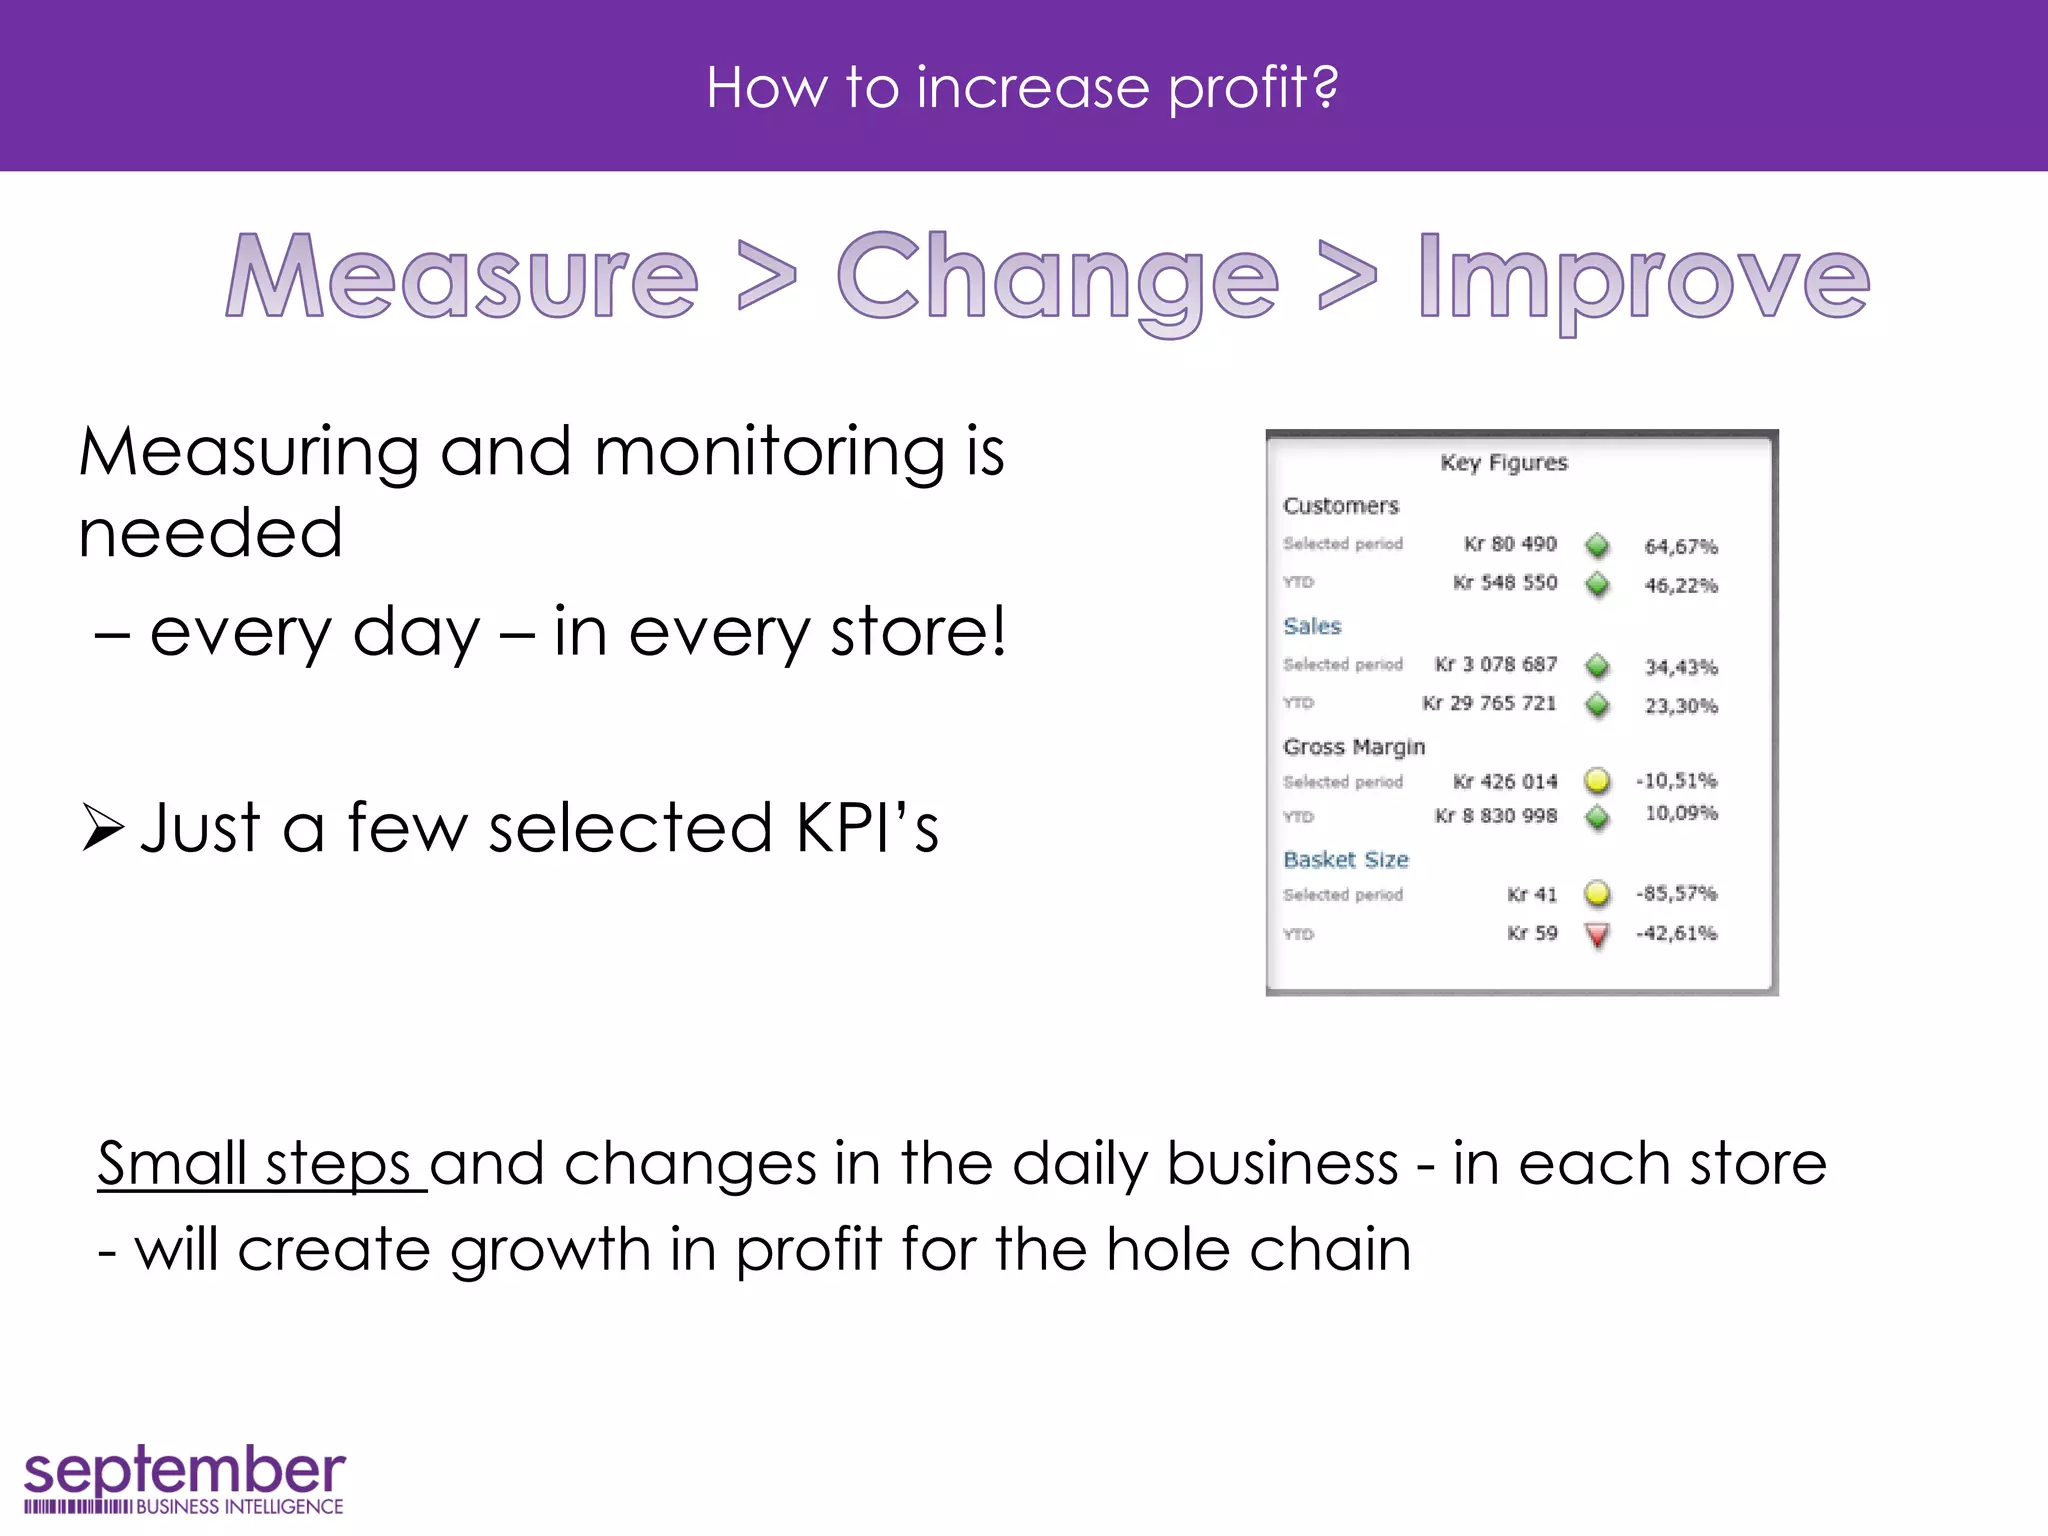
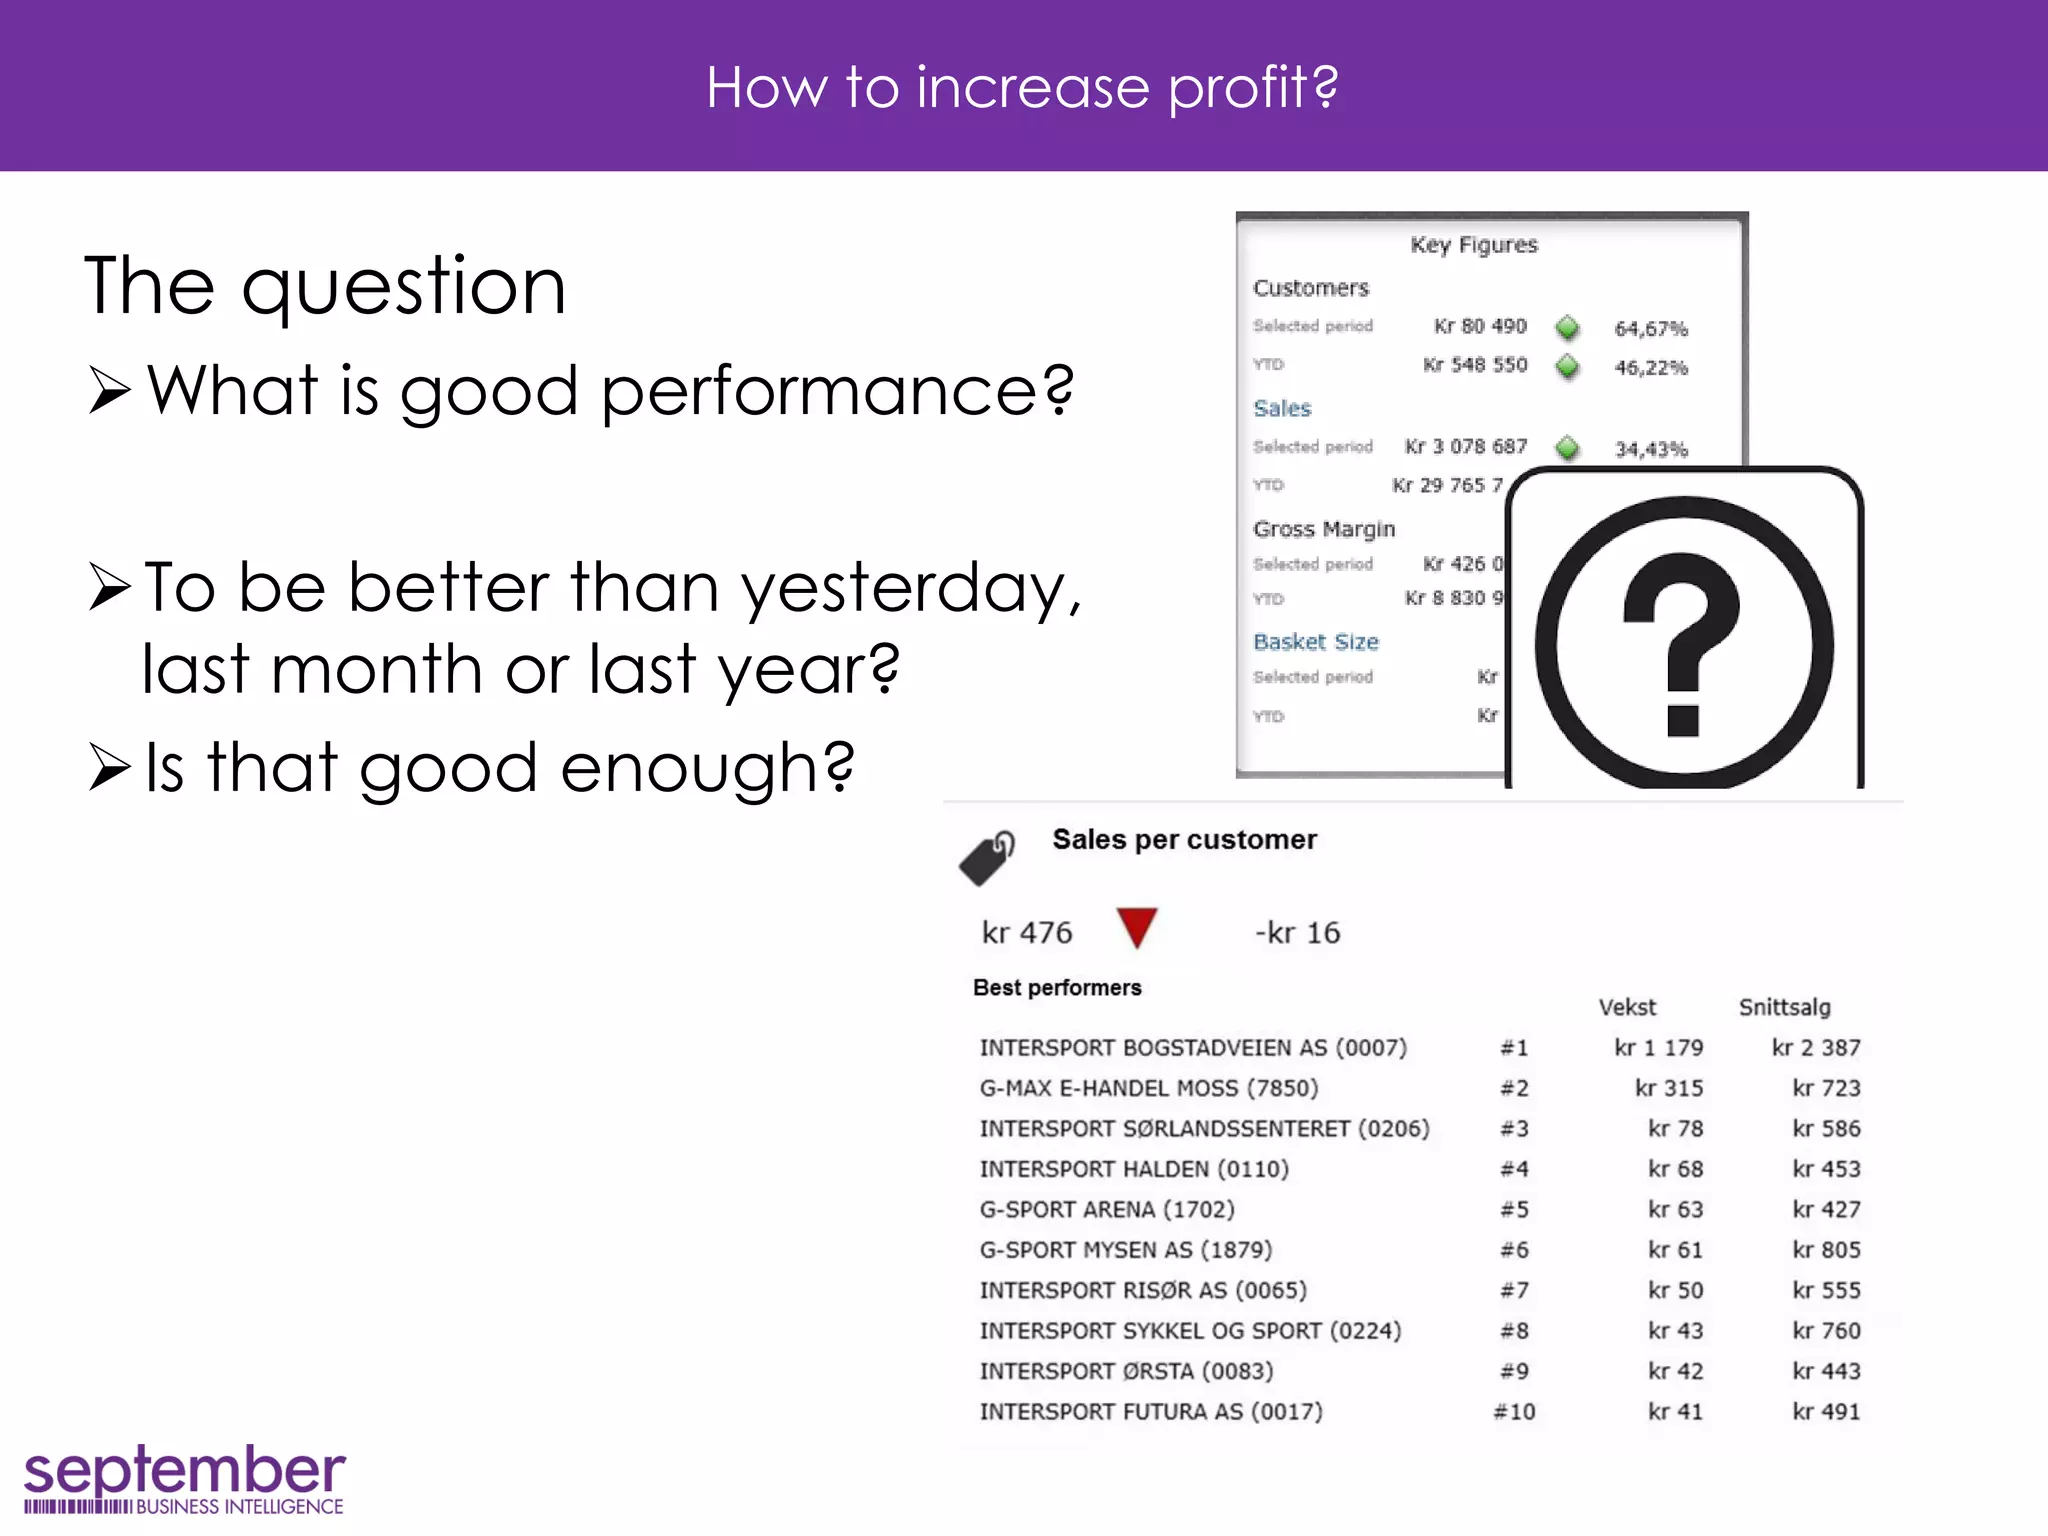
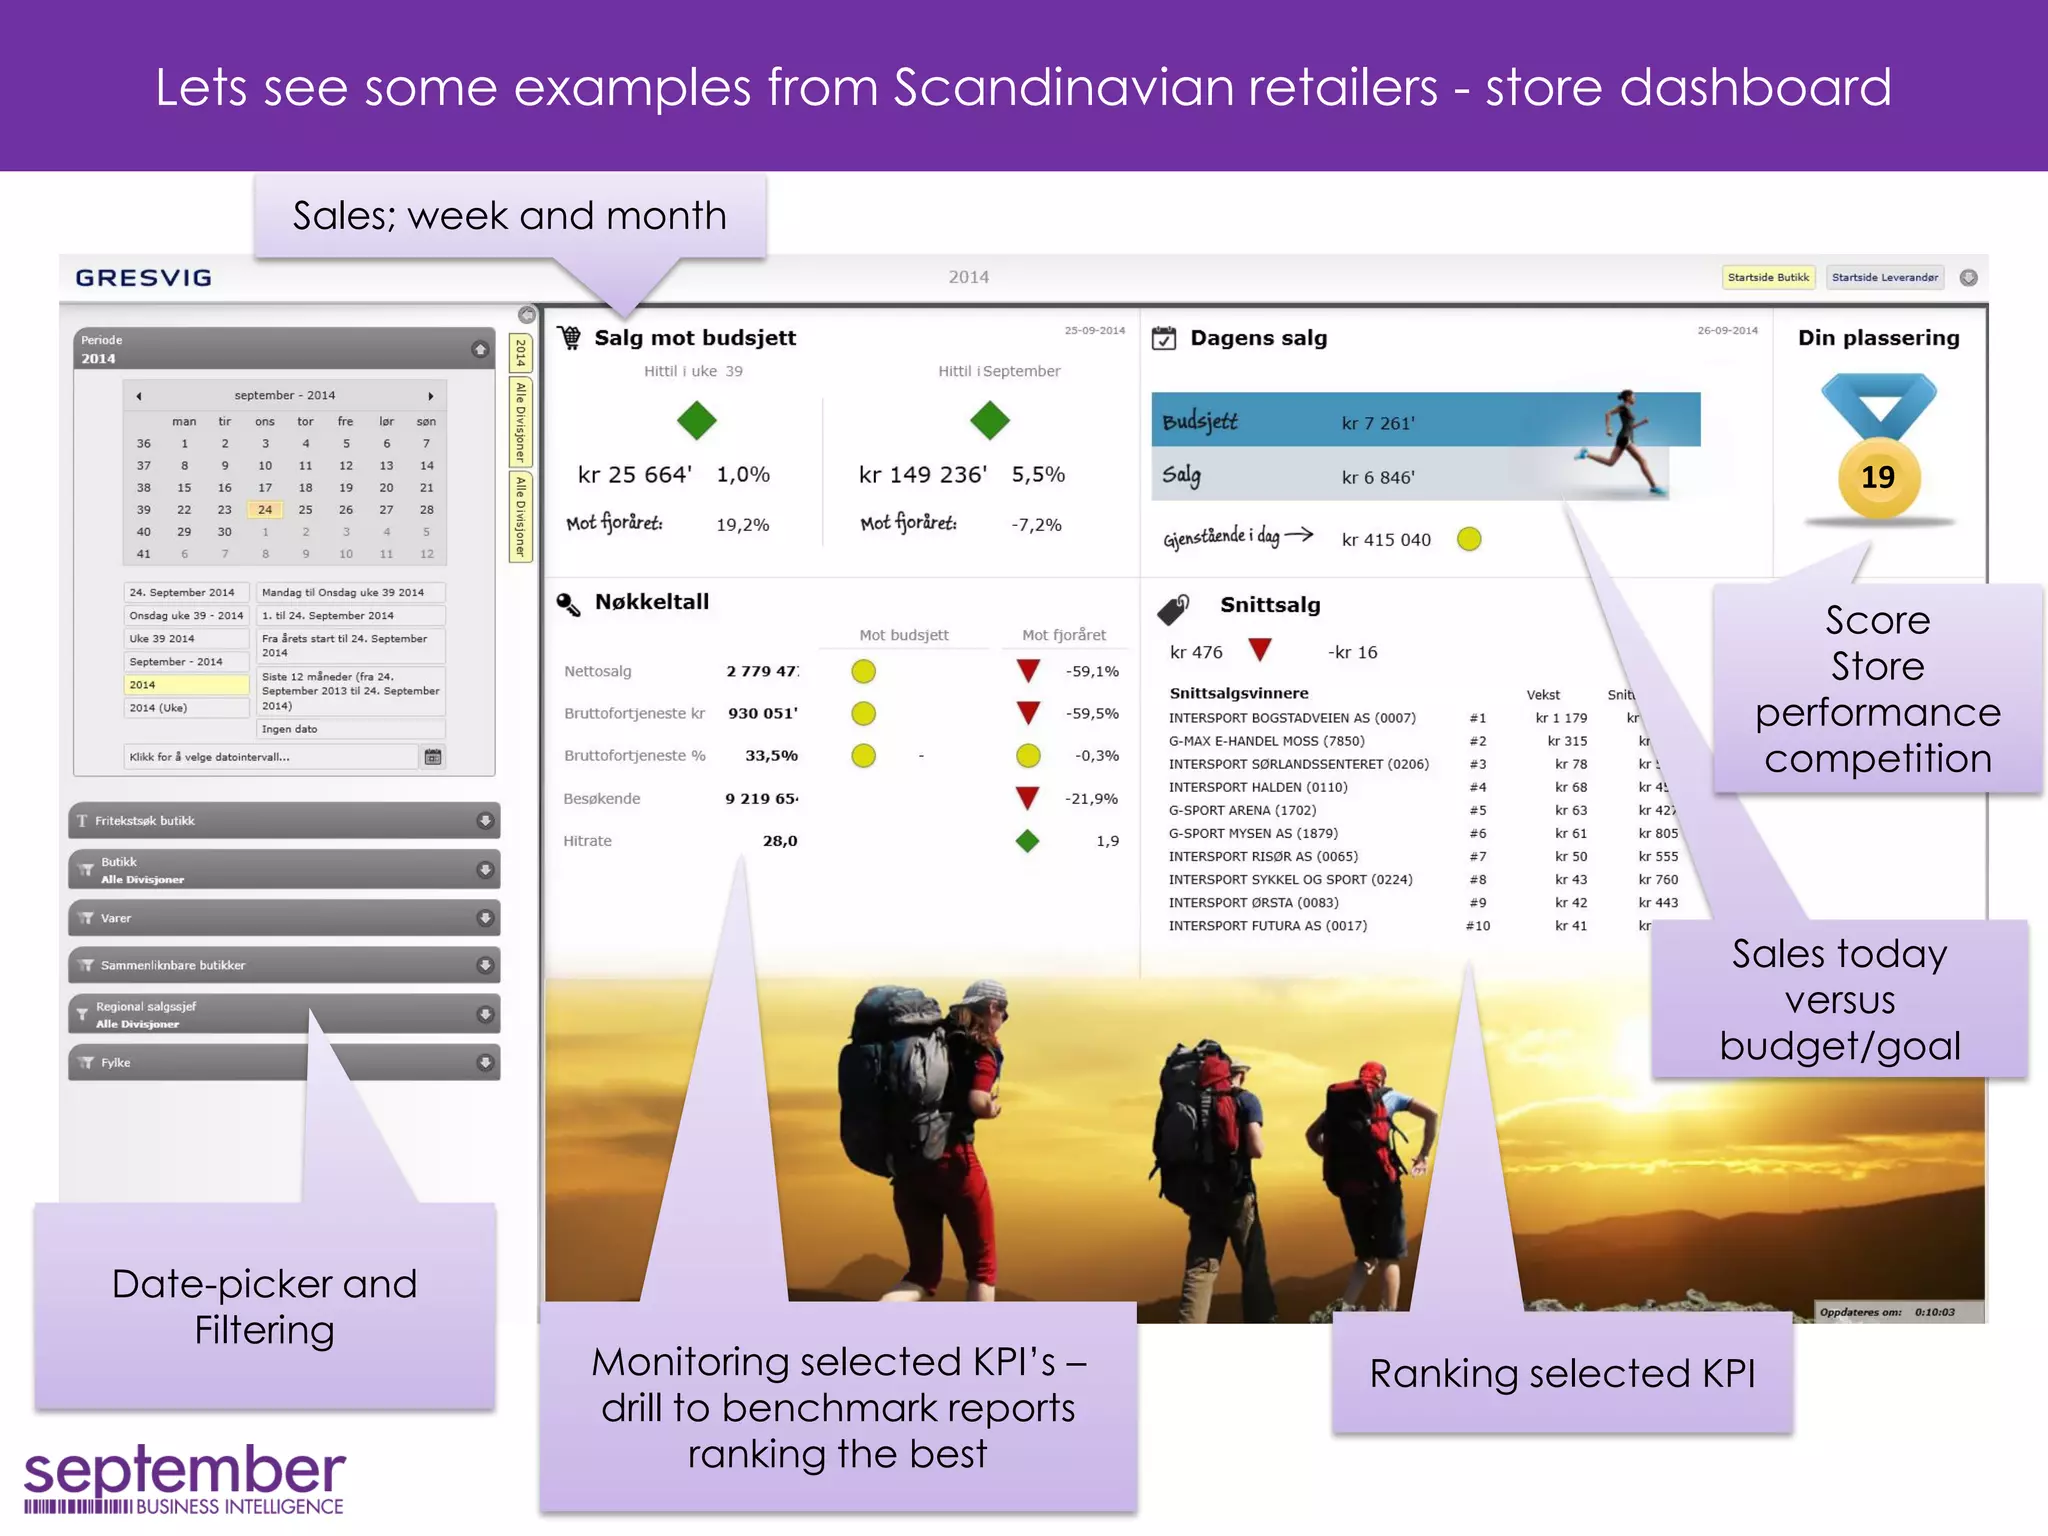
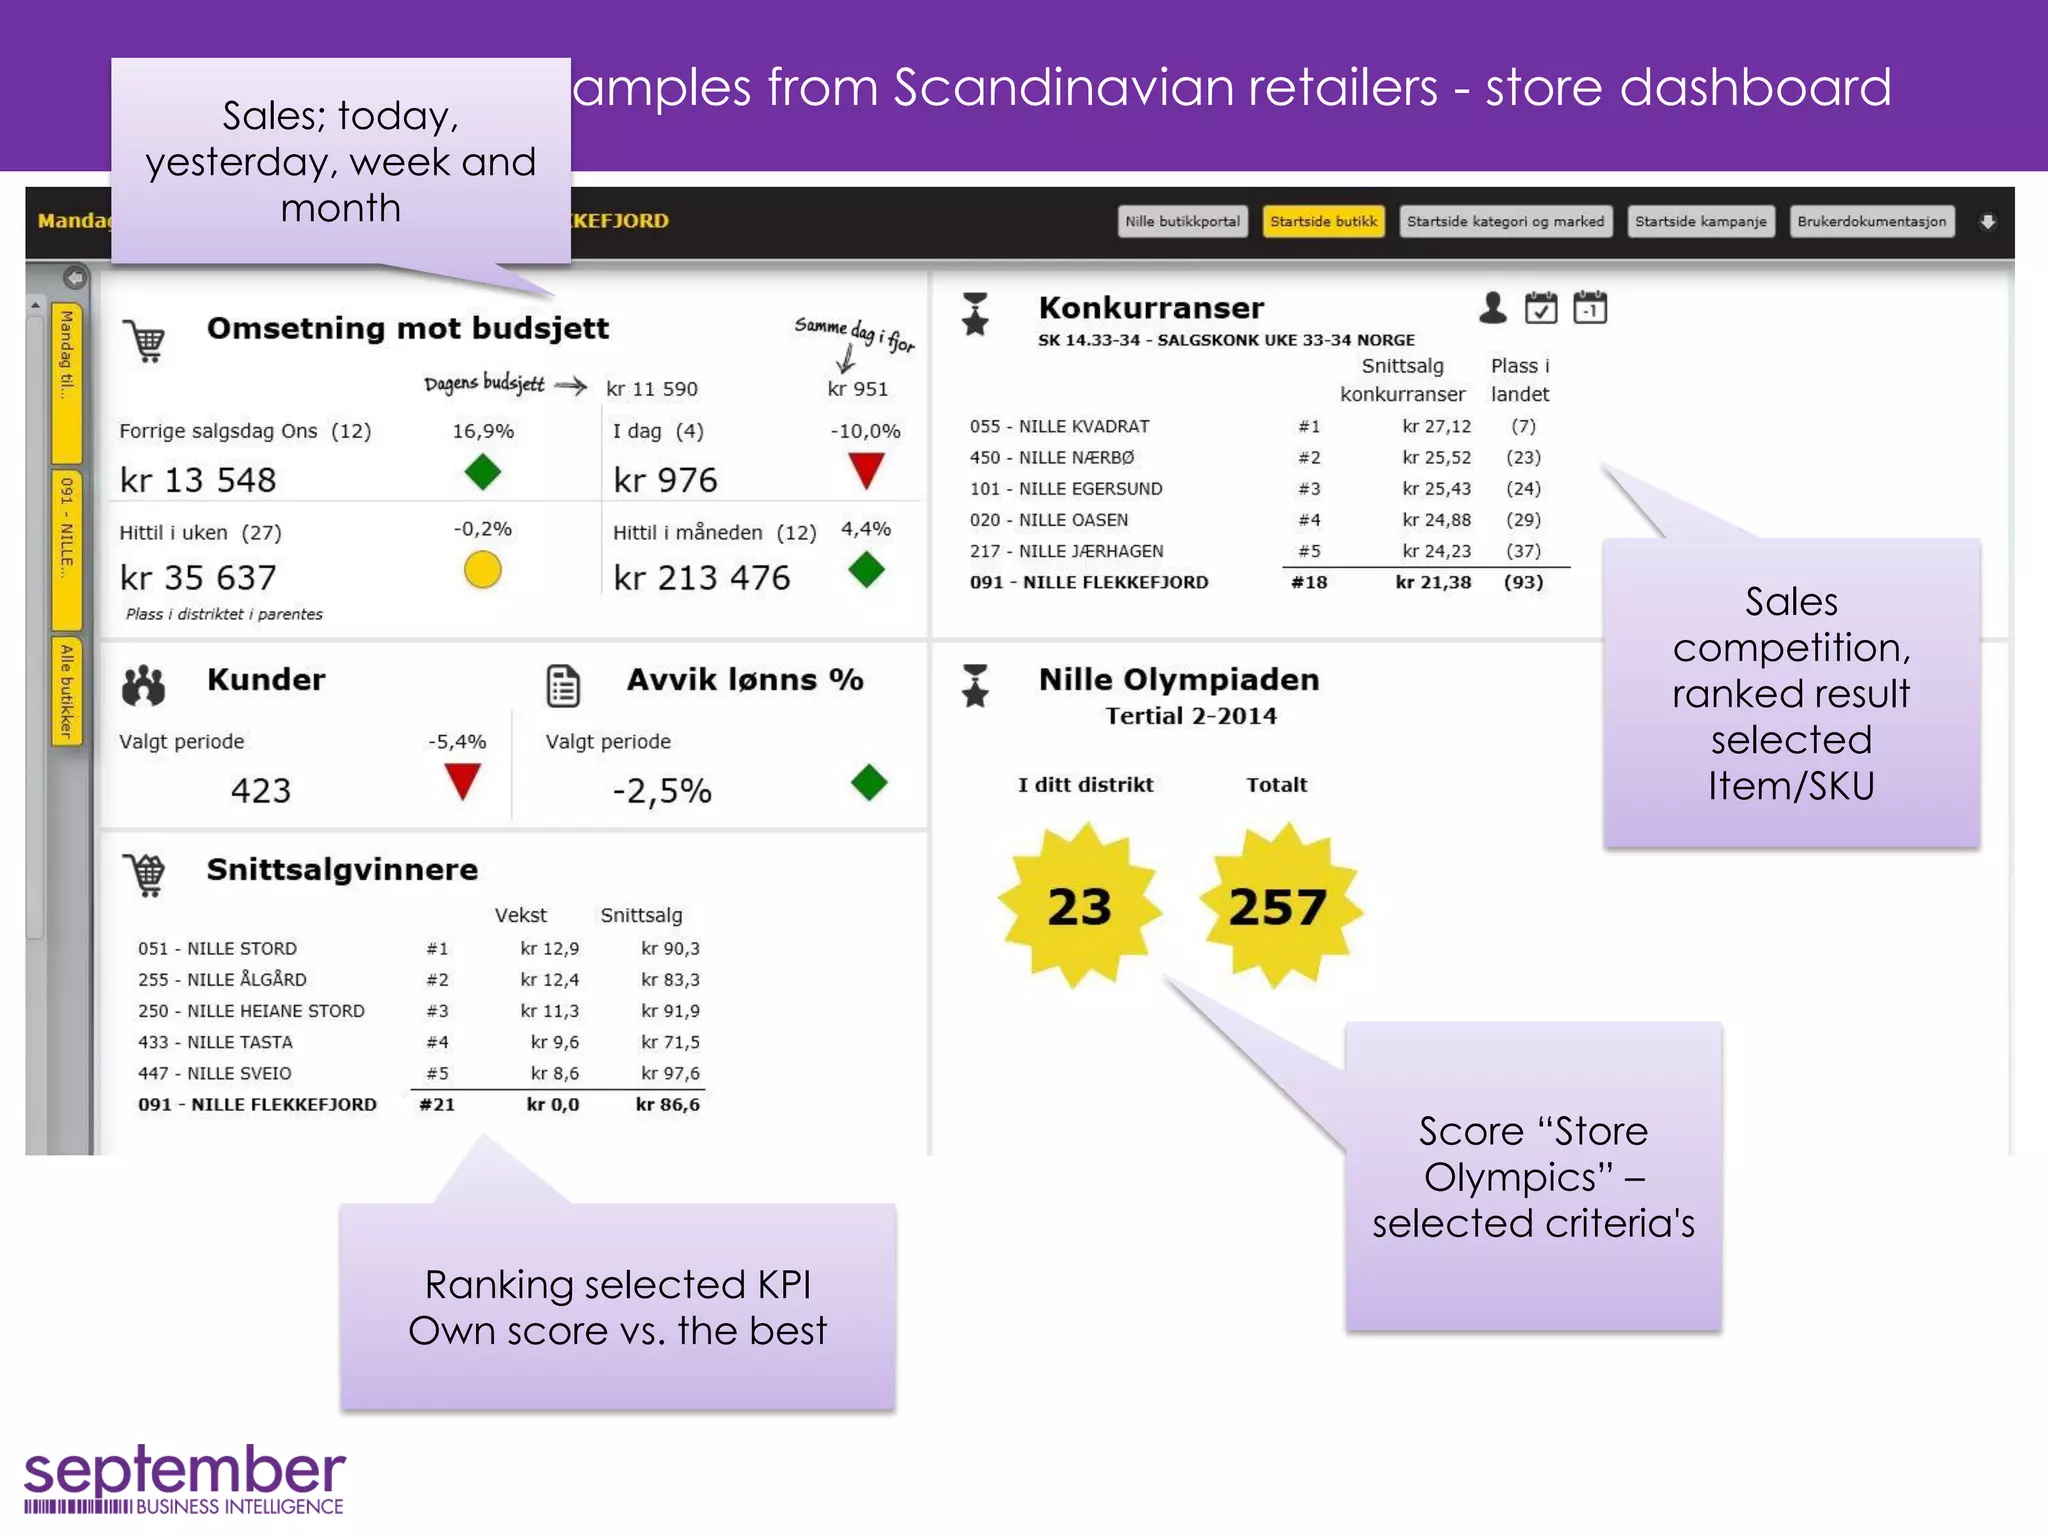
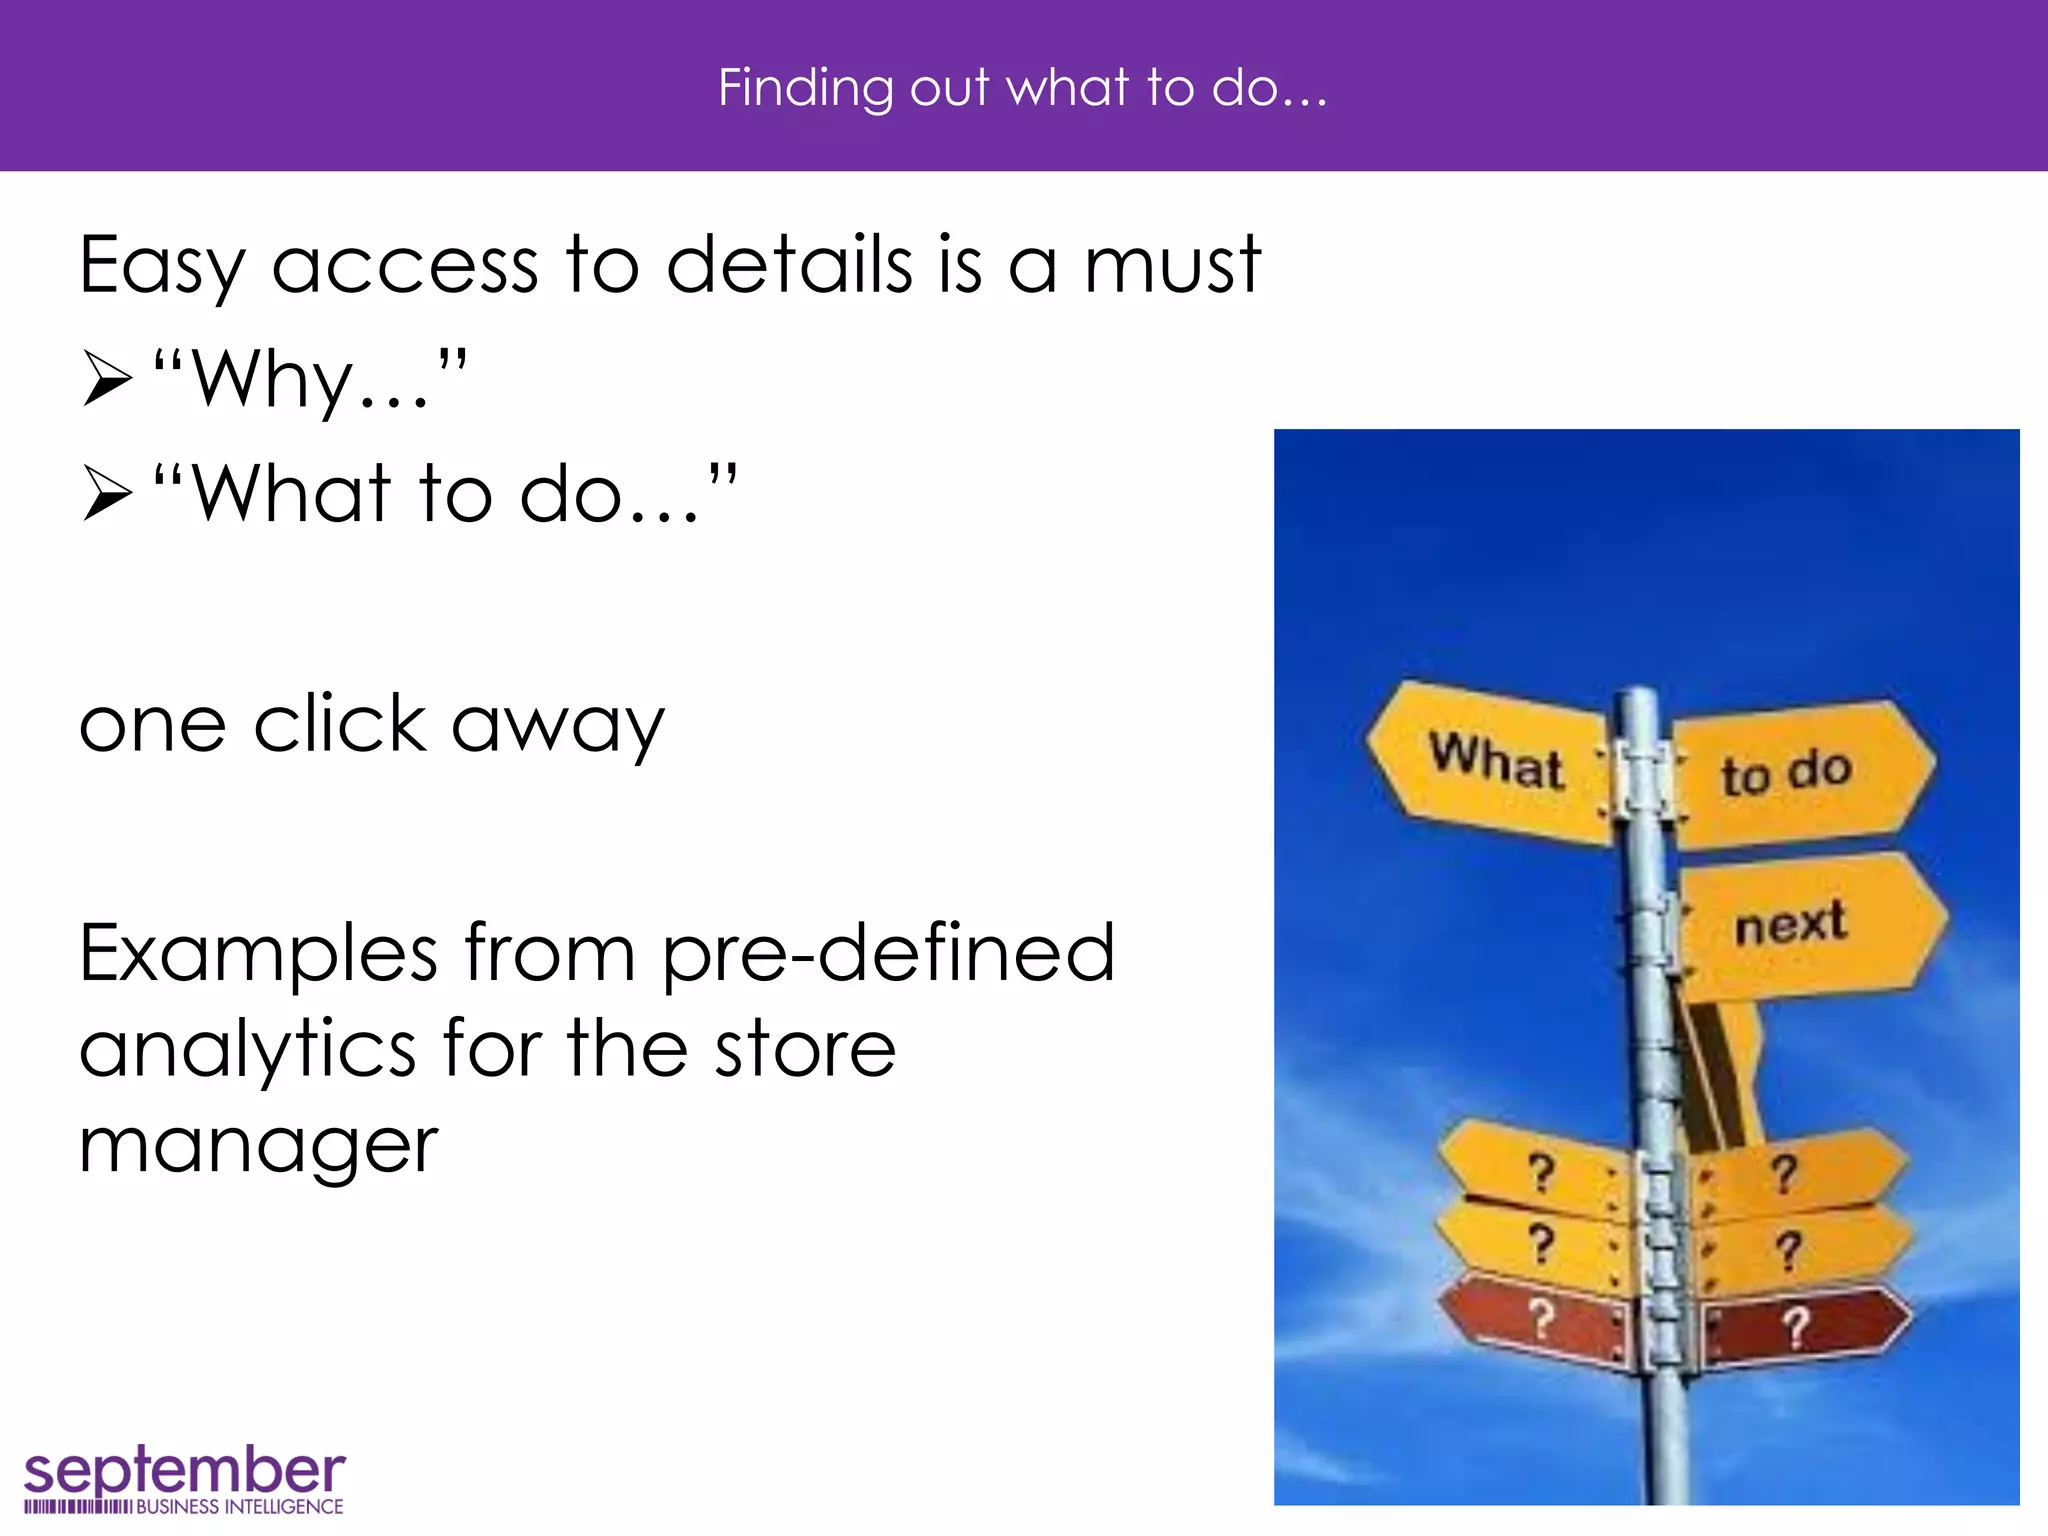
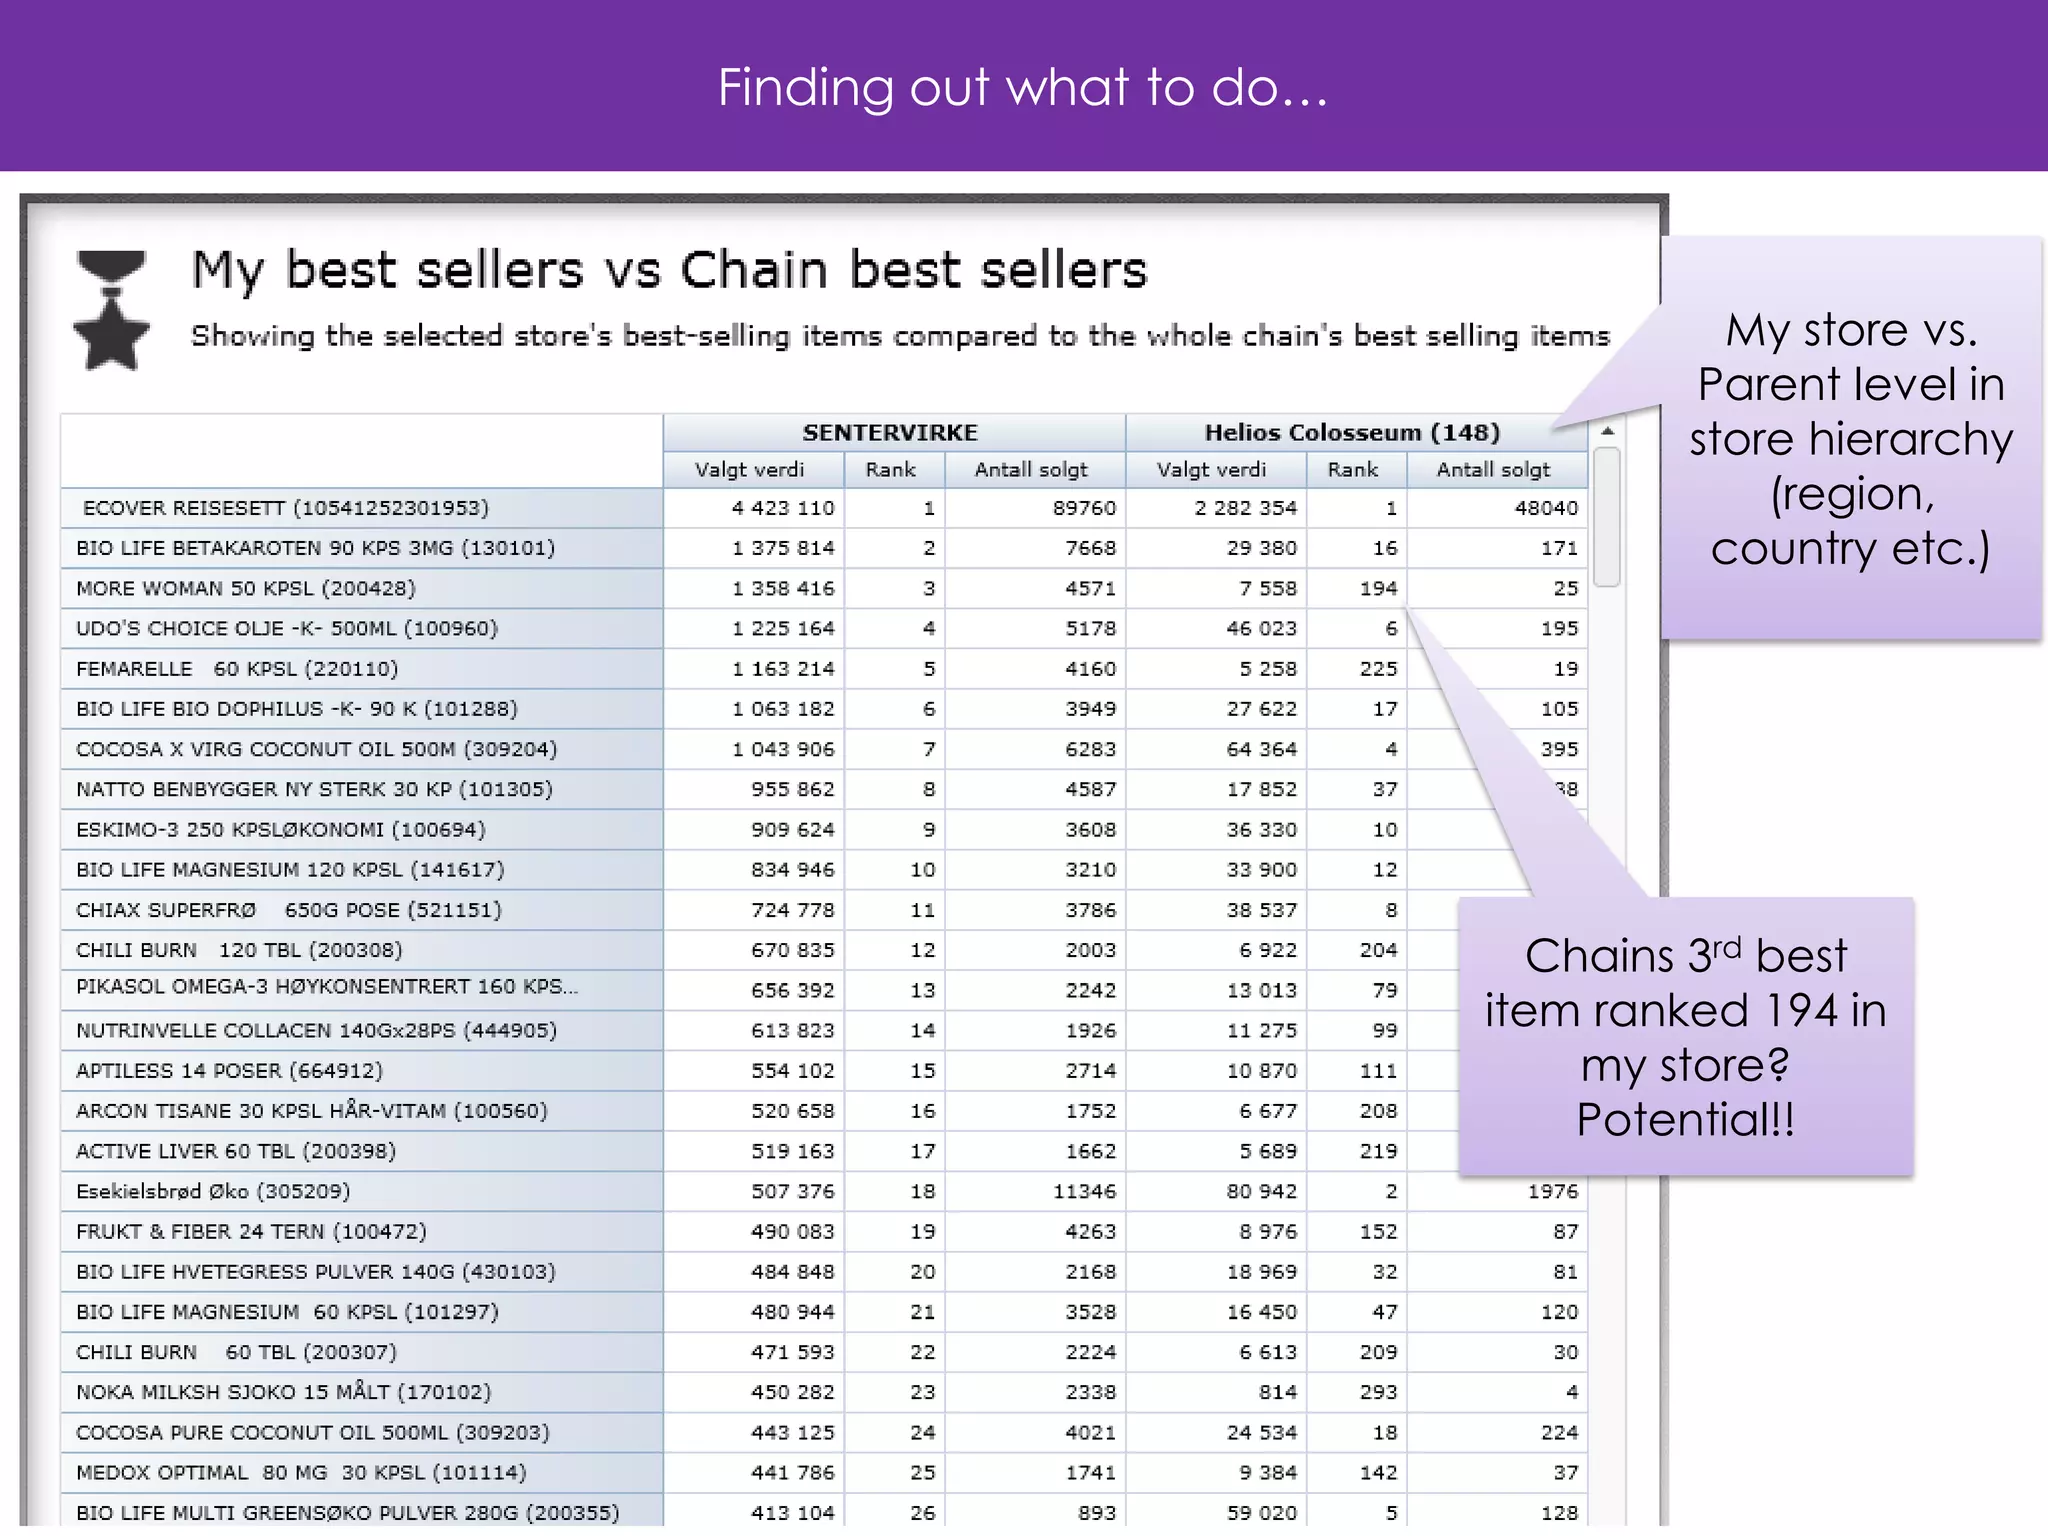
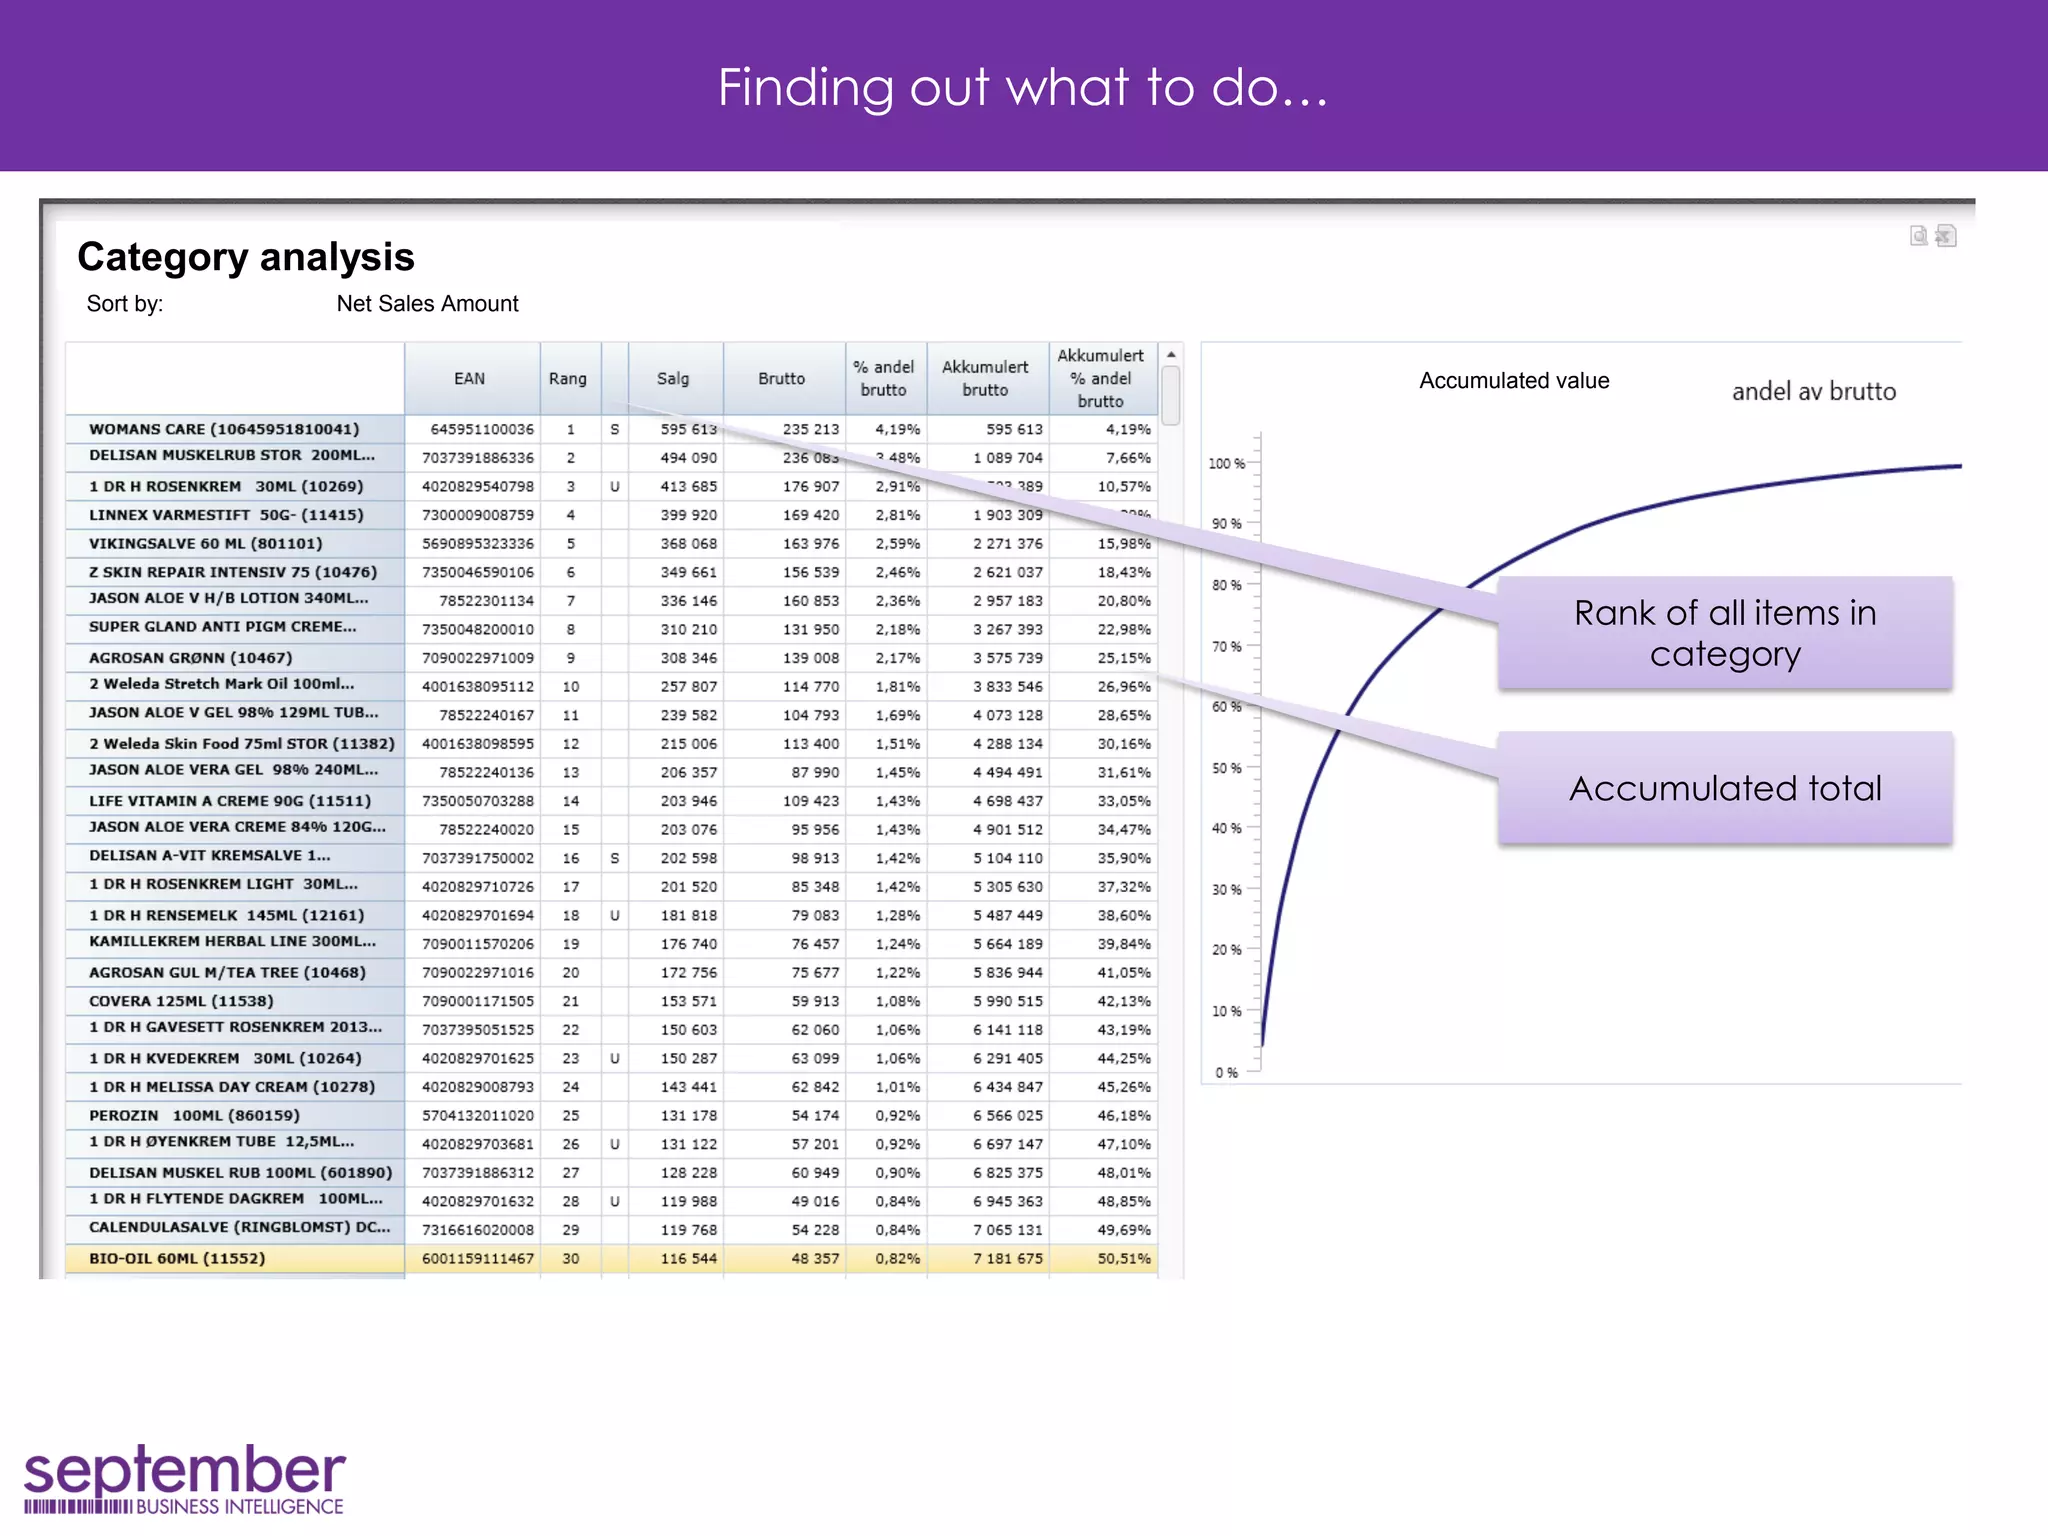
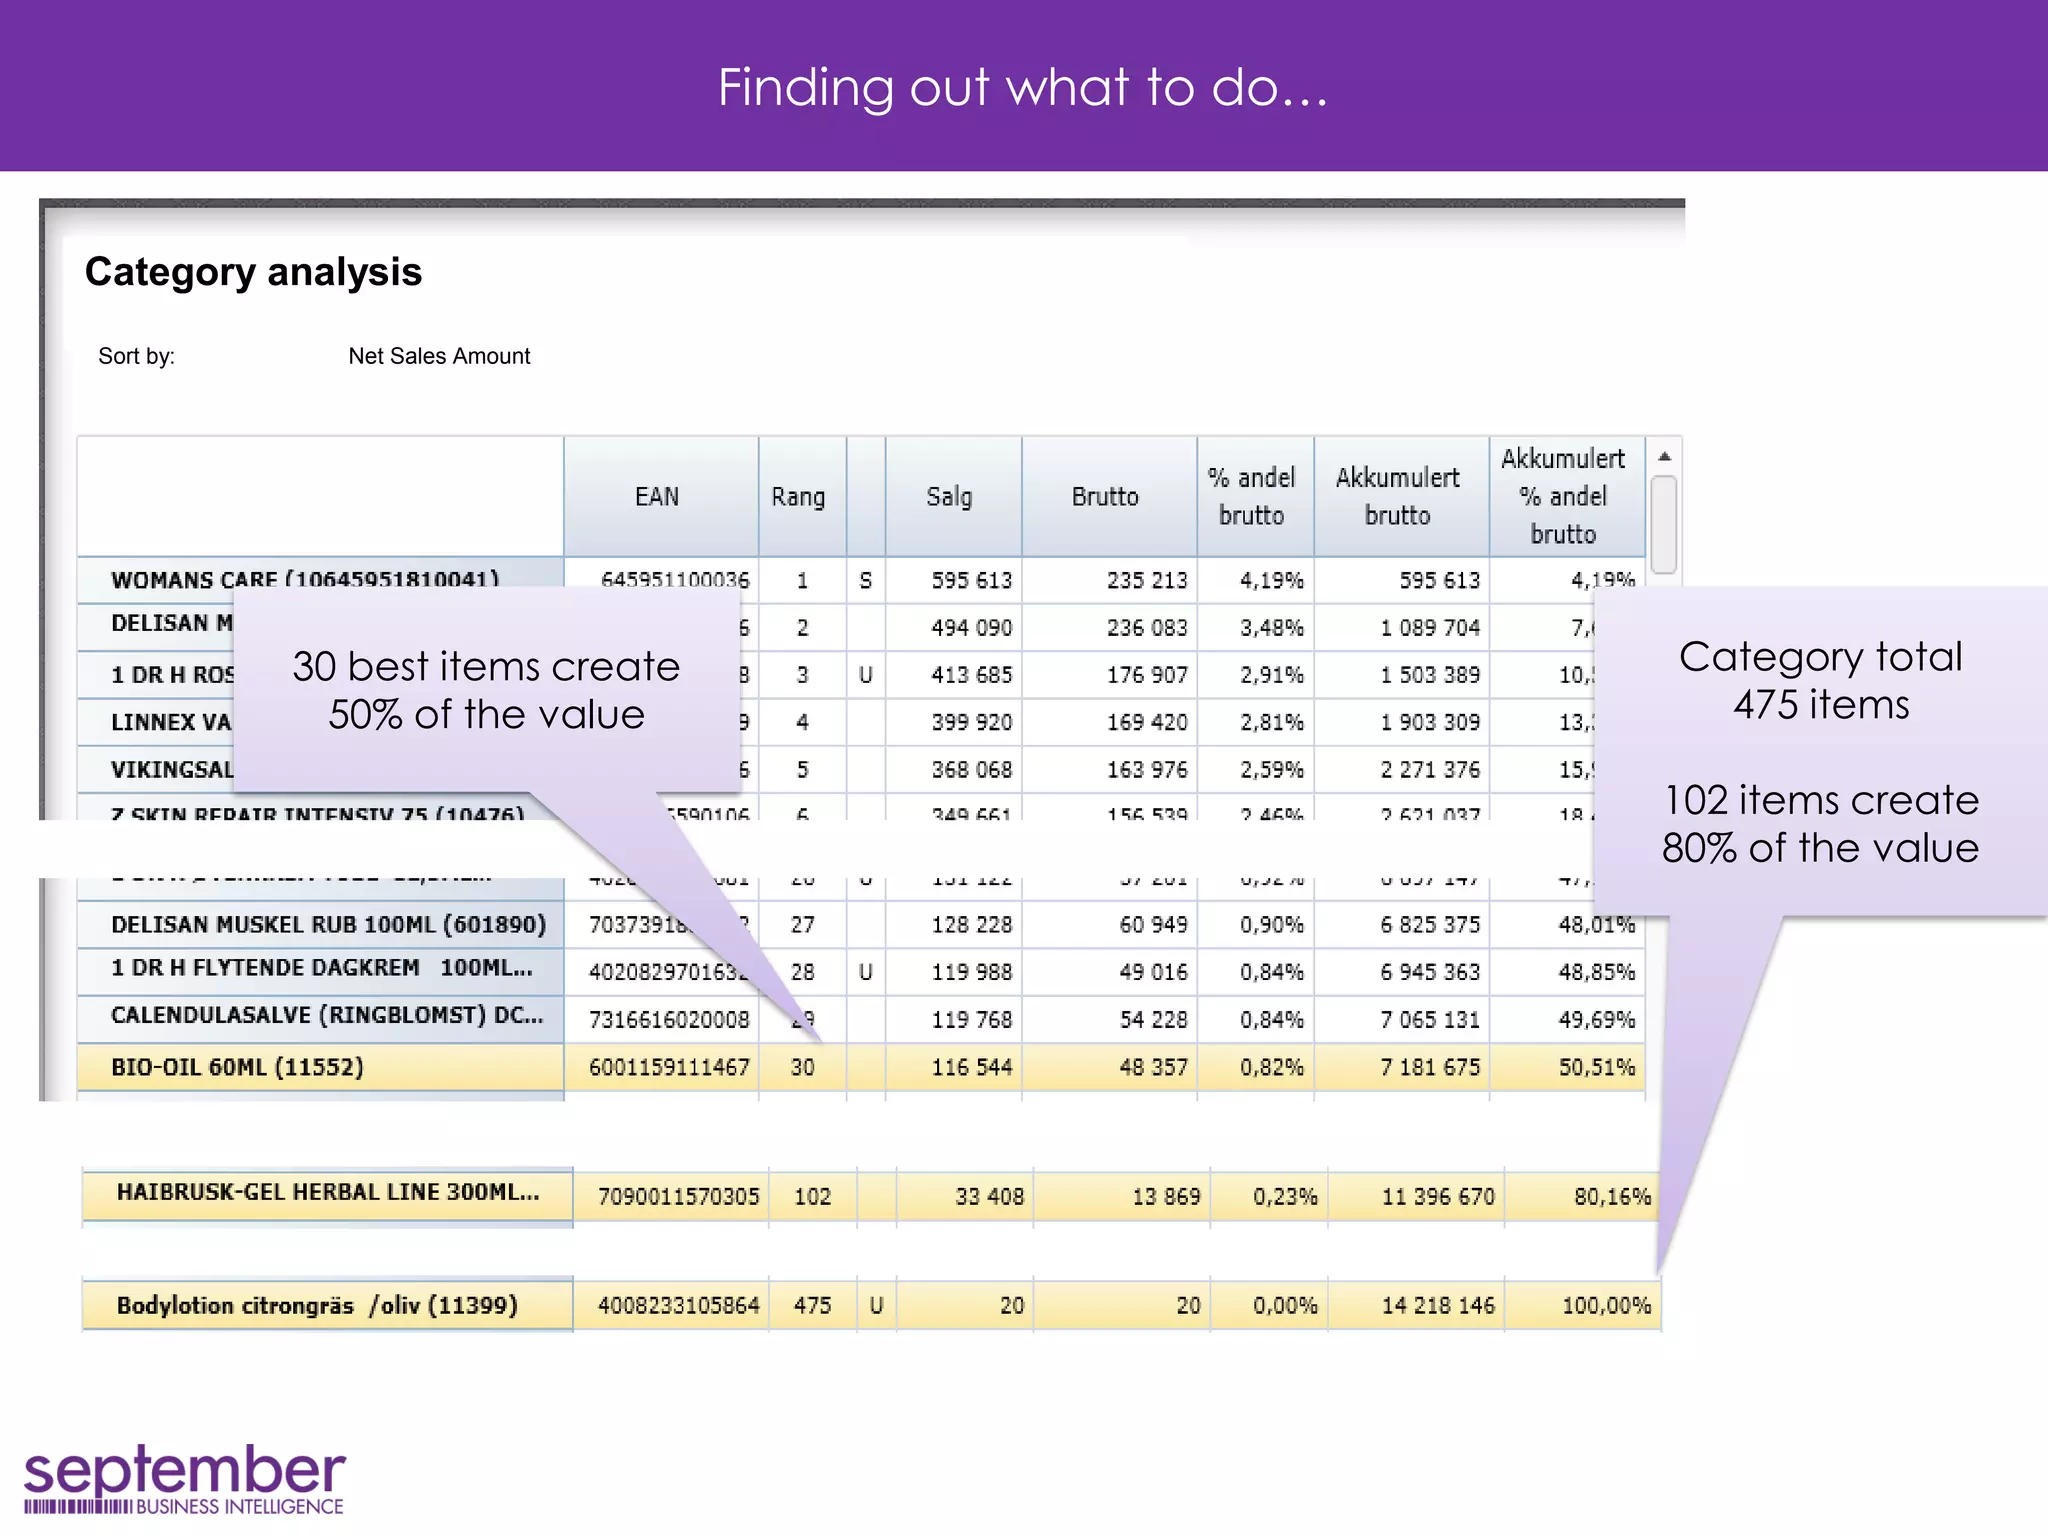
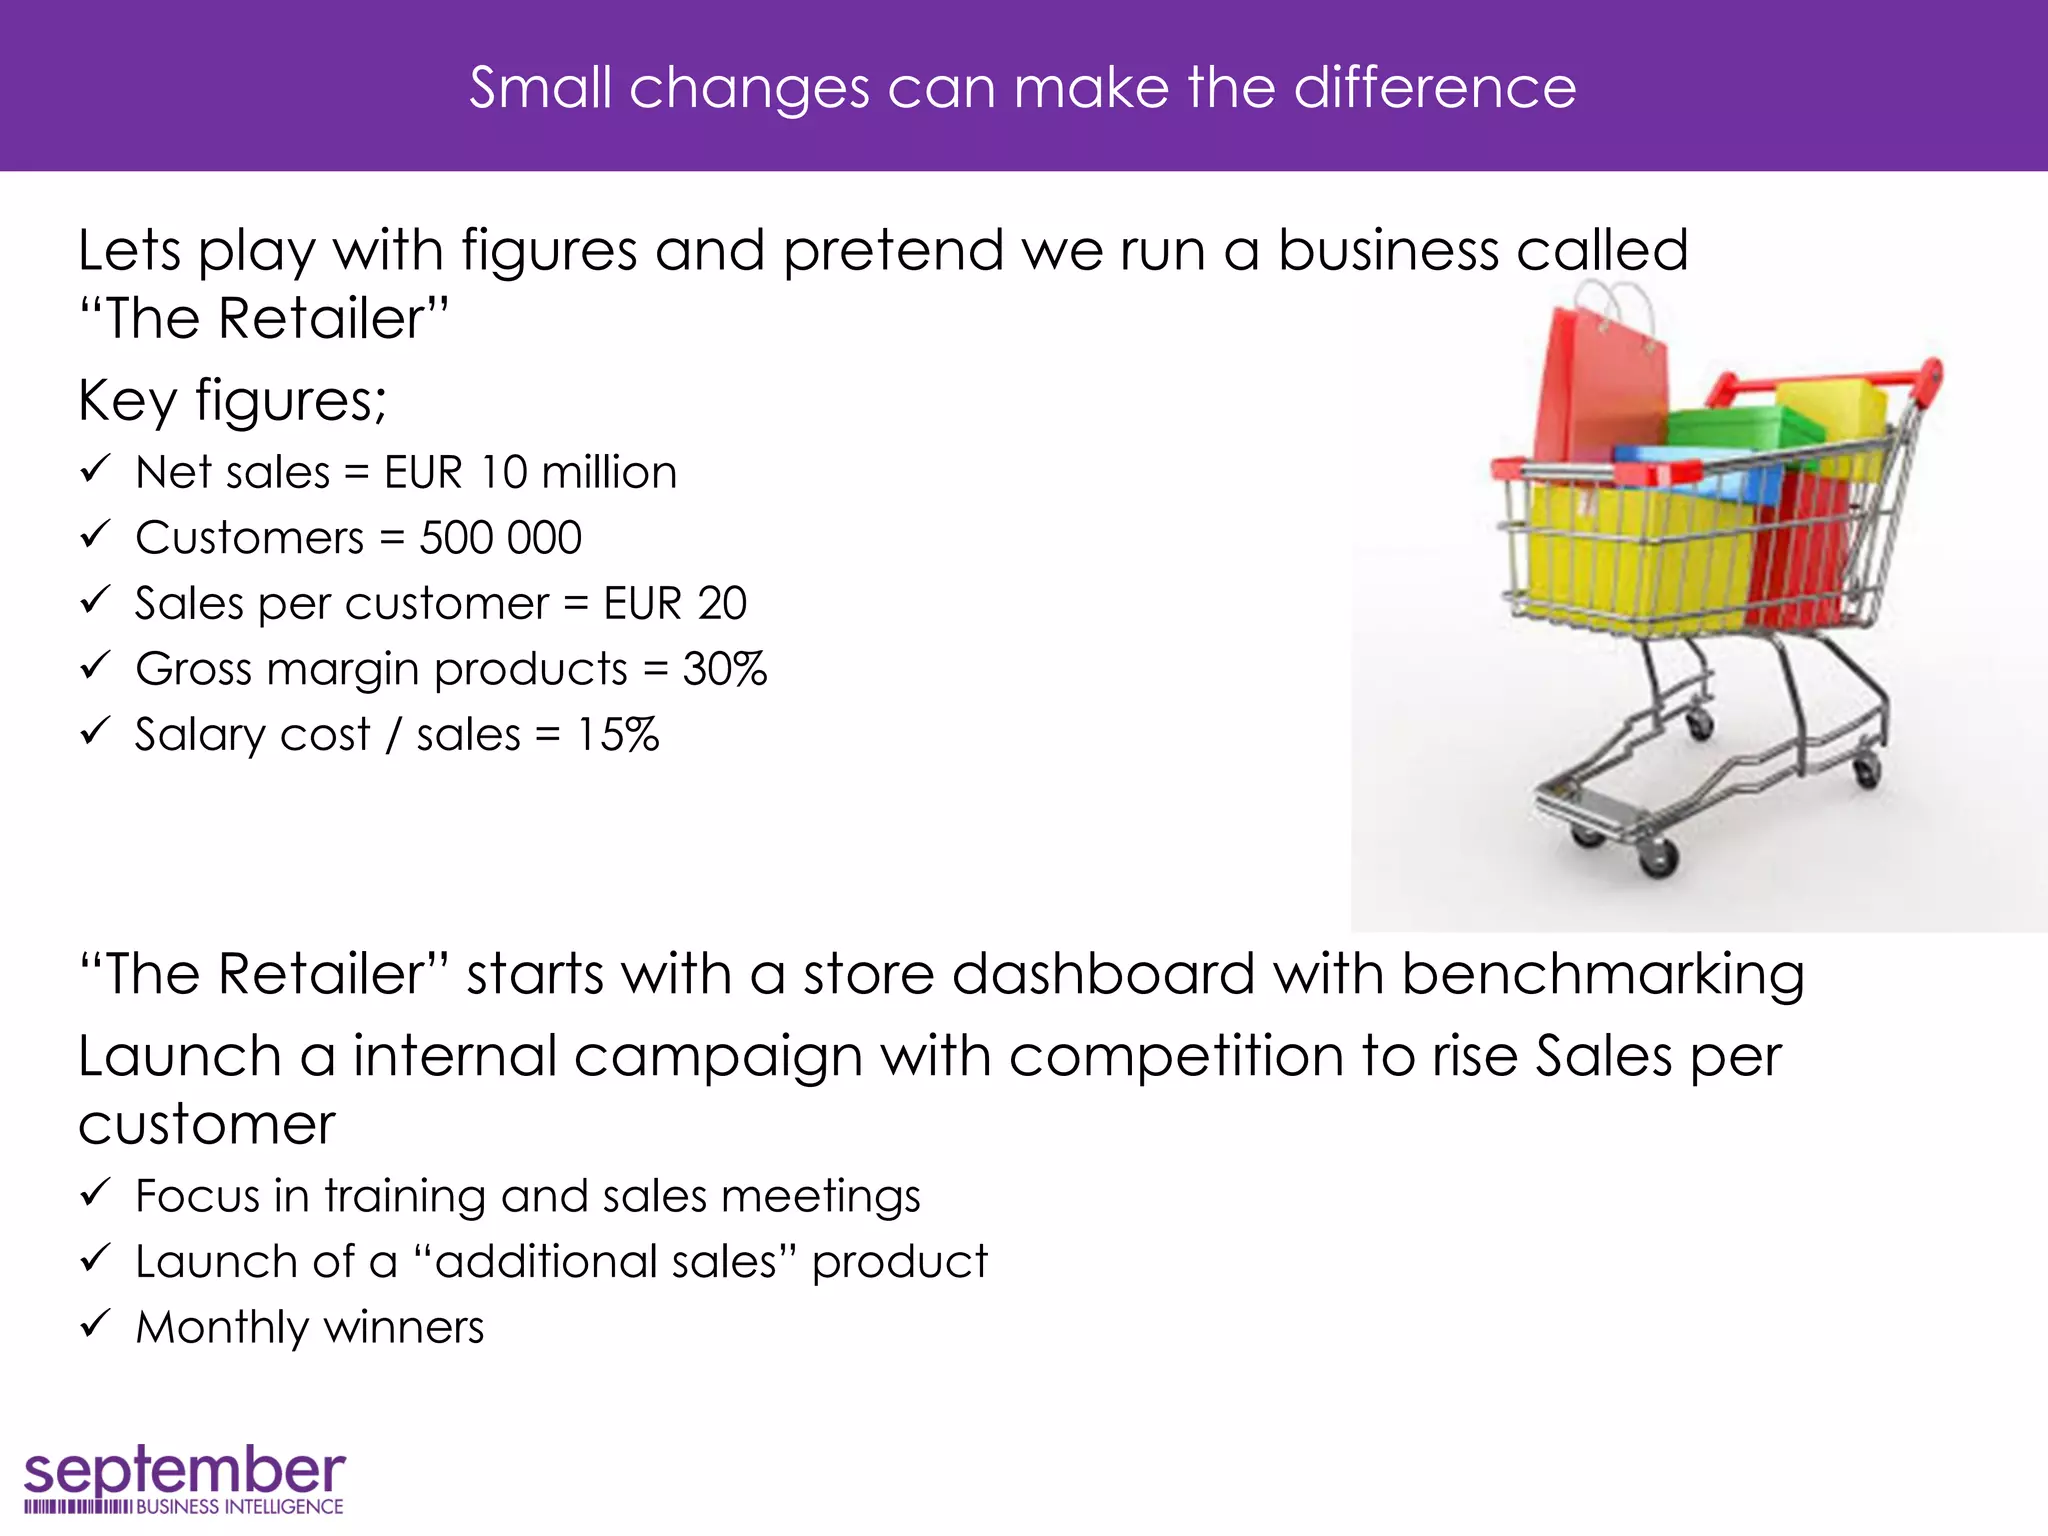
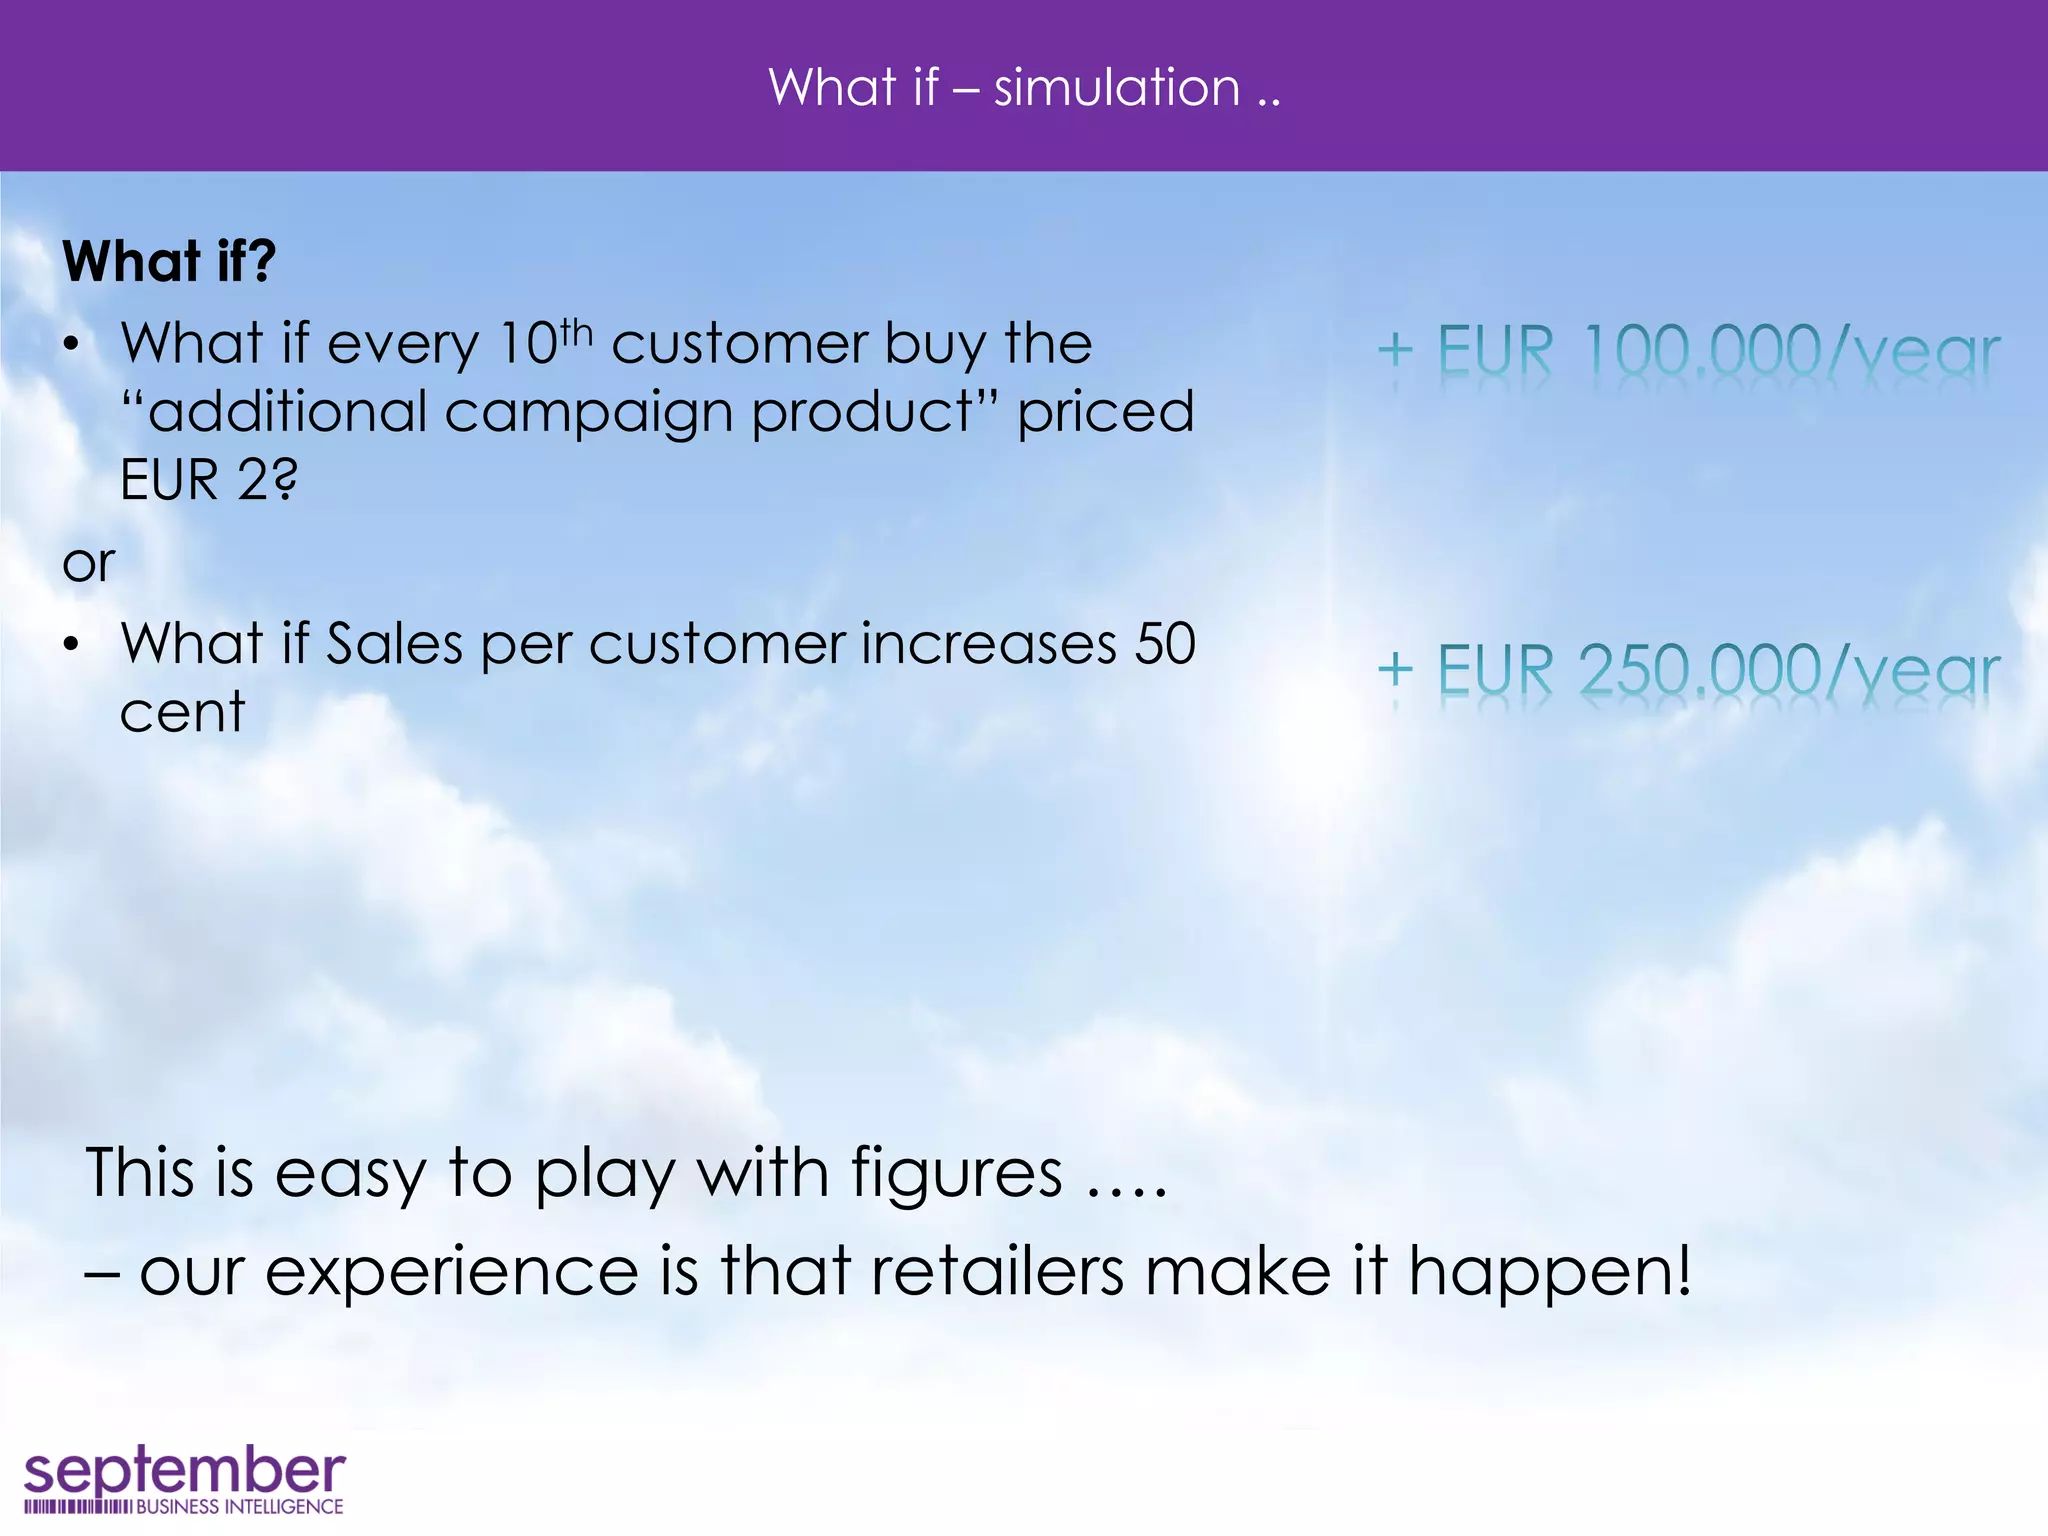
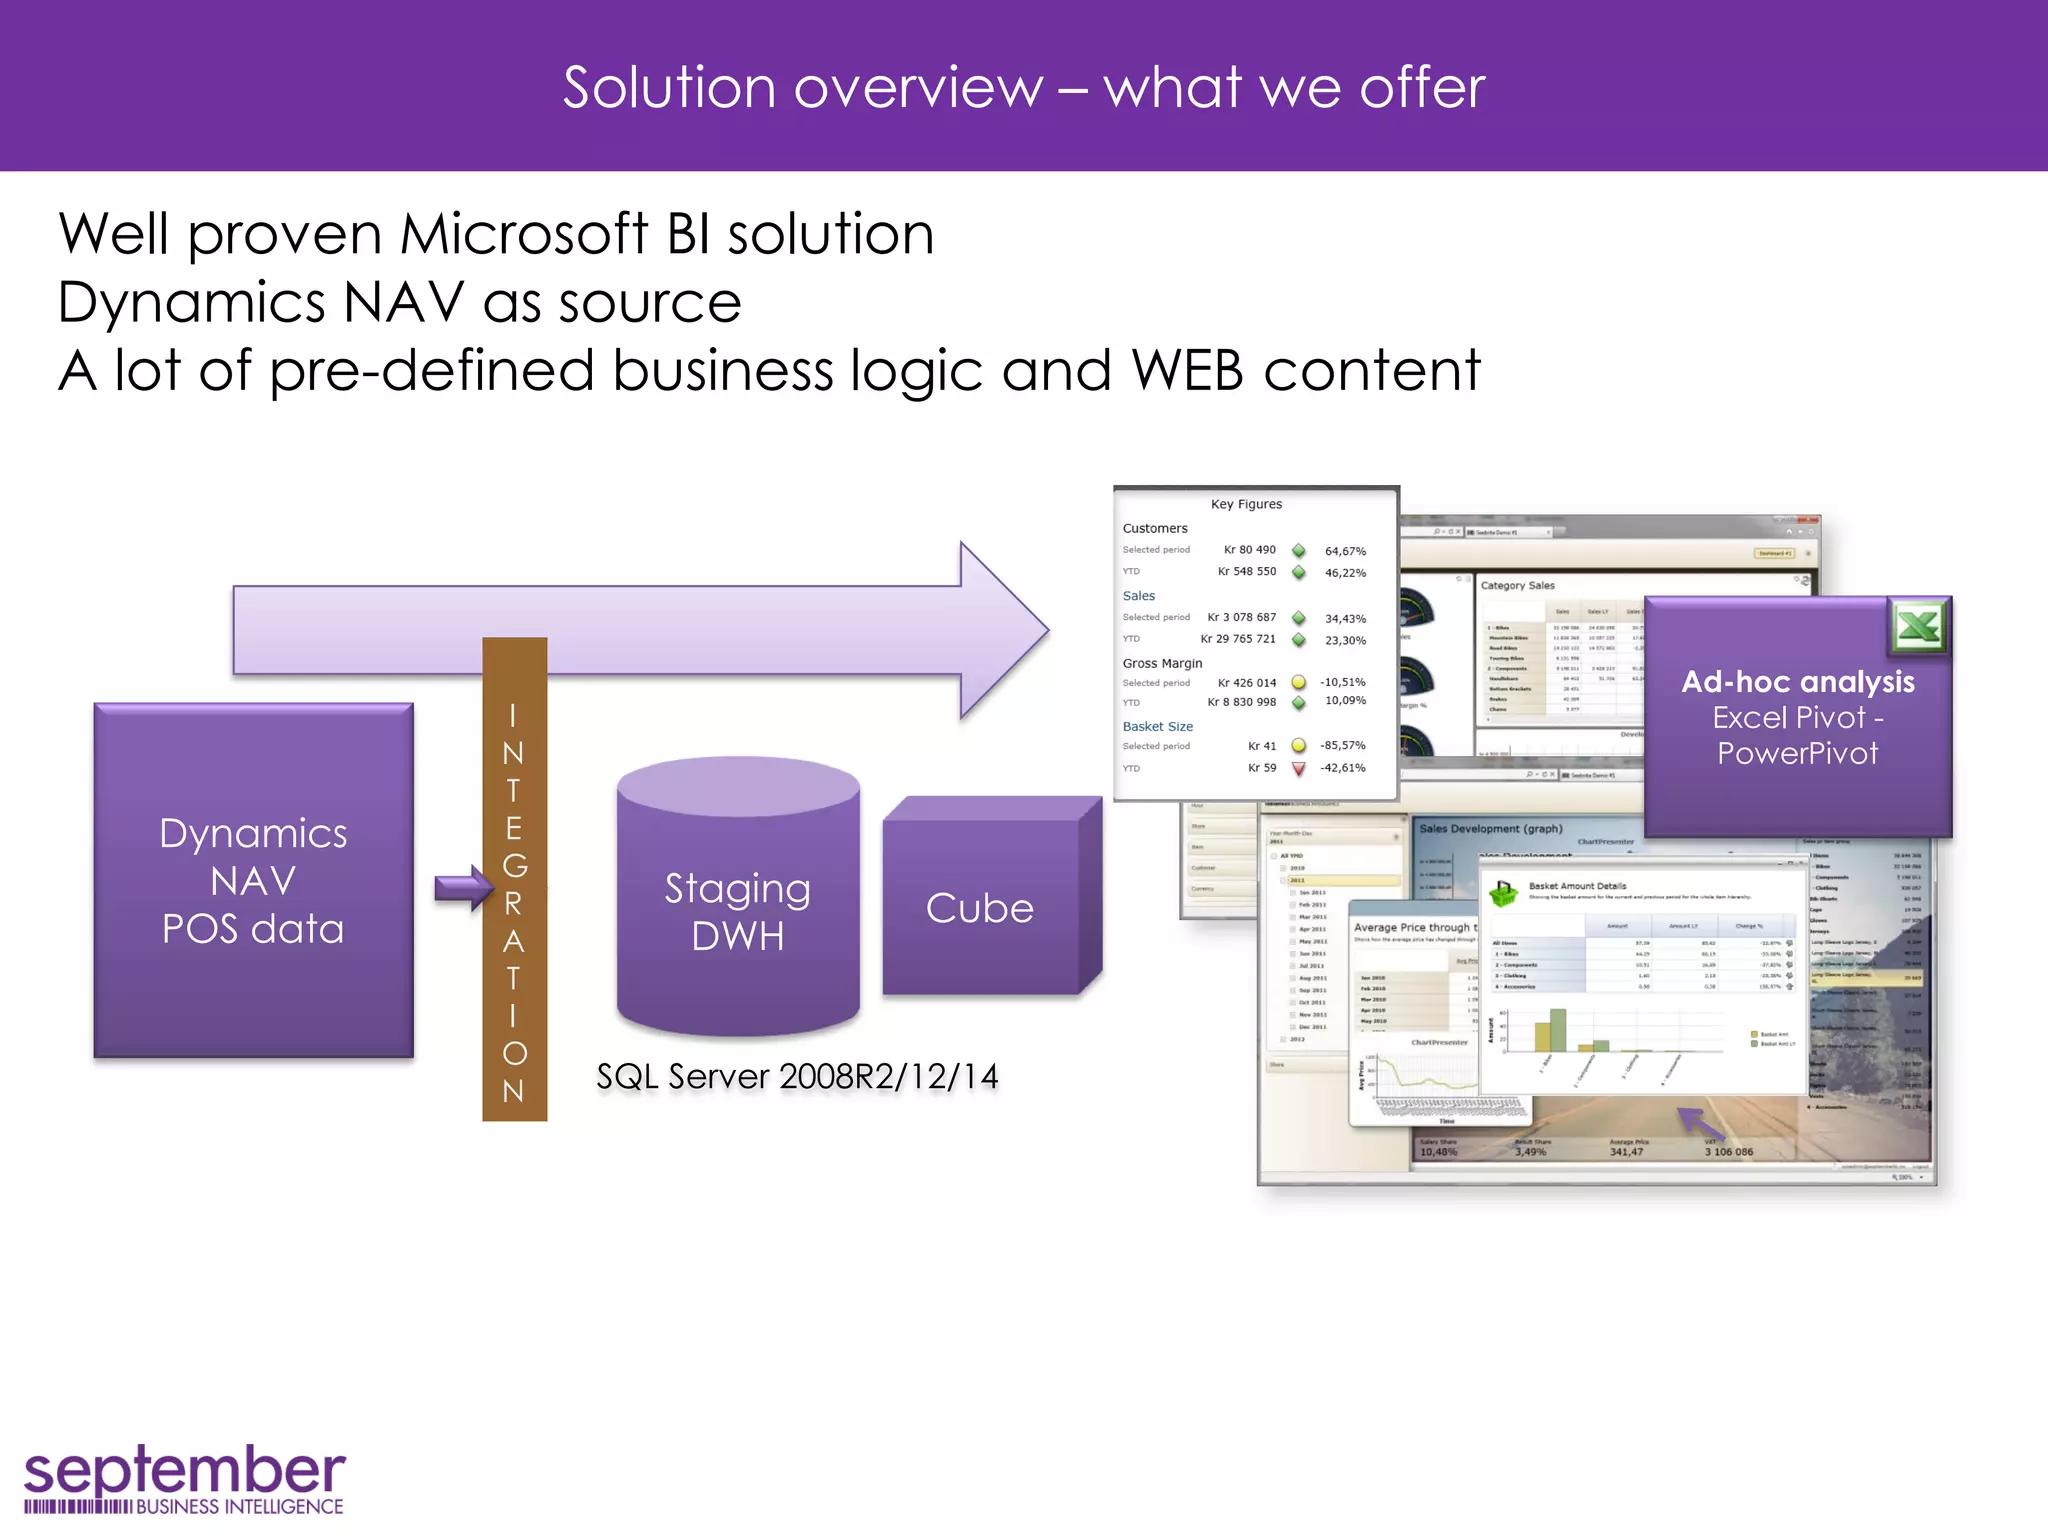
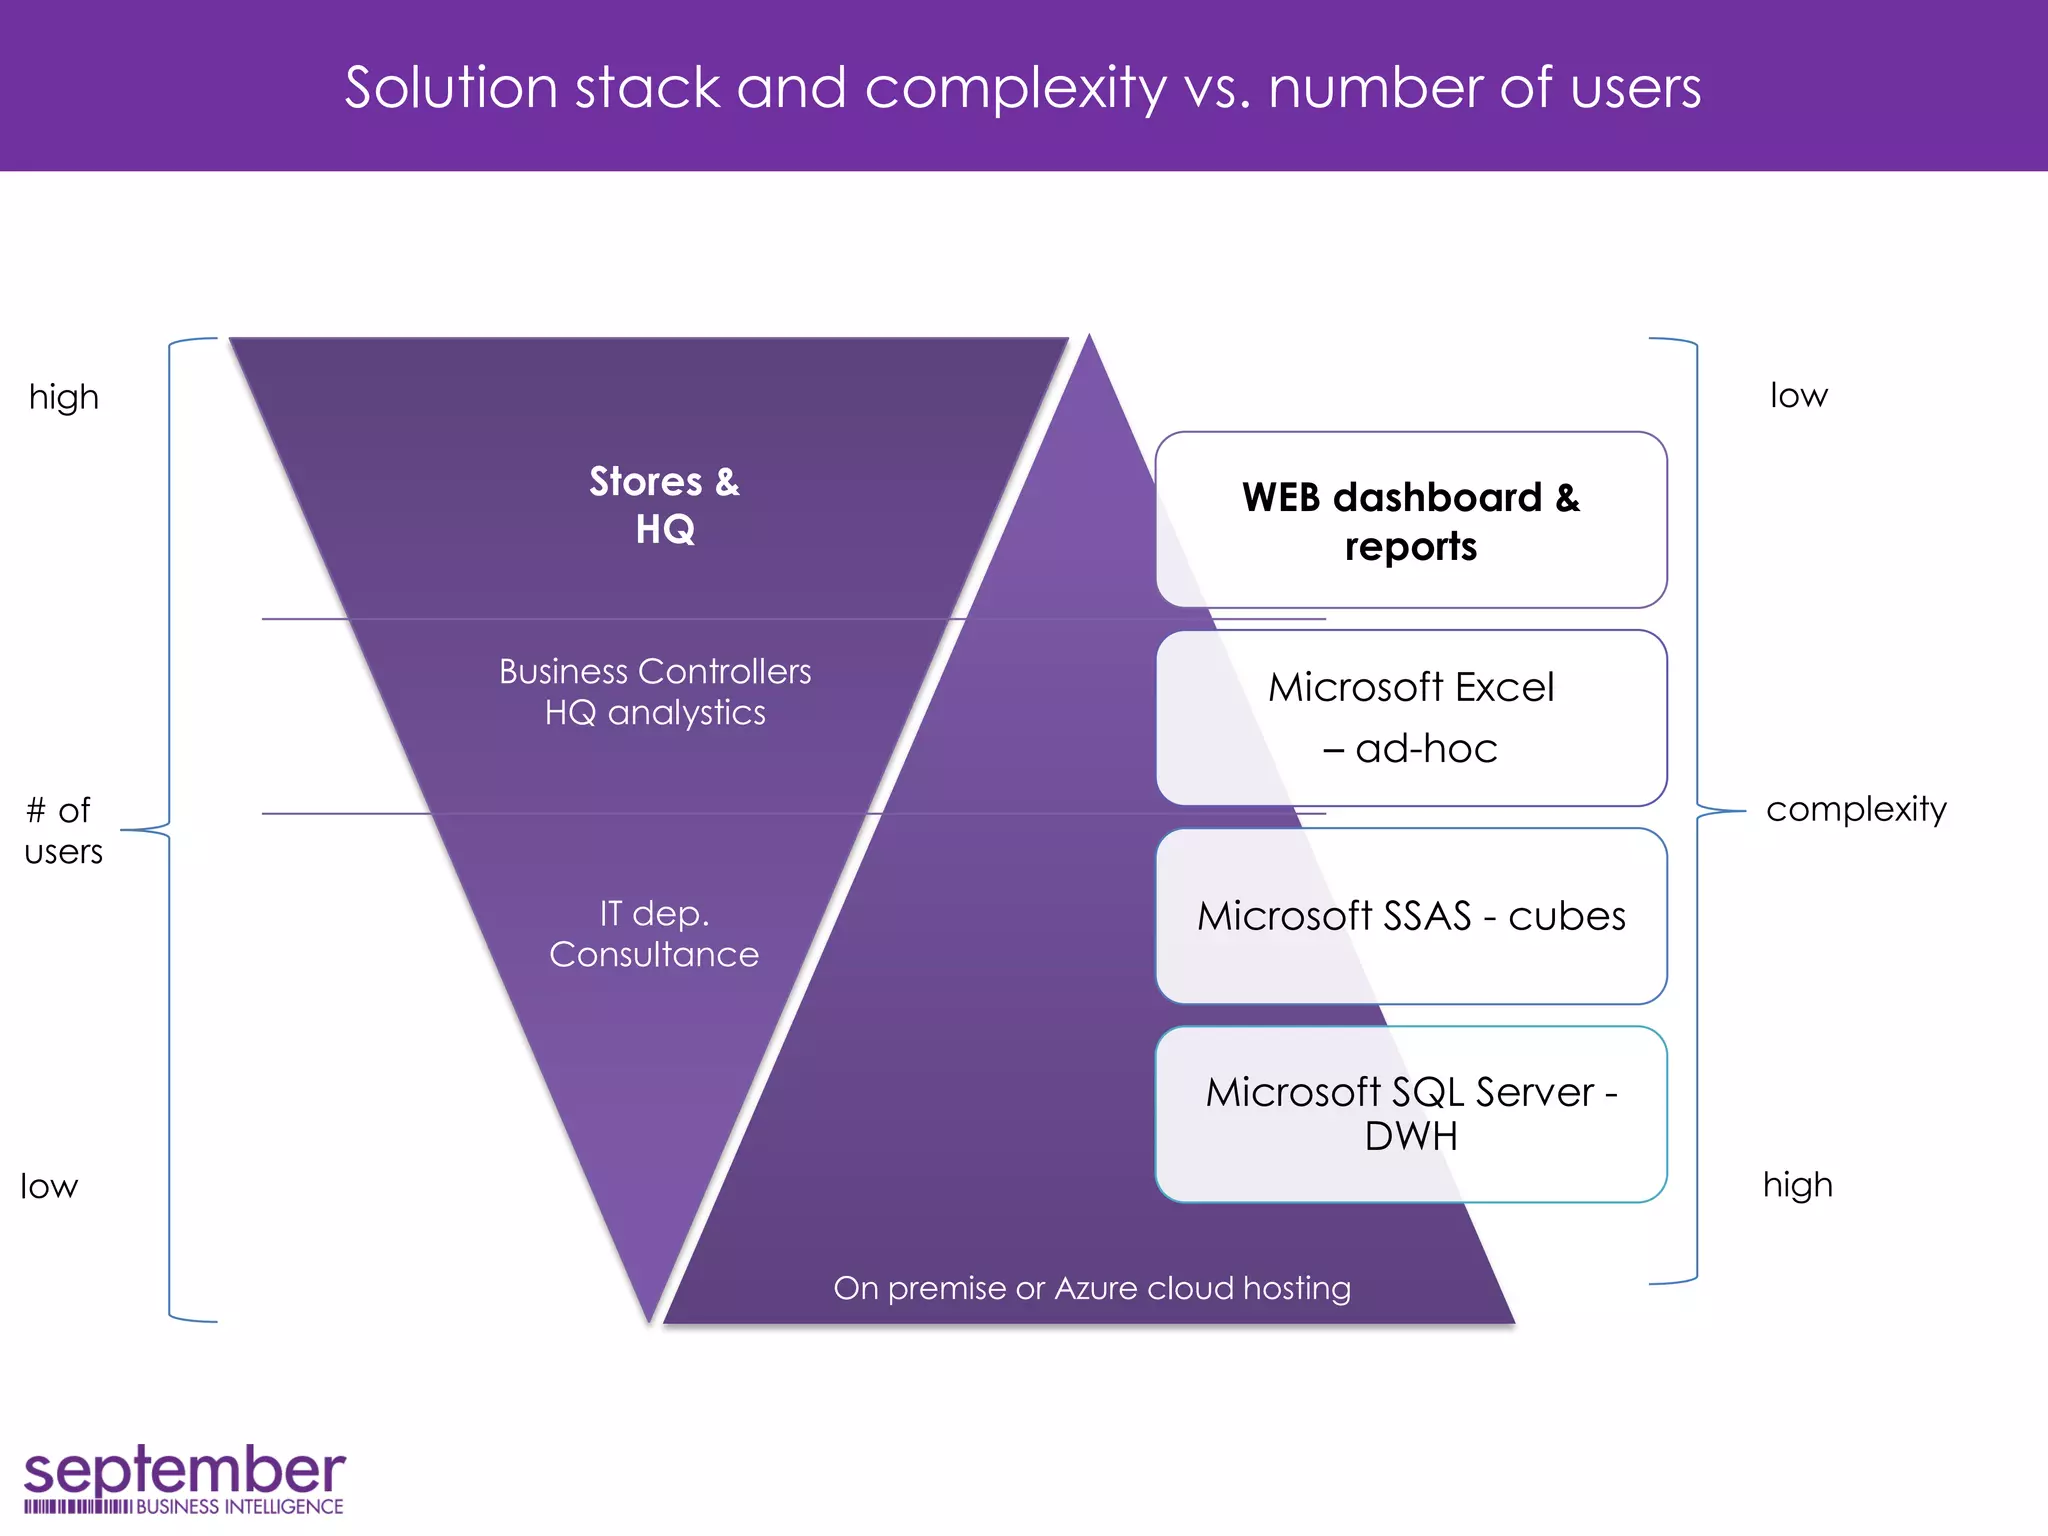
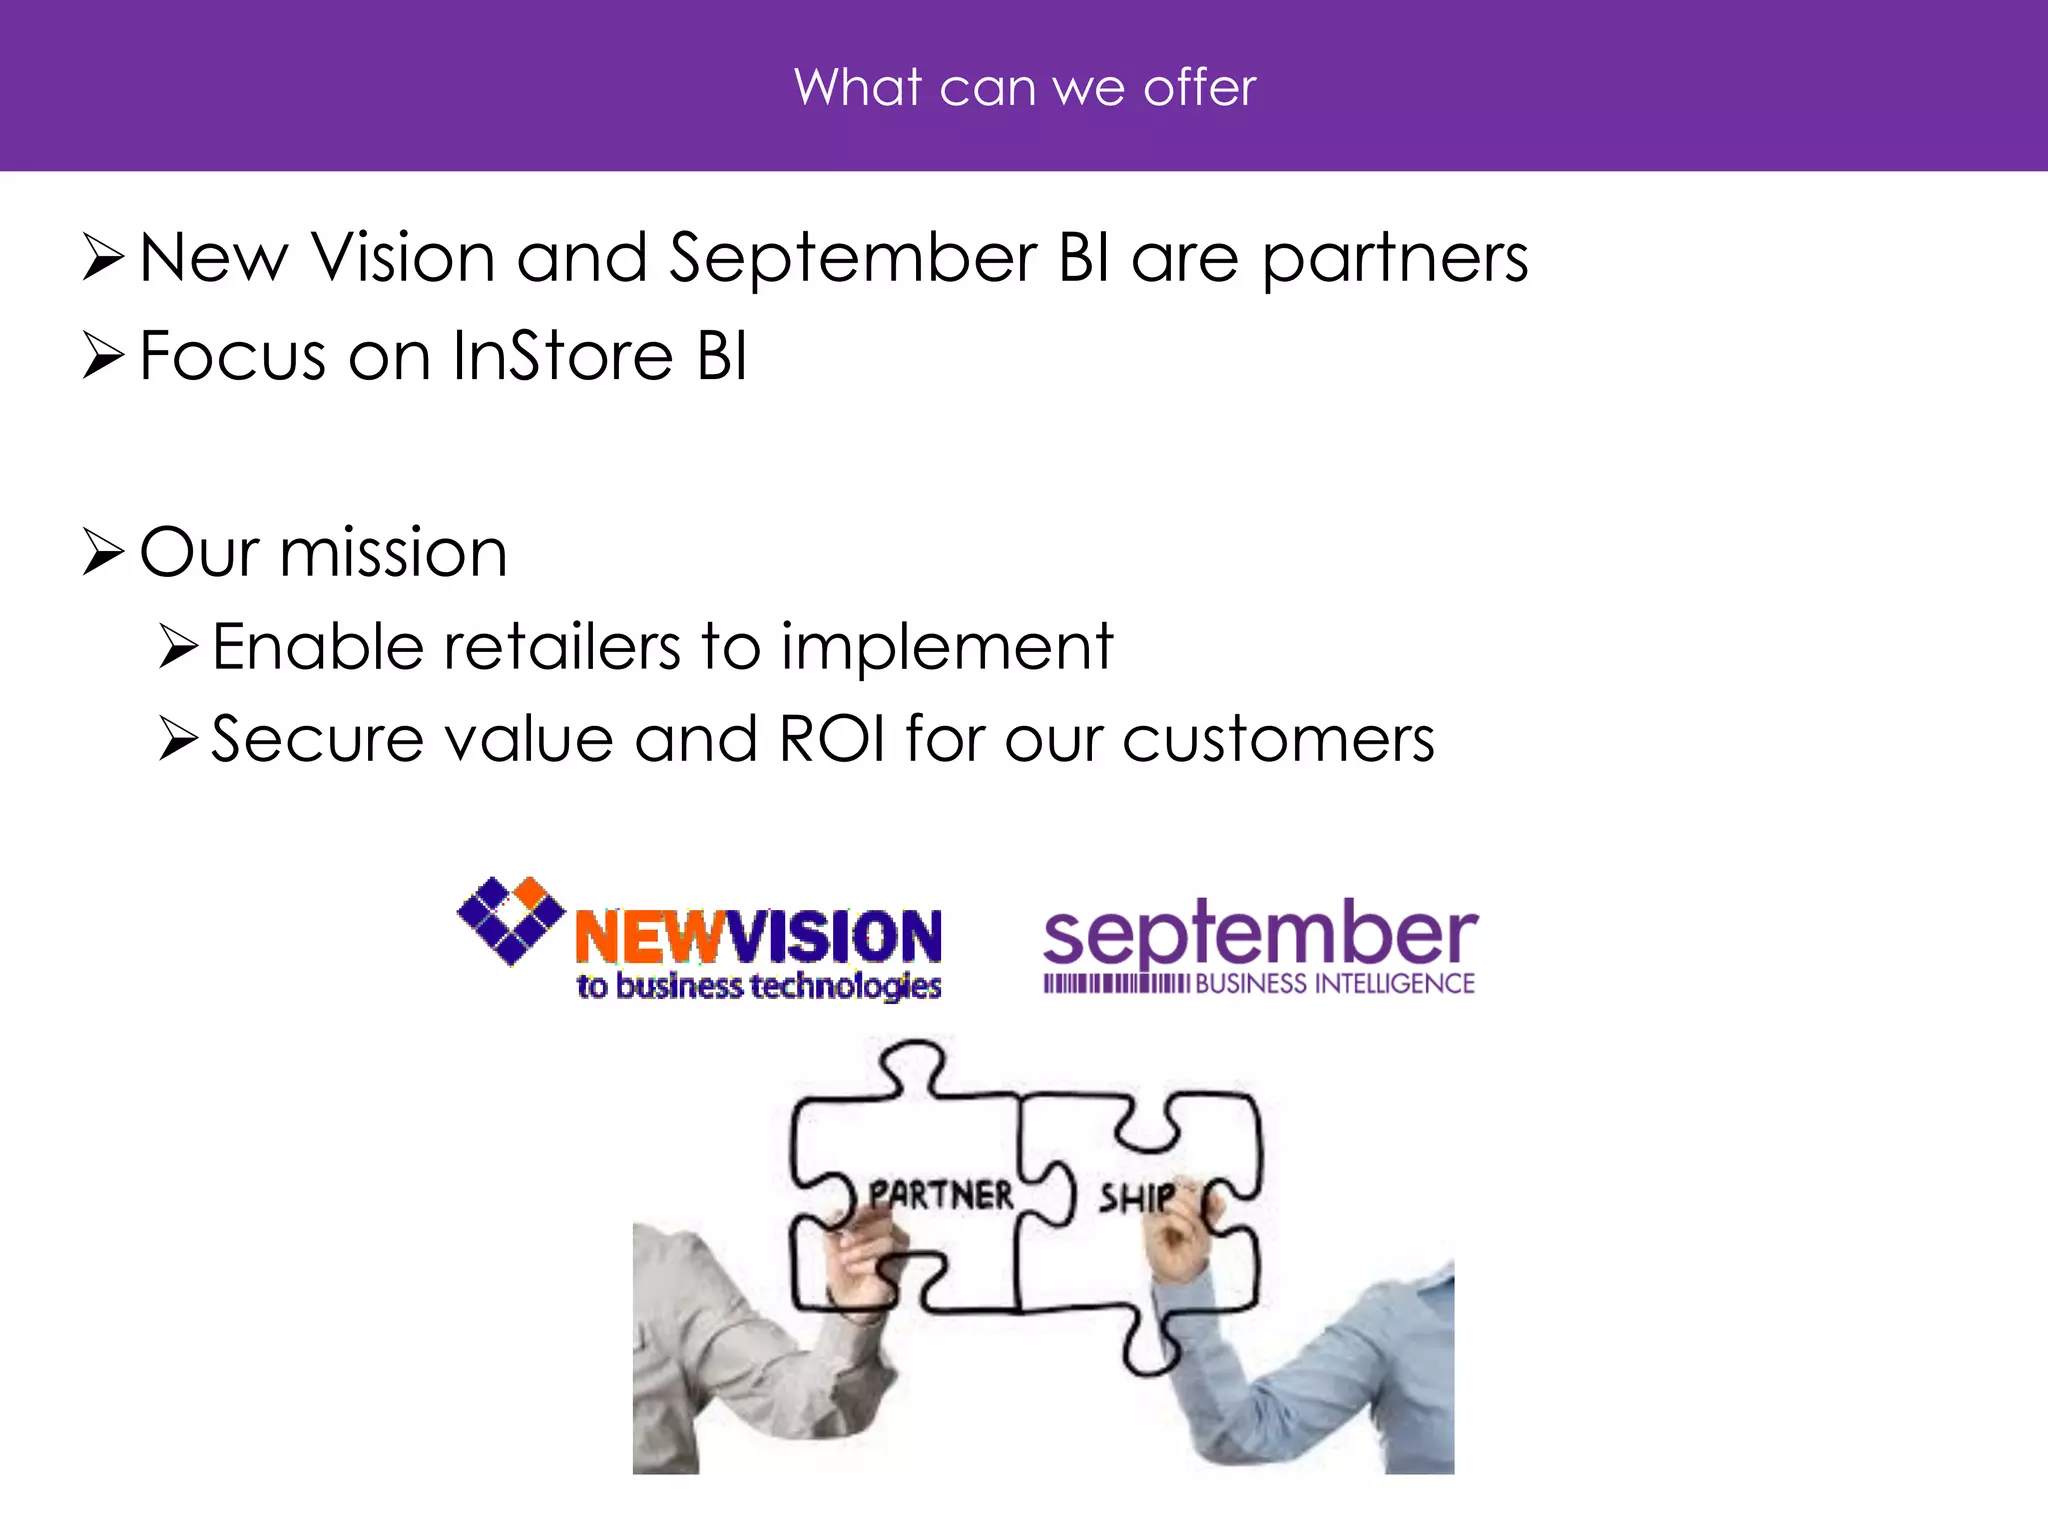
Retail Business Intelligence 
How to increase profit through store benchmarking 
Øyvind Stige, CEO at September BI
Retail Business Intelligence 
Store reporting alternatives 
Typical BI challenges 
How to increase profit 
Examples from successful retailers 
What’s in it – ROI 
Summary 
Solution overview & Company
Intro 
Alternative store reporting 
•Journal printing at Cash- register or POS 
A 
•POS or back-office reports 
•HQ BI 
B 
•BI for all – benchmarking and performance monitoring 
C
Typical store and HQ reporting without a BI solution 
At the HQ 
•Each system source for reports 
•Manual operation to consolidate 
•Vertical perspective – “silo based” 
In the store 
•Sales reports on POS or back-office 
•Limited drill to details 
•Different reports on different areas 
This means 
•Limited insight and overview 
•Manual work creating reports 
•Lack of benchmarking and analytic capabilities 
ERP, POS HQ, Time&Attendance, etc.
Typical store and HQ reporting with a HQ BI solution 
At the HQ 
•Consolidated data 
•Analytical capabilities 
•Produce store reports “semi manual” 
•Reports to store by email 
In the store 
•Read reports from HQ 
–PDF, Excel, PPT 
•Limited drill to details 
•No benchmarking 
This means 
•Manual work creating reports 
•The same message to all stores 
•Limited insight and engagement 
•Lack of benchmarking and analytic capabilities 
Is fixed PDF and Excel reports enough? 
ERP, POS HQ, Time&Attendance, etc. 
BI solution 
HQ user
InStore BI 
At the HQ 
•Consolidated data 
•Analytical capabilities 
In the store 
•Dashboard with selected KPI’s 
•Drill to details 
•Benchmarking 
This means 
•Better insights 
•Better decisions 
•Better sales and profit 
ERP, POS HQ, Time&Attendance, etc. 
BI solution 
All Store Managers + HQ
Challenges: Typical BI vendor approach 
Typical BI solutions are designed for HQ users 
•“Self service analytics..” 
•“Drag & drop…” 
•“Create your own dashboard…” 
•“Add new sources on the fly…” 
Outstanding for a business controller 
-but what about a busy store manager? 
-Skills? 
-Time to invest?
How to increase profit? 
Measuring and monitoring is needed 
– every day – in every store! 
Just a few selected KPI’s 
Small steps and changes in the daily business - in each store 
- will create growth in profit for the hole chain
How to increase profit? 
The question 
What is good performance? 
To be better than yesterday, last month or last year? 
Is that good enough?
Benchmarking 
Benchmarking the industry, segment or competitors? 
Most powerful benchmarking – internal 
Why? 
Growing business and success….
Growing business 
People is key to make it happen!
How to increase profit? 
Benchmarking against the 20% best 
Awake the spirit and competitive drive 
Daily reminder of the potential 
Store performance against the best 
Ranking of KPI’s they can influence 
Best practice 
GAP analysis - show potential 
“What if….”
Lets see examples from Scandinavian retailers
Lets see some examples from Scandinavian retailers - store dashboard 
Ranking selected KPI 
Sales today versus budget/goal 
Date-picker and Filtering 
Sales; week and month 
Monitoring selected KPI’s – drill to benchmark reports ranking the best 
Score 
Store performance competition 
19
Sales per customer 
Best performers 
Lets see some examples from Scandinavian retailers - store dashboard 
Ranked stores – by growth 
Result for own store and change against same period last year
Sales today 
Lets see some examples from Scandinavian retailers - store dashboard 
Sales needed to reach target 
Predicted status for day total 
Update every 15 minutes
Lets see some examples from Scandinavian retailers - store dashboard 
19 
Daily update of total score Selected criteria's Examples: Campaigns sales KPI score Mystery Shopper Customer Satisfaction survey Loyalty card share Etc.. 
Your results
Lets see some examples from Scandinavian retailers - store dashboard 
Ranking selected KPI 
Own score vs. the best 
Sales competition, ranked result selected Item/SKU 
Sales; today, yesterday, week and month 
Score “Store Olympics” – selected criteria's
Finding out what to do… 
Easy access to details is a must 
“Why…” 
“What to do…” 
one click away 
Examples from pre-defined analytics for the store manager
Finding out what to do… 
Chains 3rd best item ranked 194 in my store? 
Potential!! 
My store vs. 
Parent level in store hierarchy (region, country etc.)
Finding out what to do… 
Rank of all items in category 
Category analysis 
Sort by: Net Sales Amount 
Accumulated total 
Accumulated value
Finding out what to do… 
Category analysis 
Sort by: Net Sales Amount 
30 best items create 50% of the value 
Category total 
475 items 
102 items create 
80% of the value
Just a few examples of pre-defined analysis 
Drill from dashboard 
Experience from successful chains 
Cowering minimum 80% from basic offering 
Freedom to customize 
Freedom to use Excel Pivot for ad-hoc analysis at HQ 
?
Small changes can make the difference 
Lets play with figures and pretend we run a business called “The Retailer” 
Key figures; 
Net sales = EUR 10 million 
Customers = 500 000 
Sales per customer = EUR 20 
Gross margin products = 30% 
Salary cost / sales = 15% 
“The Retailer” starts with a store dashboard with benchmarking 
Launch a internal campaign with competition to rise Sales per customer 
Focus in training and sales meetings 
Launch of a “additional sales” product 
Monthly winners
What if – simulation .. 
What if? 
•What if every 10th customer buy the “additional campaign product” priced EUR 2? 
or 
•What if Sales per customer increases 50 cent 
This is easy to play with figures …. 
– our experience is that retailers make it happen!
INTEGRAT ION 
Staging DWH 
Ad-hoc analysis 
Excel Pivot - PowerPivot 
Dynamics NAV 
POS data 
Cube 
SQL Server 2008R2/12/14 
Solution overview – what we offer 
Well proven Microsoft BI solution Dynamics NAV as source A lot of pre-defined business logic and WEB content
WEB dashboard & reports 
Microsoft Excel 
– ad-hoc 
Microsoft SSAS - cubes 
Microsoft SQL Server - DWH 
Solution stack and complexity vs. number of users 
On premise or Azure cloud hosting 
Stores & 
HQ 
# of 
users 
Business Controllers 
HQ analystics 
IT dep. 
Consultance 
low 
high 
complexity 
high 
low
What can we offer 
New Vision and September BI are partners 
Focus on InStore BI 
Our mission 
Enable retailers to implement 
Secure value and ROI for our customers
Summary 
Our solution enables you to 
Share dashboards – updated, fresh and inspiring 
Benchmarking and motivation from potential 
Drill to pre-defined analysis – “Why and how…” 
All kind of sales reports, from category to products and details 
Excel ad-hoc analysis for super users 
A taste of how successful Scandinavian retailers work with BI
Background & company 
+ 20 years experience from POS, ERP and BI solutions in the Scandinavian market 
Customers:
Retail Business Intelligence – InStore 
We are a BI company with 100% retail focus 
Most BI solutions focus on analytics and “self service BI” for a few business controllers 
We believe in “BI for all” and our solutions are designed for “InStore BI“
Thank you! 
os@septemberbi.no

How to increase profit through store benchmarking

  • 1.
    Retail Business Intelligence How to increase profit through store benchmarking Øyvind Stige, CEO at September BI
  • 2.
    Retail Business Intelligence Store reporting alternatives Typical BI challenges How to increase profit Examples from successful retailers What’s in it – ROI Summary Solution overview & Company
  • 3.
    Intro Alternative storereporting •Journal printing at Cash- register or POS A •POS or back-office reports •HQ BI B •BI for all – benchmarking and performance monitoring C
  • 4.
    Typical store andHQ reporting without a BI solution At the HQ •Each system source for reports •Manual operation to consolidate •Vertical perspective – “silo based” In the store •Sales reports on POS or back-office •Limited drill to details •Different reports on different areas This means •Limited insight and overview •Manual work creating reports •Lack of benchmarking and analytic capabilities ERP, POS HQ, Time&Attendance, etc.
  • 5.
    Typical store andHQ reporting with a HQ BI solution At the HQ •Consolidated data •Analytical capabilities •Produce store reports “semi manual” •Reports to store by email In the store •Read reports from HQ –PDF, Excel, PPT •Limited drill to details •No benchmarking This means •Manual work creating reports •The same message to all stores •Limited insight and engagement •Lack of benchmarking and analytic capabilities Is fixed PDF and Excel reports enough? ERP, POS HQ, Time&Attendance, etc. BI solution HQ user
  • 6.
    InStore BI Atthe HQ •Consolidated data •Analytical capabilities In the store •Dashboard with selected KPI’s •Drill to details •Benchmarking This means •Better insights •Better decisions •Better sales and profit ERP, POS HQ, Time&Attendance, etc. BI solution All Store Managers + HQ
  • 7.
    Challenges: Typical BIvendor approach Typical BI solutions are designed for HQ users •“Self service analytics..” •“Drag & drop…” •“Create your own dashboard…” •“Add new sources on the fly…” Outstanding for a business controller -but what about a busy store manager? -Skills? -Time to invest?
  • 8.
    How to increaseprofit? Measuring and monitoring is needed – every day – in every store! Just a few selected KPI’s Small steps and changes in the daily business - in each store - will create growth in profit for the hole chain
  • 9.
    How to increaseprofit? The question What is good performance? To be better than yesterday, last month or last year? Is that good enough?
  • 10.
    Benchmarking Benchmarking theindustry, segment or competitors? Most powerful benchmarking – internal Why? Growing business and success….
  • 11.
    Growing business Peopleis key to make it happen!
  • 12.
    How to increaseprofit? Benchmarking against the 20% best Awake the spirit and competitive drive Daily reminder of the potential Store performance against the best Ranking of KPI’s they can influence Best practice GAP analysis - show potential “What if….”
  • 13.
    Lets see examplesfrom Scandinavian retailers
  • 14.
    Lets see someexamples from Scandinavian retailers - store dashboard Ranking selected KPI Sales today versus budget/goal Date-picker and Filtering Sales; week and month Monitoring selected KPI’s – drill to benchmark reports ranking the best Score Store performance competition 19
  • 15.
    Sales per customer Best performers Lets see some examples from Scandinavian retailers - store dashboard Ranked stores – by growth Result for own store and change against same period last year
  • 16.
    Sales today Letssee some examples from Scandinavian retailers - store dashboard Sales needed to reach target Predicted status for day total Update every 15 minutes
  • 17.
    Lets see someexamples from Scandinavian retailers - store dashboard 19 Daily update of total score Selected criteria's Examples: Campaigns sales KPI score Mystery Shopper Customer Satisfaction survey Loyalty card share Etc.. Your results
  • 18.
    Lets see someexamples from Scandinavian retailers - store dashboard Ranking selected KPI Own score vs. the best Sales competition, ranked result selected Item/SKU Sales; today, yesterday, week and month Score “Store Olympics” – selected criteria's
  • 19.
    Finding out whatto do… Easy access to details is a must “Why…” “What to do…” one click away Examples from pre-defined analytics for the store manager
  • 20.
    Finding out whatto do… Chains 3rd best item ranked 194 in my store? Potential!! My store vs. Parent level in store hierarchy (region, country etc.)
  • 21.
    Finding out whatto do… Rank of all items in category Category analysis Sort by: Net Sales Amount Accumulated total Accumulated value
  • 22.
    Finding out whatto do… Category analysis Sort by: Net Sales Amount 30 best items create 50% of the value Category total 475 items 102 items create 80% of the value
  • 23.
    Just a fewexamples of pre-defined analysis Drill from dashboard Experience from successful chains Cowering minimum 80% from basic offering Freedom to customize Freedom to use Excel Pivot for ad-hoc analysis at HQ ?
  • 24.
    Small changes canmake the difference Lets play with figures and pretend we run a business called “The Retailer” Key figures; Net sales = EUR 10 million Customers = 500 000 Sales per customer = EUR 20 Gross margin products = 30% Salary cost / sales = 15% “The Retailer” starts with a store dashboard with benchmarking Launch a internal campaign with competition to rise Sales per customer Focus in training and sales meetings Launch of a “additional sales” product Monthly winners
  • 25.
    What if –simulation .. What if? •What if every 10th customer buy the “additional campaign product” priced EUR 2? or •What if Sales per customer increases 50 cent This is easy to play with figures …. – our experience is that retailers make it happen!
  • 26.
    INTEGRAT ION StagingDWH Ad-hoc analysis Excel Pivot - PowerPivot Dynamics NAV POS data Cube SQL Server 2008R2/12/14 Solution overview – what we offer Well proven Microsoft BI solution Dynamics NAV as source A lot of pre-defined business logic and WEB content
  • 27.
    WEB dashboard &reports Microsoft Excel – ad-hoc Microsoft SSAS - cubes Microsoft SQL Server - DWH Solution stack and complexity vs. number of users On premise or Azure cloud hosting Stores & HQ # of users Business Controllers HQ analystics IT dep. Consultance low high complexity high low
  • 28.
    What can weoffer New Vision and September BI are partners Focus on InStore BI Our mission Enable retailers to implement Secure value and ROI for our customers
  • 29.
    Summary Our solutionenables you to Share dashboards – updated, fresh and inspiring Benchmarking and motivation from potential Drill to pre-defined analysis – “Why and how…” All kind of sales reports, from category to products and details Excel ad-hoc analysis for super users A taste of how successful Scandinavian retailers work with BI
  • 30.
    Background & company + 20 years experience from POS, ERP and BI solutions in the Scandinavian market Customers:
  • 31.
    Retail Business Intelligence– InStore We are a BI company with 100% retail focus Most BI solutions focus on analytics and “self service BI” for a few business controllers We believe in “BI for all” and our solutions are designed for “InStore BI“
  • 32.