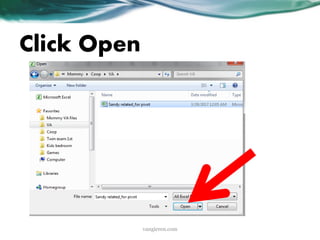
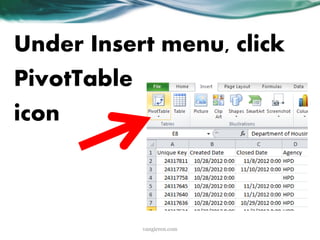
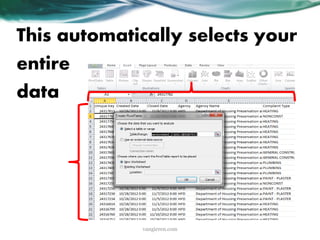
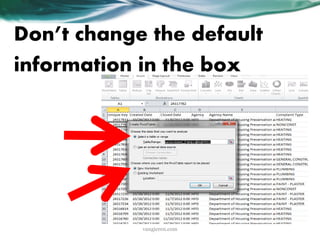
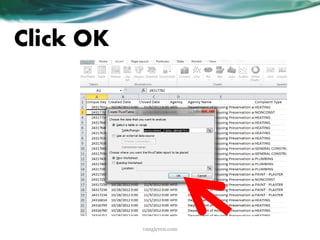
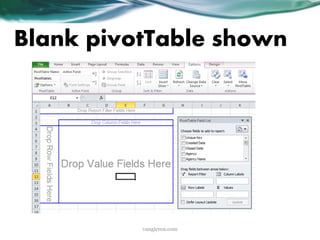
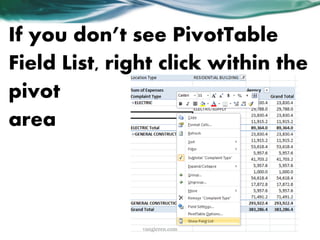
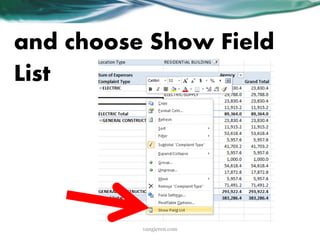
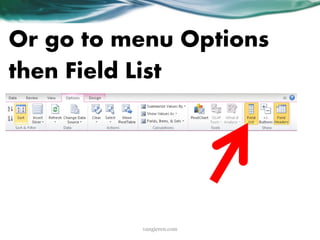
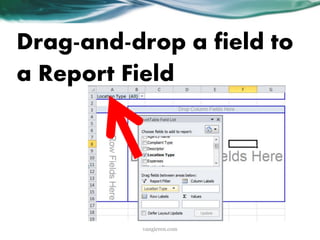
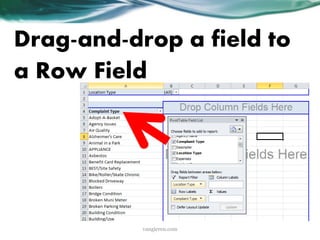
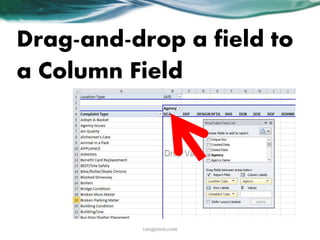
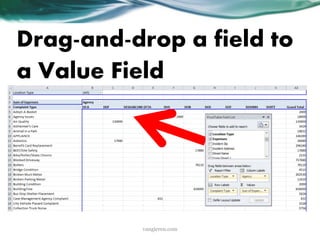
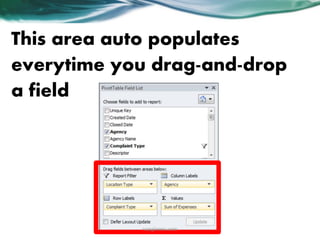
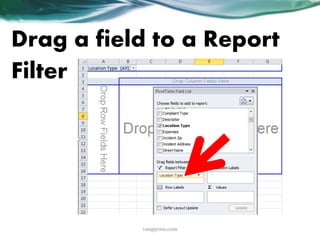
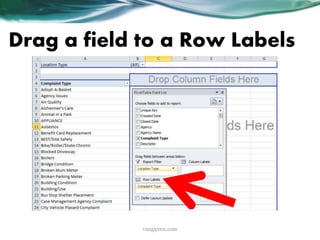
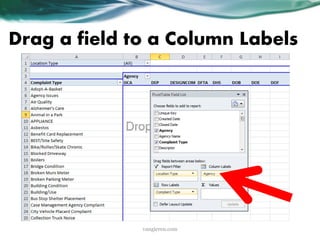
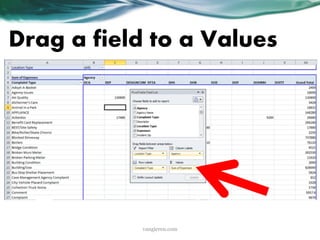
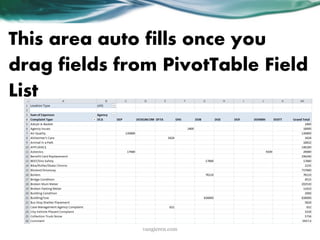
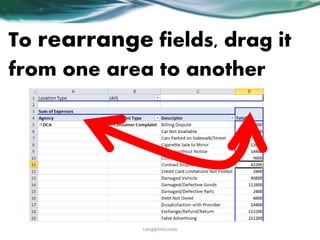
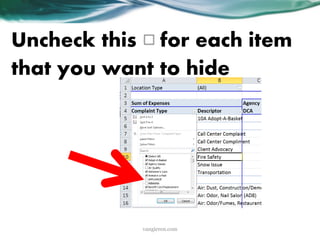
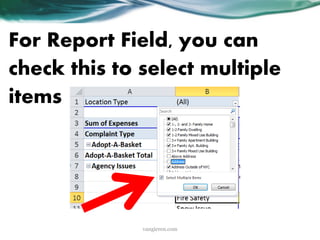
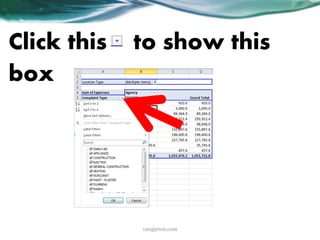
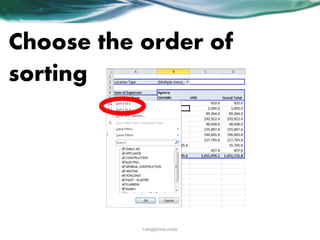
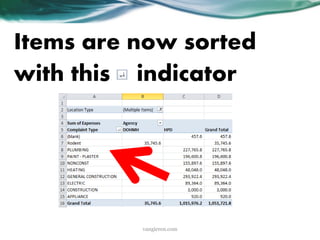
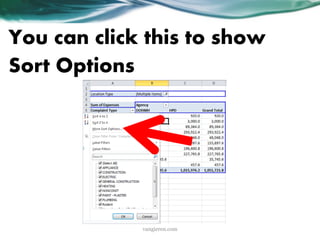
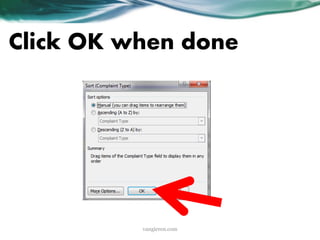
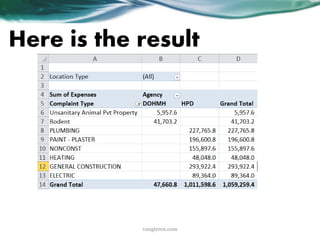
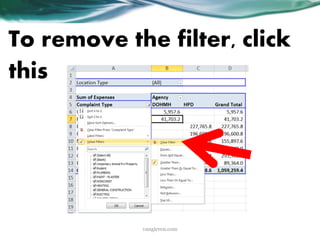
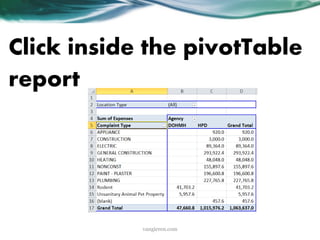
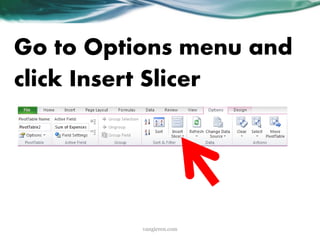
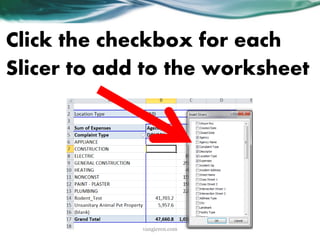
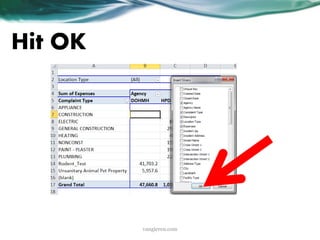
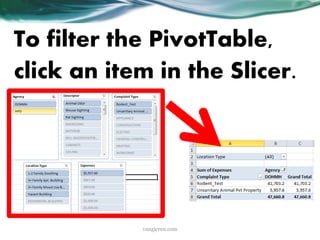
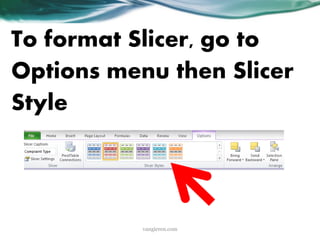
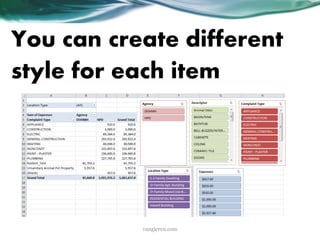
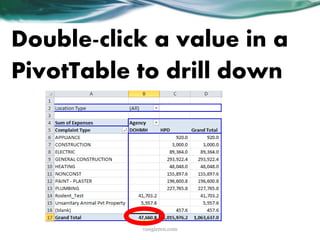
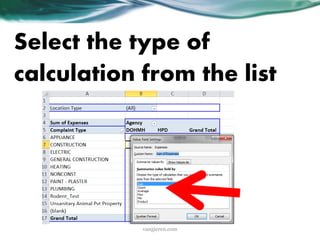
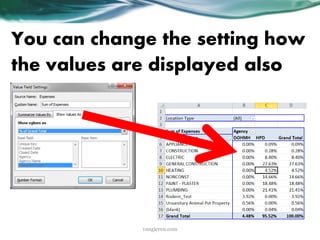
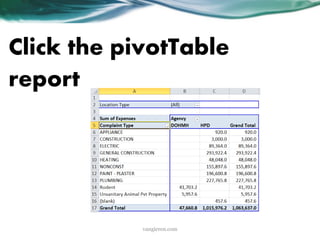
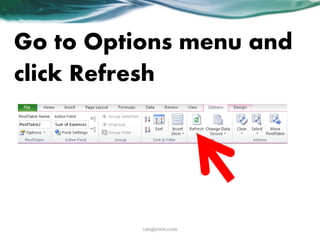
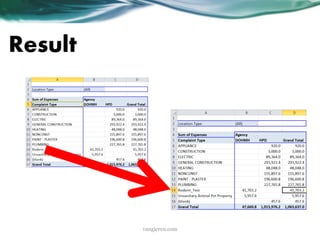
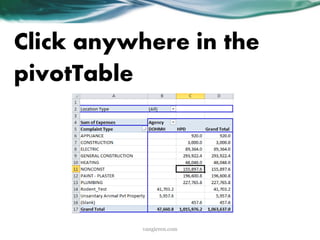
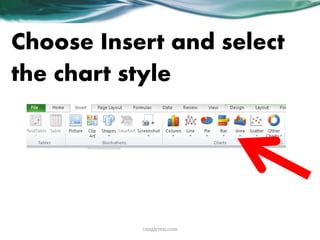
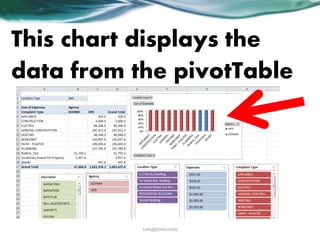
How to Create, Interpret and Use
PivotTable in Microsoft Excel ( 2010)
By: Vangie Ren
What is a PivotTable?
(c) Extraordinary VP | vangieren.com
A PivotTable is an interactive
table that summarizes and
analyzes data from existing
lists, tables, and databases.
(c) Extraordinary VP | vangieren.com
Given a PivotTable report,
the user can rotate its rows
and columns to see
different summaries of the
source data,
(c) Extraordinary VP | vangieren.com
filter the data by displaying
different pages, or display
the details for areas of
interest.
(c) Extraordinary VP | vangieren.com
Creating a
PivotTable Report
(c) Extraordinary VP | vangieren.com
Before creating a pivotTable,
consider the questions you
want to answer, or which
information you wish to
extract from your data.
(c) Extraordinary VP | vangieren.com
This step will determine
how you should
construct the table.
(c) Extraordinary VP | vangieren.com
You can start
opening the file in
two ways
(c) Extraordinary VP | vangieren.com
By going to the file in
your directory and open
it
(c) Extraordinary VP | vangieren.com
Or by opening Excel
from your desktop/
taskbar
(c) Extraordinary VP | vangieren.com
In Excel, go to File then
Open
(c) Extraordinary VP | vangieren.com
Go to the location of the
file
(c) Extraordinary VP | vangieren.com
Click Open
(c) Extraordinary VP | vangieren.com
Under Insert menu, click
PivotTable
icon
(c) Extraordinary VP | vangieren.com
This automatically selects your
entire
data
(c) Extraordinary VP | vangieren.com
Don’t change the default
information in the box
(c) Extraordinary VP | vangieren.com
Click OK
(c) Extraordinary VP | vangieren.com
Blank pivotTable shown
(c) Extraordinary VP | vangieren.com
Elements of a
PivotTable Report
(c) Extraordinary VP | vangieren.com
Report Field - A field that
is assigned to a page
orientation in a
PivotTable report.
(c) Extraordinary VP | vangieren.com
Row Field - A field that is
assigned to a row
orientation in a
PivotTable report.
(c) Extraordinary VP | vangieren.com
Column Field - A field
that is assigned to a
column orientation in a
PivotTable report.
(c) Extraordinary VP | vangieren.com
Value Field - A field from a
source list or database that
contains data to be summarized.
A data field usually contains
numeric data, such as statistics or
sales amounts, but it can also
contain text.
(c) Extraordinary VP | vangieren.com
Item - A subcategory or
member of a PivotTable
field
(c) Extraordinary VP | vangieren.com
Data Area - The part of a
PivotTable report that
contains summary data. The
cells of the data area shows
summarized data for the
items in the row and column
fields.
(c) Extraordinary VP | vangieren.com
PivotTable Field List - is
a window that lists all of
the fields from the
source data for use in
the PivotTable report.
(c) Extraordinary VP | vangieren.com
Upon opening a
PivotTable report, the
PivotTable Field List is
displayed automatically
onscreen.
(c) Extraordinary VP | vangieren.com
If you don’t see PivotTable
Field List, right click within the
pivot
area
(c) Extraordinary VP | vangieren.com
and choose Show Field
List
(c) Extraordinary VP | vangieren.com
Or go to menu Options
then Field List
(c) Extraordinary VP | vangieren.com
Two Ways to
Create and Lay Out
a PivotTable Report
(c) Extraordinary VP | vangieren.com
A. Using Drag-and-
drop Method
(c) Extraordinary VP | vangieren.com
Drag-and-drop a field to
a Report Field
(c) Extraordinary VP | vangieren.com
Drag-and-drop a field to
a Row Field
(c) Extraordinary VP | vangieren.com
Drag-and-drop a field to
a Column Field
(c) Extraordinary VP | vangieren.com
Drag-and-drop a field to
a Value Field
(c) Extraordinary VP | vangieren.com
This area auto populates
everytime you drag-and-drop
a field
(c) Extraordinary VP | vangieren.com
B. Using PivotTable
Field List
Functionality
(c) Extraordinary VP | vangieren.com
Drag a field to a Report
Filter
(c) Extraordinary VP | vangieren.com
Drag a field to a Row Labels
(c) Extraordinary VP | vangieren.com
Drag a field to a Column Labels
(c) Extraordinary VP | vangieren.com
Drag a field to a Values
(c) Extraordinary VP | vangieren.com
This area auto fills once you
drag fields from PivotTable Field
List
(c) Extraordinary VP | vangieren.com
To rearrange fields, drag it
from one area to another
(c) Extraordinary VP | vangieren.com
To remove fields, drag and drop
it out from PivotTable Field List
(c) Extraordinary VP | vangieren.com
Or uncheck the field in the
PivotTable Field list
(c) Extraordinary VP | vangieren.com
Displaying or
Hiding Items in a
PivotTable Report
(c) Extraordinary VP | vangieren.com
Click this to hide/show
items on each field
(c) Extraordinary VP | vangieren.com
Select this for each item
that you want to show
(c) Extraordinary VP | vangieren.com
Uncheck this for each item
that you want to hide
(c) Extraordinary VP | vangieren.com
For Report Field, you can
check this to select multiple
items
(c) Extraordinary VP | vangieren.com
Sorting and filtering
of items and values
in a PivotTable
Report
(c) Extraordinary VP | vangieren.com
You can sort items either
in ascending or
descending order in Row,
Column and Values
Fields.
(c) Extraordinary VP | vangieren.com
Click this to show this
box
(c) Extraordinary VP | vangieren.com
Choose the order of
sorting
(c) Extraordinary VP | vangieren.com
Items are now sorted
with this indicator
(c) Extraordinary VP | vangieren.com
You can click this to show
Sort Options
(c) Extraordinary VP | vangieren.com
Click OK when done
(c) Extraordinary VP | vangieren.com
Use Label Filter for
Column and Row Fields
to sort out items that you
want to display in your
report
(c) Extraordinary VP | vangieren.com
Click Label Filters
(c) Extraordinary VP | vangieren.com
Choose what type of filters
(c) Extraordinary VP | vangieren.com
Input what to filter
(c) Extraordinary VP | vangieren.com
You can also change your
label filter here
(c) Extraordinary VP | vangieren.com
Hit OK
(c) Extraordinary VP | vangieren.com
Filtered items
(c) Extraordinary VP | vangieren.com
To remove the filter, click
Clear
Filter
(c) Extraordinary VP | vangieren.com
Use Value Filter to filter
out the values that you
want to display in your
report
(c) Extraordinary VP | vangieren.com
Click Value Filters
(c) Extraordinary VP | vangieren.com
Choose from below
criteria
(c) Extraordinary VP | vangieren.com
Enter the value to filter
out
(c) Extraordinary VP | vangieren.com
Click OK
(c) Extraordinary VP | vangieren.com
Here is the result
(c) Extraordinary VP | vangieren.com
To remove the filter, click
this
(c) Extraordinary VP | vangieren.com
Using Slicer in a
PivotTable Report
(c) Extraordinary VP | vangieren.com
You can use Slicers tool to
make your PivotTable even
easier to work with. It lets
you select the data to show
in the PivotTable in a more
visual way.
(c) Extraordinary VP | vangieren.com
Click inside the pivotTable
report
(c) Extraordinary VP | vangieren.com
Go to Options menu and
click Insert Slicer
(c) Extraordinary VP | vangieren.com
Click the checkbox for each
Slicer to add to the worksheet
(c) Extraordinary VP | vangieren.com
Hit OK
(c) Extraordinary VP | vangieren.com
To filter the PivotTable,
click an item in the Slicer.
(c) Extraordinary VP | vangieren.com
To view multiple items at
once, Ctrl-click each item
you want to see.
(c) Extraordinary VP | vangieren.com
The items you're viewing will
be colored in the Slicer
(c) Extraordinary VP | vangieren.com
This indicates that the Slicer
is filtering the data in the
PivotTable
(c) Extraordinary VP | vangieren.com
Click the icon if you want to
remove that filter
(c) Extraordinary VP | vangieren.com
To format Slicer, go to
Options menu then Slicer
Style
(c) Extraordinary VP | vangieren.com
You can create different
style for each item
(c) Extraordinary VP | vangieren.com
Using Drill Down to
View the Data
(c) Extraordinary VP | vangieren.com
PivotTables have a built-
in drill-down feature that
allows you to analyze
the data and understand
it better.
(c) Extraordinary VP | vangieren.com
Double-click a value in a
PivotTable to drill down
(c) Extraordinary VP | vangieren.com
A new worksheet
appears containing the
values contributed to it
(c) Extraordinary VP | vangieren.com
Other Calculations
on Your PivotTable
Data
(c) Extraordinary VP | vangieren.com
You can set a PivotTable
to show calculations
other than the Sum.
(c) Extraordinary VP | vangieren.com
Go to the value field in
the pivotTable
(c) Extraordinary VP | vangieren.com
Go to Options menu and
click Field Settings
(c) Extraordinary VP | vangieren.com
Select the type of
calculation from the list
(c) Extraordinary VP | vangieren.com
You can change the setting how
the values are displayed also
(c) Extraordinary VP | vangieren.com
Refreshing Data
(c) Extraordinary VP | vangieren.com
Whenever you change
anything in your data
source, you need to
refresh the pivotTable
report to update that
change.
(c) Extraordinary VP | vangieren.com
Click the pivotTable
report
(c) Extraordinary VP | vangieren.com
Go to Options menu and
click Refresh
(c) Extraordinary VP | vangieren.com
Result
(c) Extraordinary VP | vangieren.com
Creating a
PivotChart Based
on Your PivotTable
(c) Extraordinary VP | vangieren.com
Click anywhere in the
pivotTable
(c) Extraordinary VP | vangieren.com
Choose Insert and select
the chart style
(c) Extraordinary VP | vangieren.com
This chart displays the
data from the pivotTable
(c) Extraordinary VP | vangieren.com
When you later update the
data in the PivotTable by
using Slicers, or by
changing the table layout,
the chart will automatically
change to match.
(c) Extraordinary VP | vangieren.com
“An investment in
knowledge pays the
best interest.”
- Benjamin Franklin
(c) Extraordinary VP | vangieren.com
End of Tutorial
(c) Extraordinary VP | vangieren.com

How to Create, Interpret and Use PivotTable in Excel

  • 1.
    How to Create,Interpret and Use PivotTable in Microsoft Excel ( 2010) By: Vangie Ren
  • 2.
    What is aPivotTable? (c) Extraordinary VP | vangieren.com
  • 3.
    A PivotTable isan interactive table that summarizes and analyzes data from existing lists, tables, and databases. (c) Extraordinary VP | vangieren.com
  • 4.
    Given a PivotTablereport, the user can rotate its rows and columns to see different summaries of the source data, (c) Extraordinary VP | vangieren.com
  • 5.
    filter the databy displaying different pages, or display the details for areas of interest. (c) Extraordinary VP | vangieren.com
  • 6.
    Creating a PivotTable Report (c)Extraordinary VP | vangieren.com
  • 7.
    Before creating apivotTable, consider the questions you want to answer, or which information you wish to extract from your data. (c) Extraordinary VP | vangieren.com
  • 8.
    This step willdetermine how you should construct the table. (c) Extraordinary VP | vangieren.com
  • 9.
    You can start openingthe file in two ways (c) Extraordinary VP | vangieren.com
  • 10.
    By going tothe file in your directory and open it (c) Extraordinary VP | vangieren.com
  • 11.
    Or by openingExcel from your desktop/ taskbar (c) Extraordinary VP | vangieren.com
  • 12.
    In Excel, goto File then Open (c) Extraordinary VP | vangieren.com
  • 13.
    Go to thelocation of the file (c) Extraordinary VP | vangieren.com
  • 14.
    Click Open (c) ExtraordinaryVP | vangieren.com
  • 15.
    Under Insert menu,click PivotTable icon (c) Extraordinary VP | vangieren.com
  • 16.
    This automatically selectsyour entire data (c) Extraordinary VP | vangieren.com
  • 17.
    Don’t change thedefault information in the box (c) Extraordinary VP | vangieren.com
  • 18.
    Click OK (c) ExtraordinaryVP | vangieren.com
  • 19.
    Blank pivotTable shown (c)Extraordinary VP | vangieren.com
  • 20.
    Elements of a PivotTableReport (c) Extraordinary VP | vangieren.com
  • 21.
    Report Field -A field that is assigned to a page orientation in a PivotTable report. (c) Extraordinary VP | vangieren.com
  • 22.
    Row Field -A field that is assigned to a row orientation in a PivotTable report. (c) Extraordinary VP | vangieren.com
  • 23.
    Column Field -A field that is assigned to a column orientation in a PivotTable report. (c) Extraordinary VP | vangieren.com
  • 24.
    Value Field -A field from a source list or database that contains data to be summarized. A data field usually contains numeric data, such as statistics or sales amounts, but it can also contain text. (c) Extraordinary VP | vangieren.com
  • 25.
    Item - Asubcategory or member of a PivotTable field (c) Extraordinary VP | vangieren.com
  • 26.
    Data Area -The part of a PivotTable report that contains summary data. The cells of the data area shows summarized data for the items in the row and column fields. (c) Extraordinary VP | vangieren.com
  • 27.
    PivotTable Field List- is a window that lists all of the fields from the source data for use in the PivotTable report. (c) Extraordinary VP | vangieren.com
  • 28.
    Upon opening a PivotTablereport, the PivotTable Field List is displayed automatically onscreen. (c) Extraordinary VP | vangieren.com
  • 29.
    If you don’tsee PivotTable Field List, right click within the pivot area (c) Extraordinary VP | vangieren.com
  • 30.
    and choose ShowField List (c) Extraordinary VP | vangieren.com
  • 31.
    Or go tomenu Options then Field List (c) Extraordinary VP | vangieren.com
  • 32.
    Two Ways to Createand Lay Out a PivotTable Report (c) Extraordinary VP | vangieren.com
  • 33.
    A. Using Drag-and- dropMethod (c) Extraordinary VP | vangieren.com
  • 34.
    Drag-and-drop a fieldto a Report Field (c) Extraordinary VP | vangieren.com
  • 35.
    Drag-and-drop a fieldto a Row Field (c) Extraordinary VP | vangieren.com
  • 36.
    Drag-and-drop a fieldto a Column Field (c) Extraordinary VP | vangieren.com
  • 37.
    Drag-and-drop a fieldto a Value Field (c) Extraordinary VP | vangieren.com
  • 38.
    This area autopopulates everytime you drag-and-drop a field (c) Extraordinary VP | vangieren.com
  • 39.
    B. Using PivotTable FieldList Functionality (c) Extraordinary VP | vangieren.com
  • 40.
    Drag a fieldto a Report Filter (c) Extraordinary VP | vangieren.com
  • 41.
    Drag a fieldto a Row Labels (c) Extraordinary VP | vangieren.com
  • 42.
    Drag a fieldto a Column Labels (c) Extraordinary VP | vangieren.com
  • 43.
    Drag a fieldto a Values (c) Extraordinary VP | vangieren.com
  • 44.
    This area autofills once you drag fields from PivotTable Field List (c) Extraordinary VP | vangieren.com
  • 45.
    To rearrange fields,drag it from one area to another (c) Extraordinary VP | vangieren.com
  • 46.
    To remove fields,drag and drop it out from PivotTable Field List (c) Extraordinary VP | vangieren.com
  • 47.
    Or uncheck thefield in the PivotTable Field list (c) Extraordinary VP | vangieren.com
  • 48.
    Displaying or Hiding Itemsin a PivotTable Report (c) Extraordinary VP | vangieren.com
  • 49.
    Click this tohide/show items on each field (c) Extraordinary VP | vangieren.com
  • 50.
    Select this foreach item that you want to show (c) Extraordinary VP | vangieren.com
  • 51.
    Uncheck this foreach item that you want to hide (c) Extraordinary VP | vangieren.com
  • 52.
    For Report Field,you can check this to select multiple items (c) Extraordinary VP | vangieren.com
  • 53.
    Sorting and filtering ofitems and values in a PivotTable Report (c) Extraordinary VP | vangieren.com
  • 54.
    You can sortitems either in ascending or descending order in Row, Column and Values Fields. (c) Extraordinary VP | vangieren.com
  • 55.
    Click this toshow this box (c) Extraordinary VP | vangieren.com
  • 56.
    Choose the orderof sorting (c) Extraordinary VP | vangieren.com
  • 57.
    Items are nowsorted with this indicator (c) Extraordinary VP | vangieren.com
  • 58.
    You can clickthis to show Sort Options (c) Extraordinary VP | vangieren.com
  • 59.
    Click OK whendone (c) Extraordinary VP | vangieren.com
  • 60.
    Use Label Filterfor Column and Row Fields to sort out items that you want to display in your report (c) Extraordinary VP | vangieren.com
  • 61.
    Click Label Filters (c)Extraordinary VP | vangieren.com
  • 62.
    Choose what typeof filters (c) Extraordinary VP | vangieren.com
  • 63.
    Input what tofilter (c) Extraordinary VP | vangieren.com
  • 64.
    You can alsochange your label filter here (c) Extraordinary VP | vangieren.com
  • 65.
    Hit OK (c) ExtraordinaryVP | vangieren.com
  • 66.
  • 67.
    To remove thefilter, click Clear Filter (c) Extraordinary VP | vangieren.com
  • 68.
    Use Value Filterto filter out the values that you want to display in your report (c) Extraordinary VP | vangieren.com
  • 69.
    Click Value Filters (c)Extraordinary VP | vangieren.com
  • 70.
    Choose from below criteria (c)Extraordinary VP | vangieren.com
  • 71.
    Enter the valueto filter out (c) Extraordinary VP | vangieren.com
  • 72.
    Click OK (c) ExtraordinaryVP | vangieren.com
  • 73.
    Here is theresult (c) Extraordinary VP | vangieren.com
  • 74.
    To remove thefilter, click this (c) Extraordinary VP | vangieren.com
  • 75.
    Using Slicer ina PivotTable Report (c) Extraordinary VP | vangieren.com
  • 76.
    You can useSlicers tool to make your PivotTable even easier to work with. It lets you select the data to show in the PivotTable in a more visual way. (c) Extraordinary VP | vangieren.com
  • 77.
    Click inside thepivotTable report (c) Extraordinary VP | vangieren.com
  • 78.
    Go to Optionsmenu and click Insert Slicer (c) Extraordinary VP | vangieren.com
  • 79.
    Click the checkboxfor each Slicer to add to the worksheet (c) Extraordinary VP | vangieren.com
  • 80.
    Hit OK (c) ExtraordinaryVP | vangieren.com
  • 81.
    To filter thePivotTable, click an item in the Slicer. (c) Extraordinary VP | vangieren.com
  • 82.
    To view multipleitems at once, Ctrl-click each item you want to see. (c) Extraordinary VP | vangieren.com
  • 83.
    The items you'reviewing will be colored in the Slicer (c) Extraordinary VP | vangieren.com
  • 84.
    This indicates thatthe Slicer is filtering the data in the PivotTable (c) Extraordinary VP | vangieren.com
  • 85.
    Click the iconif you want to remove that filter (c) Extraordinary VP | vangieren.com
  • 86.
    To format Slicer,go to Options menu then Slicer Style (c) Extraordinary VP | vangieren.com
  • 87.
    You can createdifferent style for each item (c) Extraordinary VP | vangieren.com
  • 88.
    Using Drill Downto View the Data (c) Extraordinary VP | vangieren.com
  • 89.
    PivotTables have abuilt- in drill-down feature that allows you to analyze the data and understand it better. (c) Extraordinary VP | vangieren.com
  • 90.
    Double-click a valuein a PivotTable to drill down (c) Extraordinary VP | vangieren.com
  • 91.
    A new worksheet appearscontaining the values contributed to it (c) Extraordinary VP | vangieren.com
  • 92.
    Other Calculations on YourPivotTable Data (c) Extraordinary VP | vangieren.com
  • 93.
    You can seta PivotTable to show calculations other than the Sum. (c) Extraordinary VP | vangieren.com
  • 94.
    Go to thevalue field in the pivotTable (c) Extraordinary VP | vangieren.com
  • 95.
    Go to Optionsmenu and click Field Settings (c) Extraordinary VP | vangieren.com
  • 96.
    Select the typeof calculation from the list (c) Extraordinary VP | vangieren.com
  • 97.
    You can changethe setting how the values are displayed also (c) Extraordinary VP | vangieren.com
  • 98.
  • 99.
    Whenever you change anythingin your data source, you need to refresh the pivotTable report to update that change. (c) Extraordinary VP | vangieren.com
  • 100.
    Click the pivotTable report (c)Extraordinary VP | vangieren.com
  • 101.
    Go to Optionsmenu and click Refresh (c) Extraordinary VP | vangieren.com
  • 102.
  • 103.
    Creating a PivotChart Based onYour PivotTable (c) Extraordinary VP | vangieren.com
  • 104.
    Click anywhere inthe pivotTable (c) Extraordinary VP | vangieren.com
  • 105.
    Choose Insert andselect the chart style (c) Extraordinary VP | vangieren.com
  • 106.
    This chart displaysthe data from the pivotTable (c) Extraordinary VP | vangieren.com
  • 107.
    When you laterupdate the data in the PivotTable by using Slicers, or by changing the table layout, the chart will automatically change to match. (c) Extraordinary VP | vangieren.com
  • 108.
    “An investment in knowledgepays the best interest.” - Benjamin Franklin (c) Extraordinary VP | vangieren.com
  • 109.
    End of Tutorial (c)Extraordinary VP | vangieren.com