Download as PDF, PPTX


![Comprehensive BCA Inclusions
9
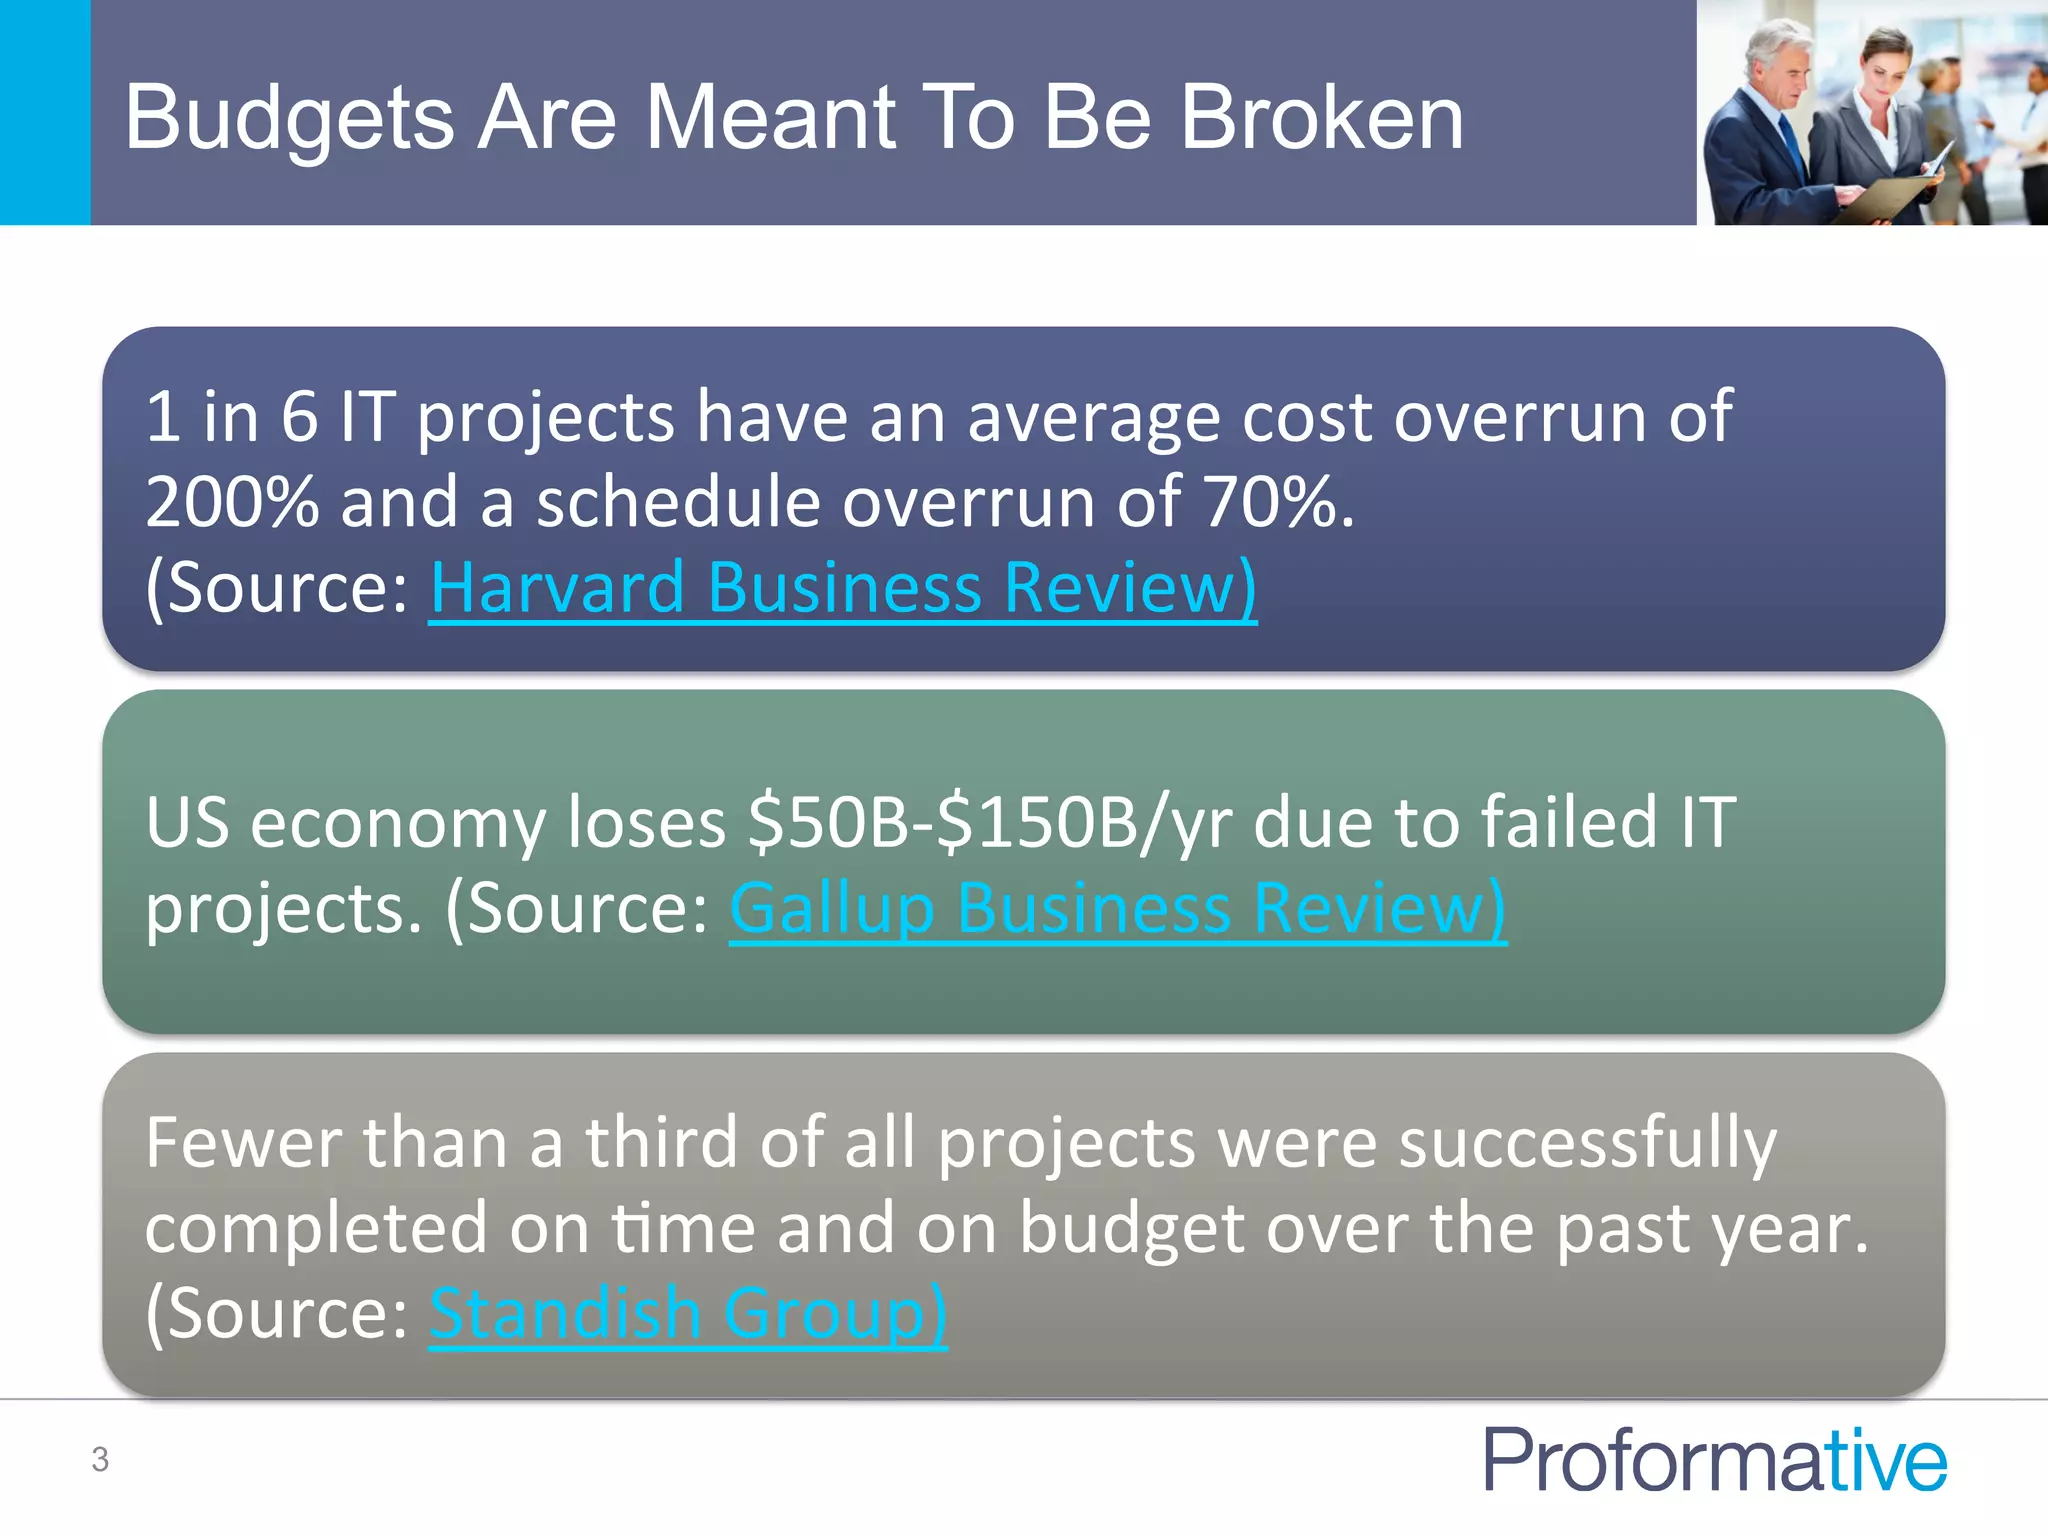
• Increased
labor
producNvity
• Reduce
costs
• Increased
revenue
(and
associated
margin)
Forecast
benefits
• Upfront
costs
• Recurring
costs
Project
costs
• Ramp
up
• [Benefits
–
Costs
=
Annual
Net
Benefits]
Map
benefit
and
cost
projecNons
Calculate
key
financial
metrics](https://image.slidesharecdn.com/gotransversebusinesscaseanalysisfortechinvestments-151109213948-lva1-app6891/75/How-to-Build-a-Great-Cloud-SaaS-Business-Case-Analysis-for-Technology-Investment-9-2048.jpg)
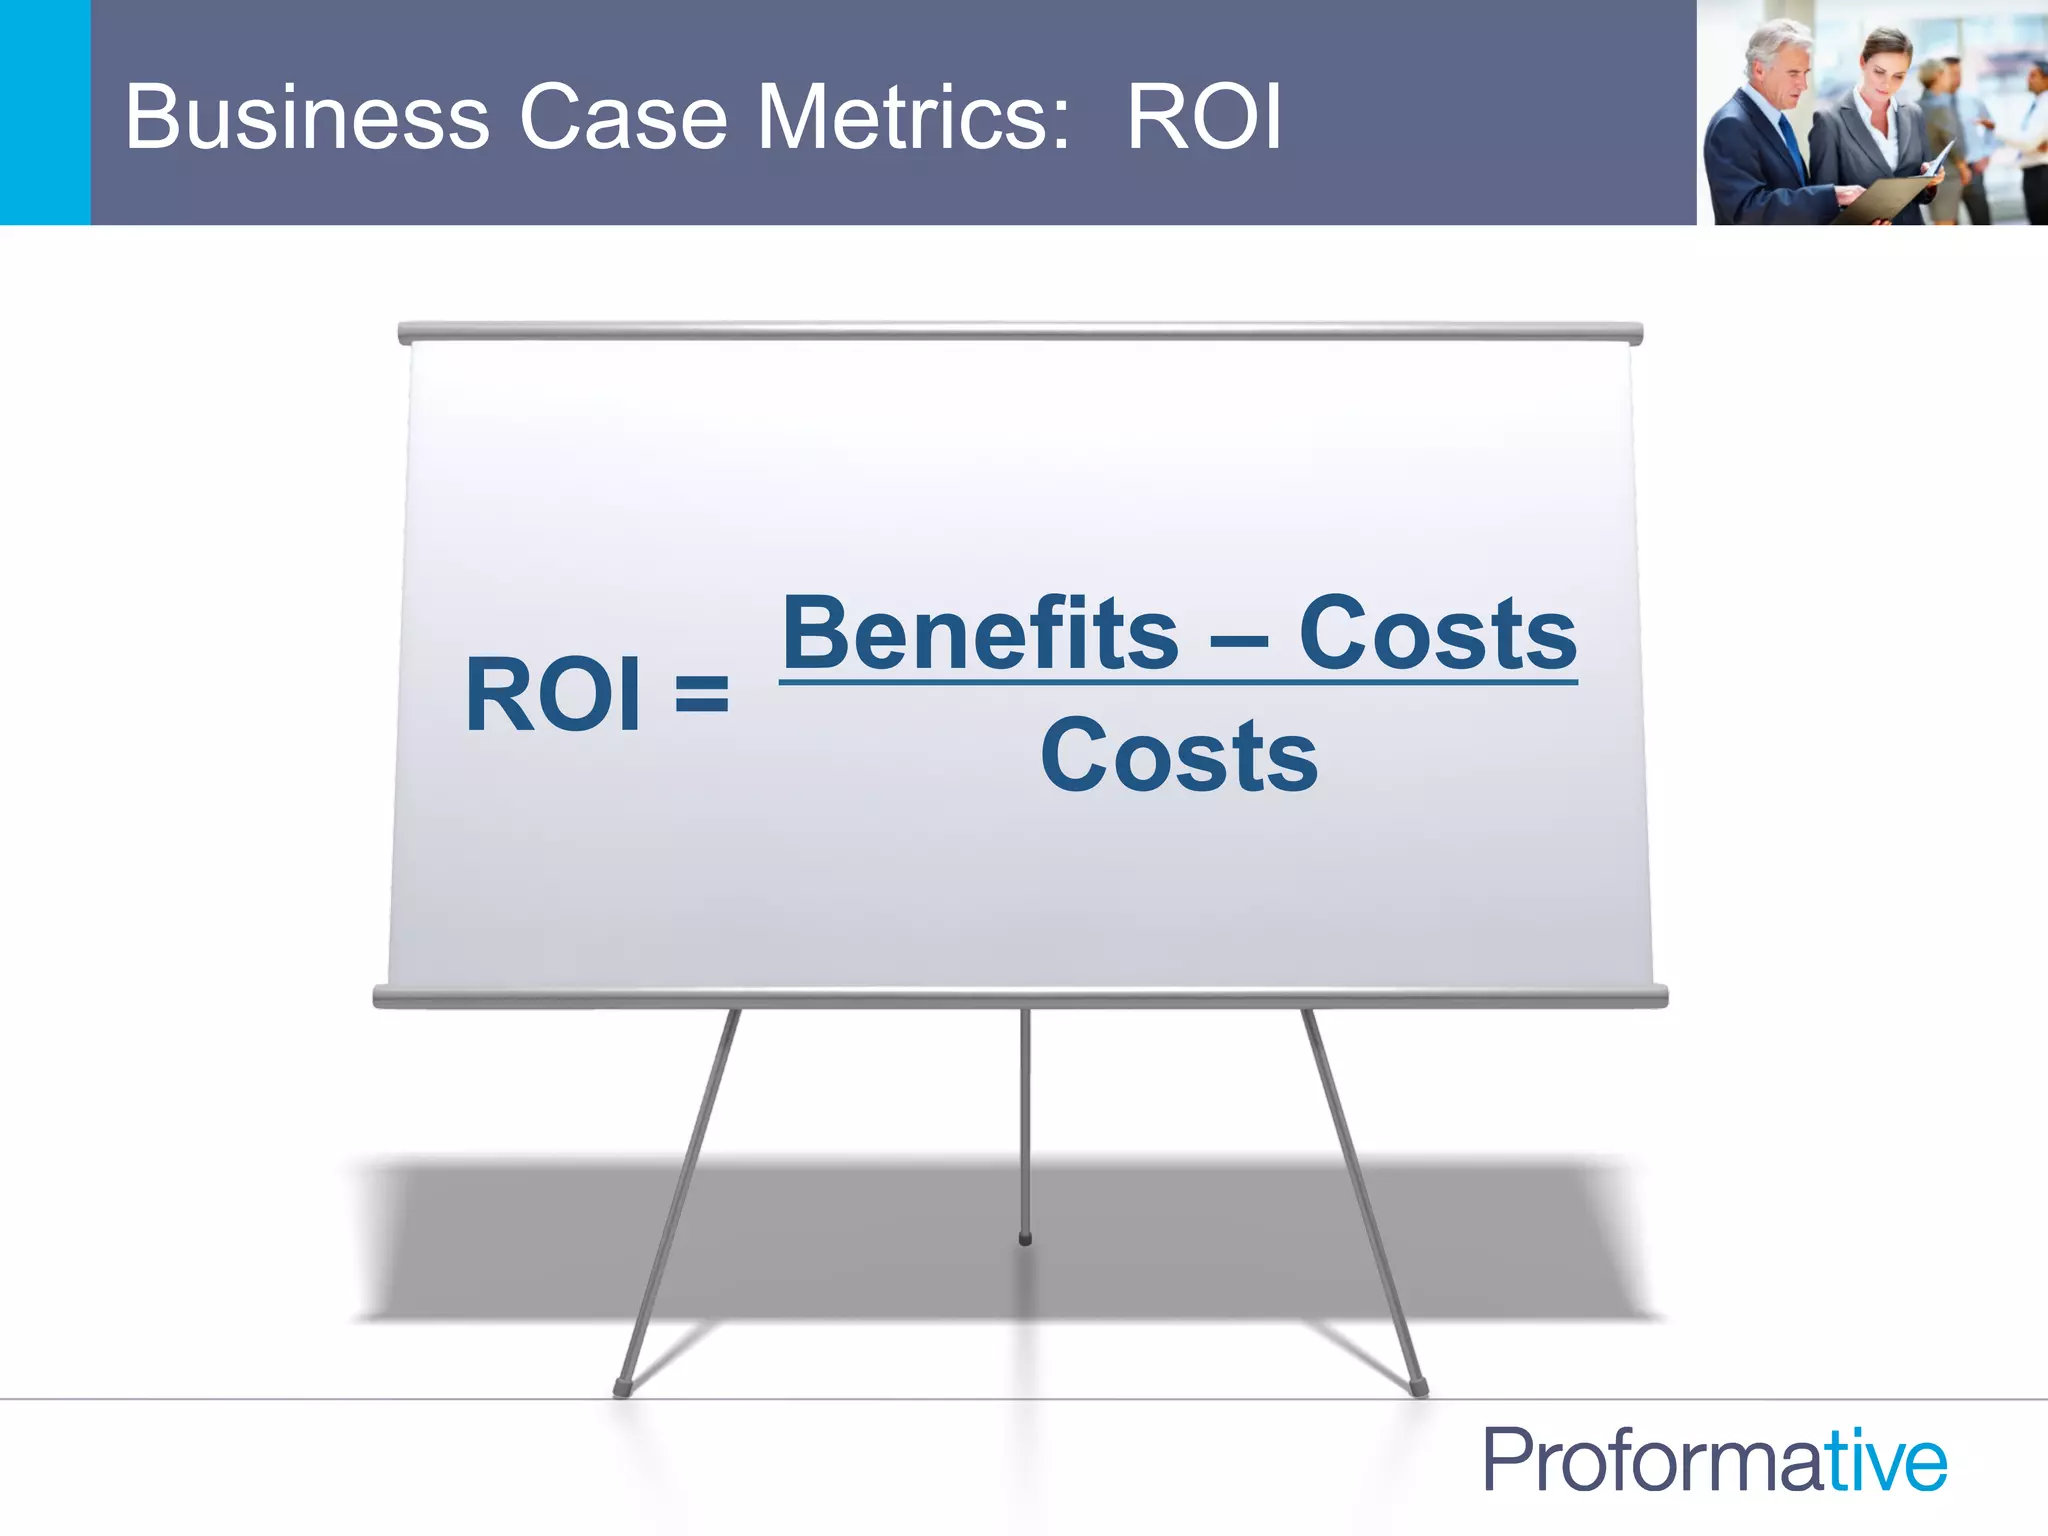
![Meaningful Financial Metrics
10
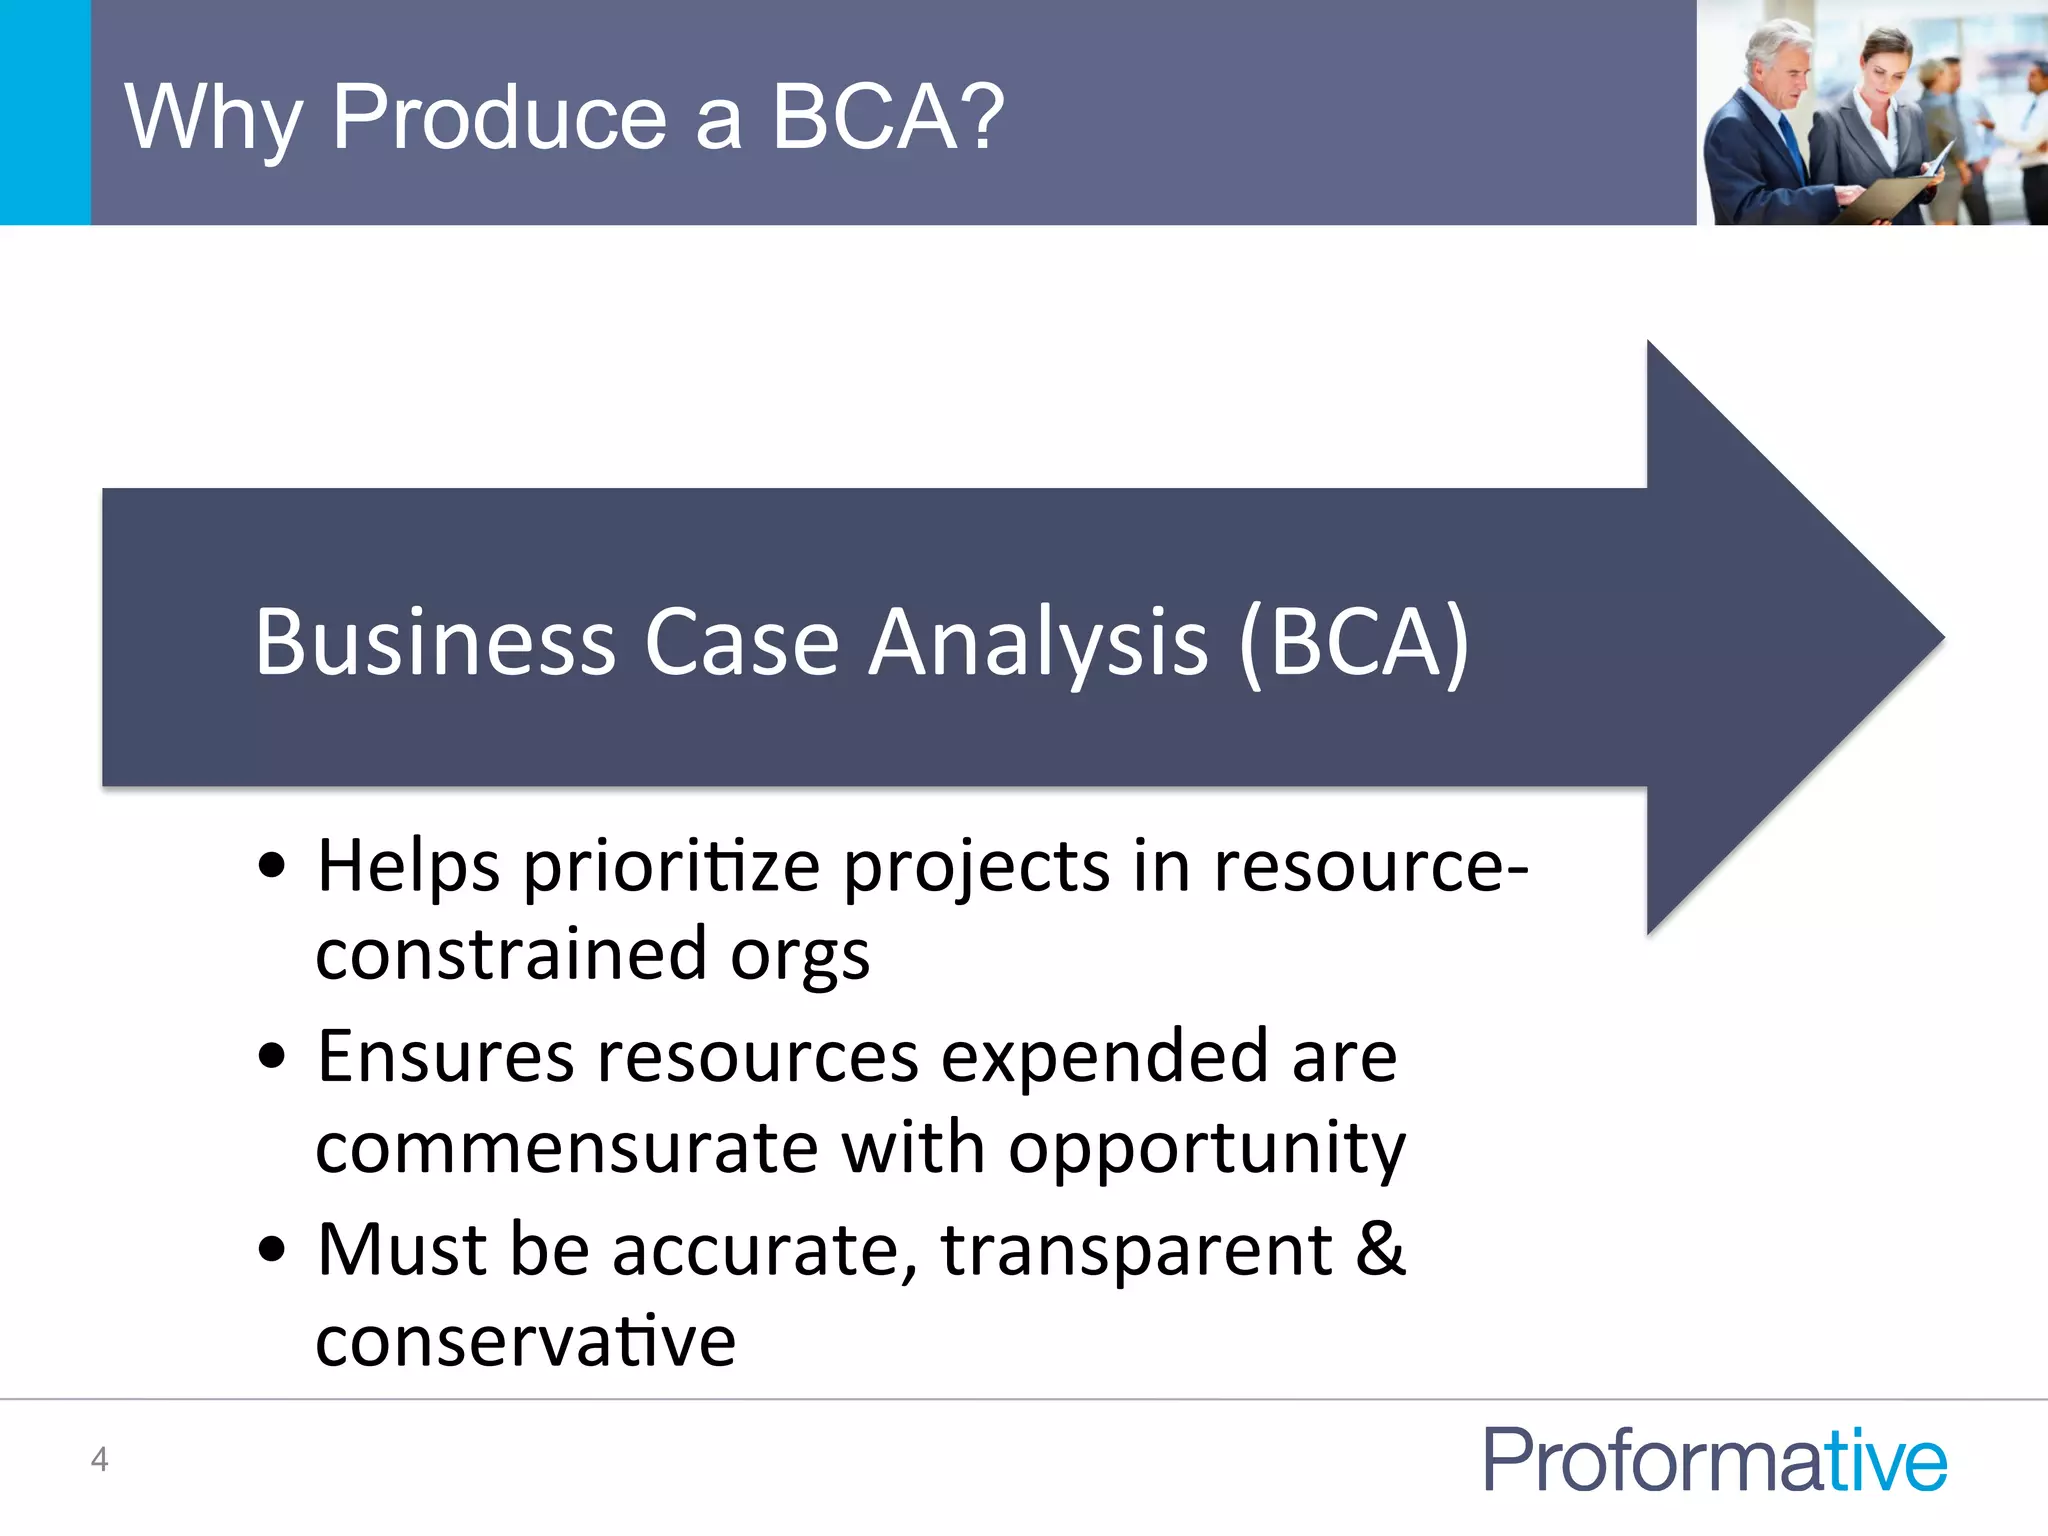
Return
on
Investment
(ROI)
• [Total
Net
Benefits
–
Total
Costs]
/
[Total
Costs]
• Does
not
take
into
account
Nme
value
of
money
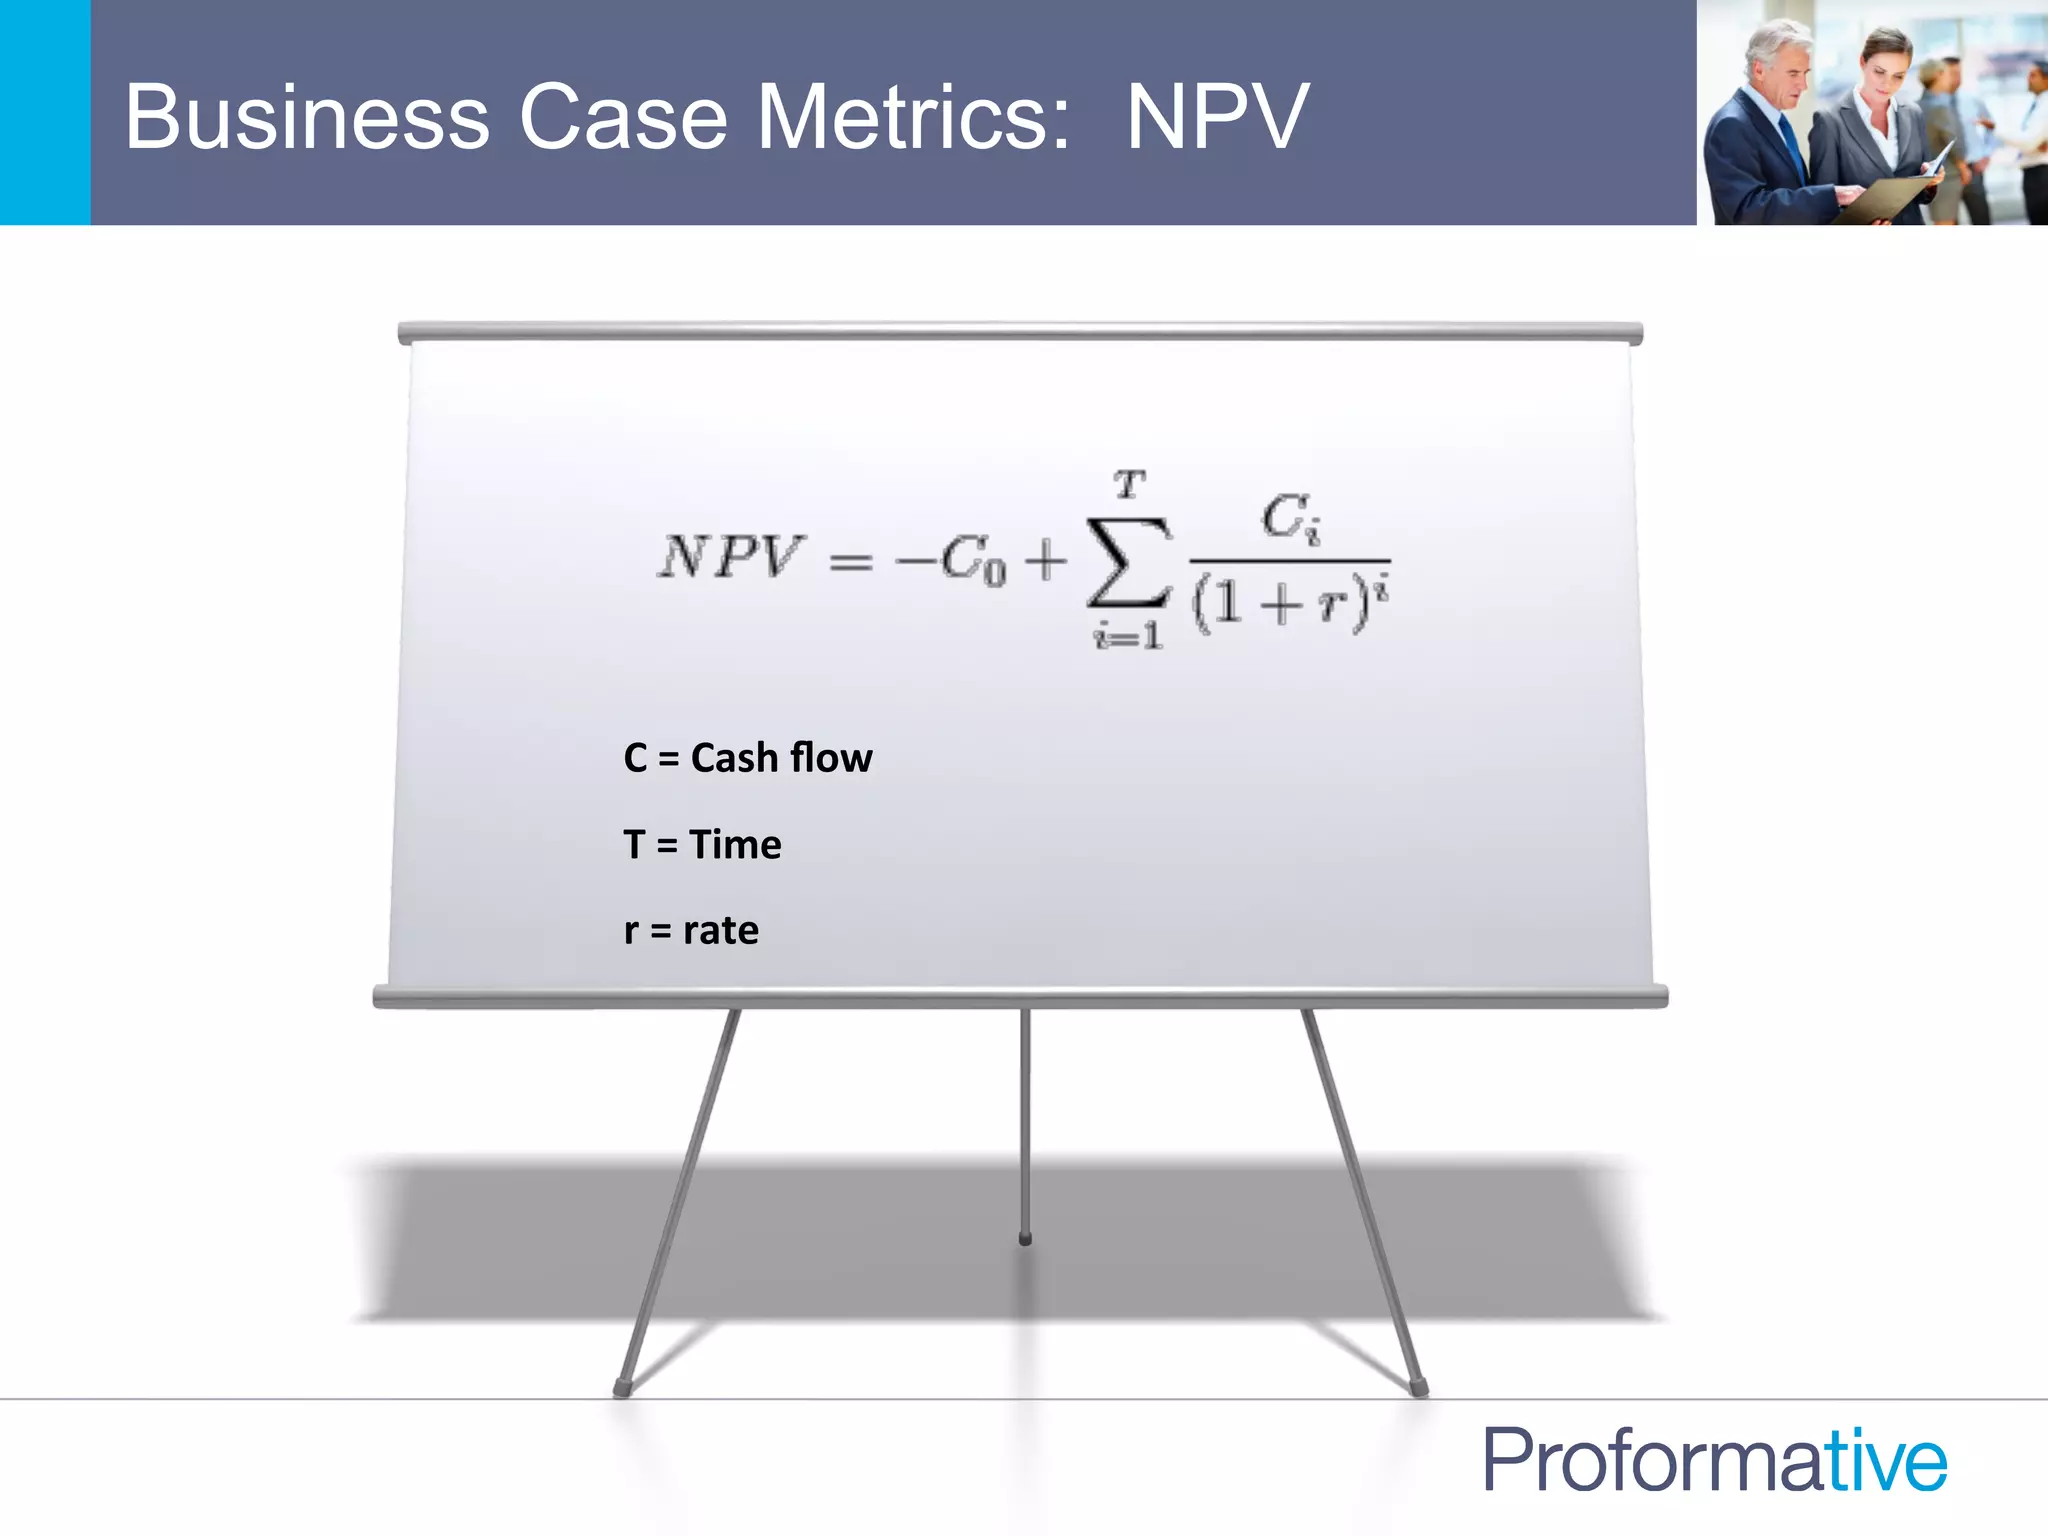
Net
Present
Value
(NPV)
• Uses
cost
of
capital
to
discount
to
“current”
dollars
• NPV
<
0
is
by
definiNon
a
poor
investment
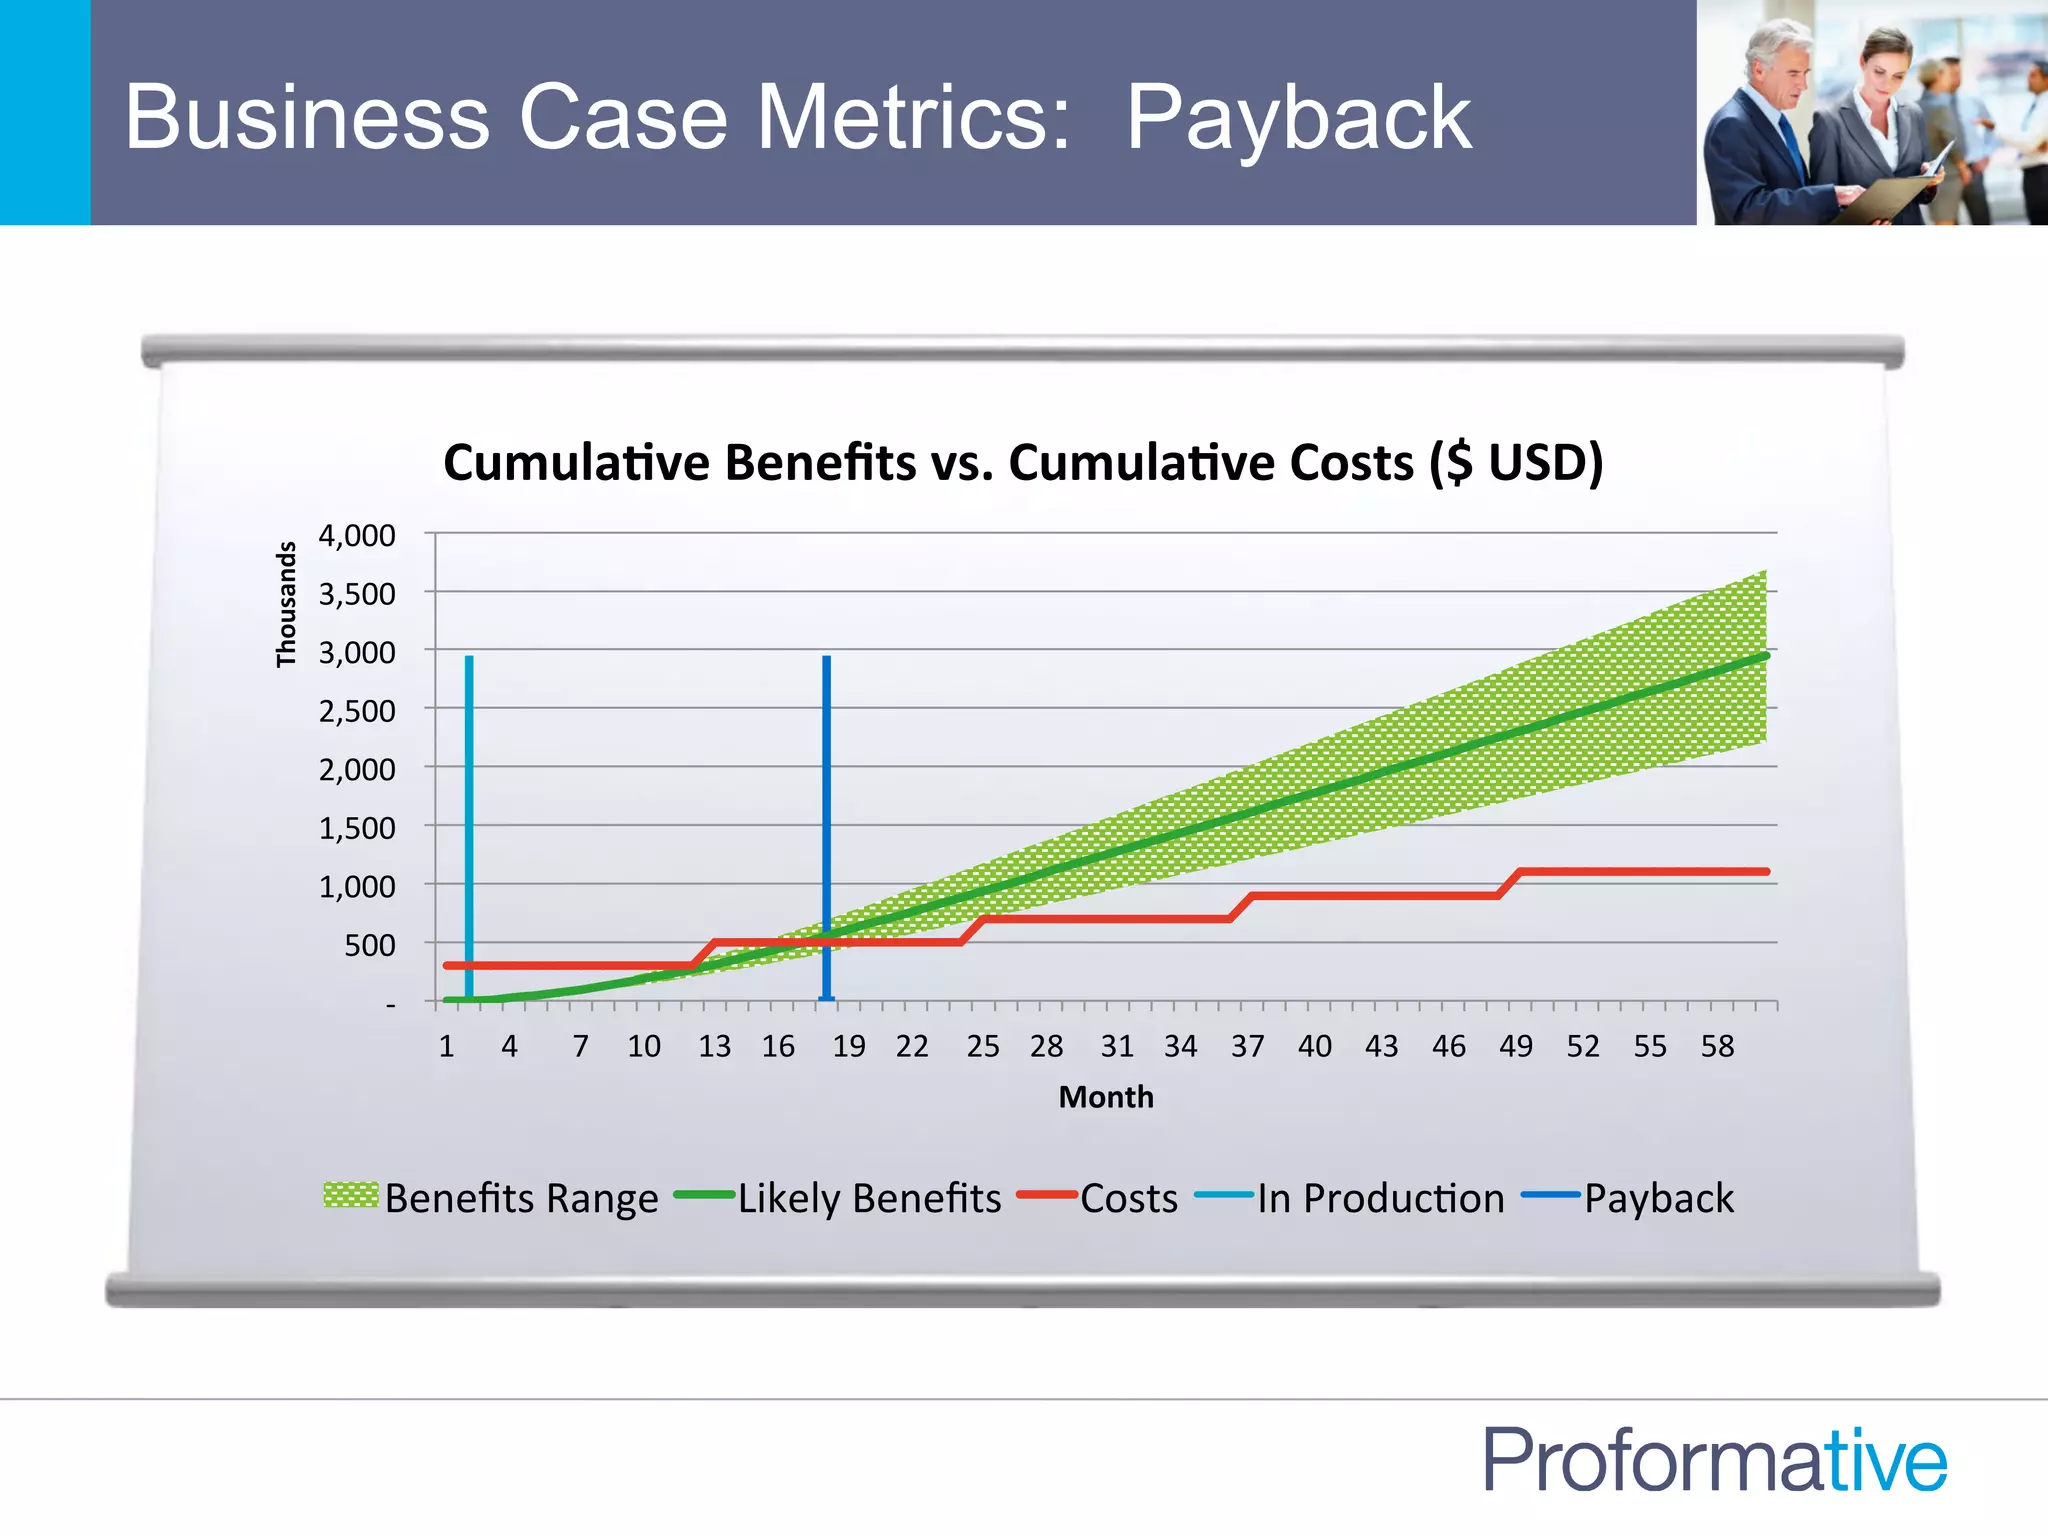
Payback
Period
• Net
benefit
crosses
from
negaNve
to
posiNve
• CriNcal
if
expediNous
return
of
capital
is
needed!
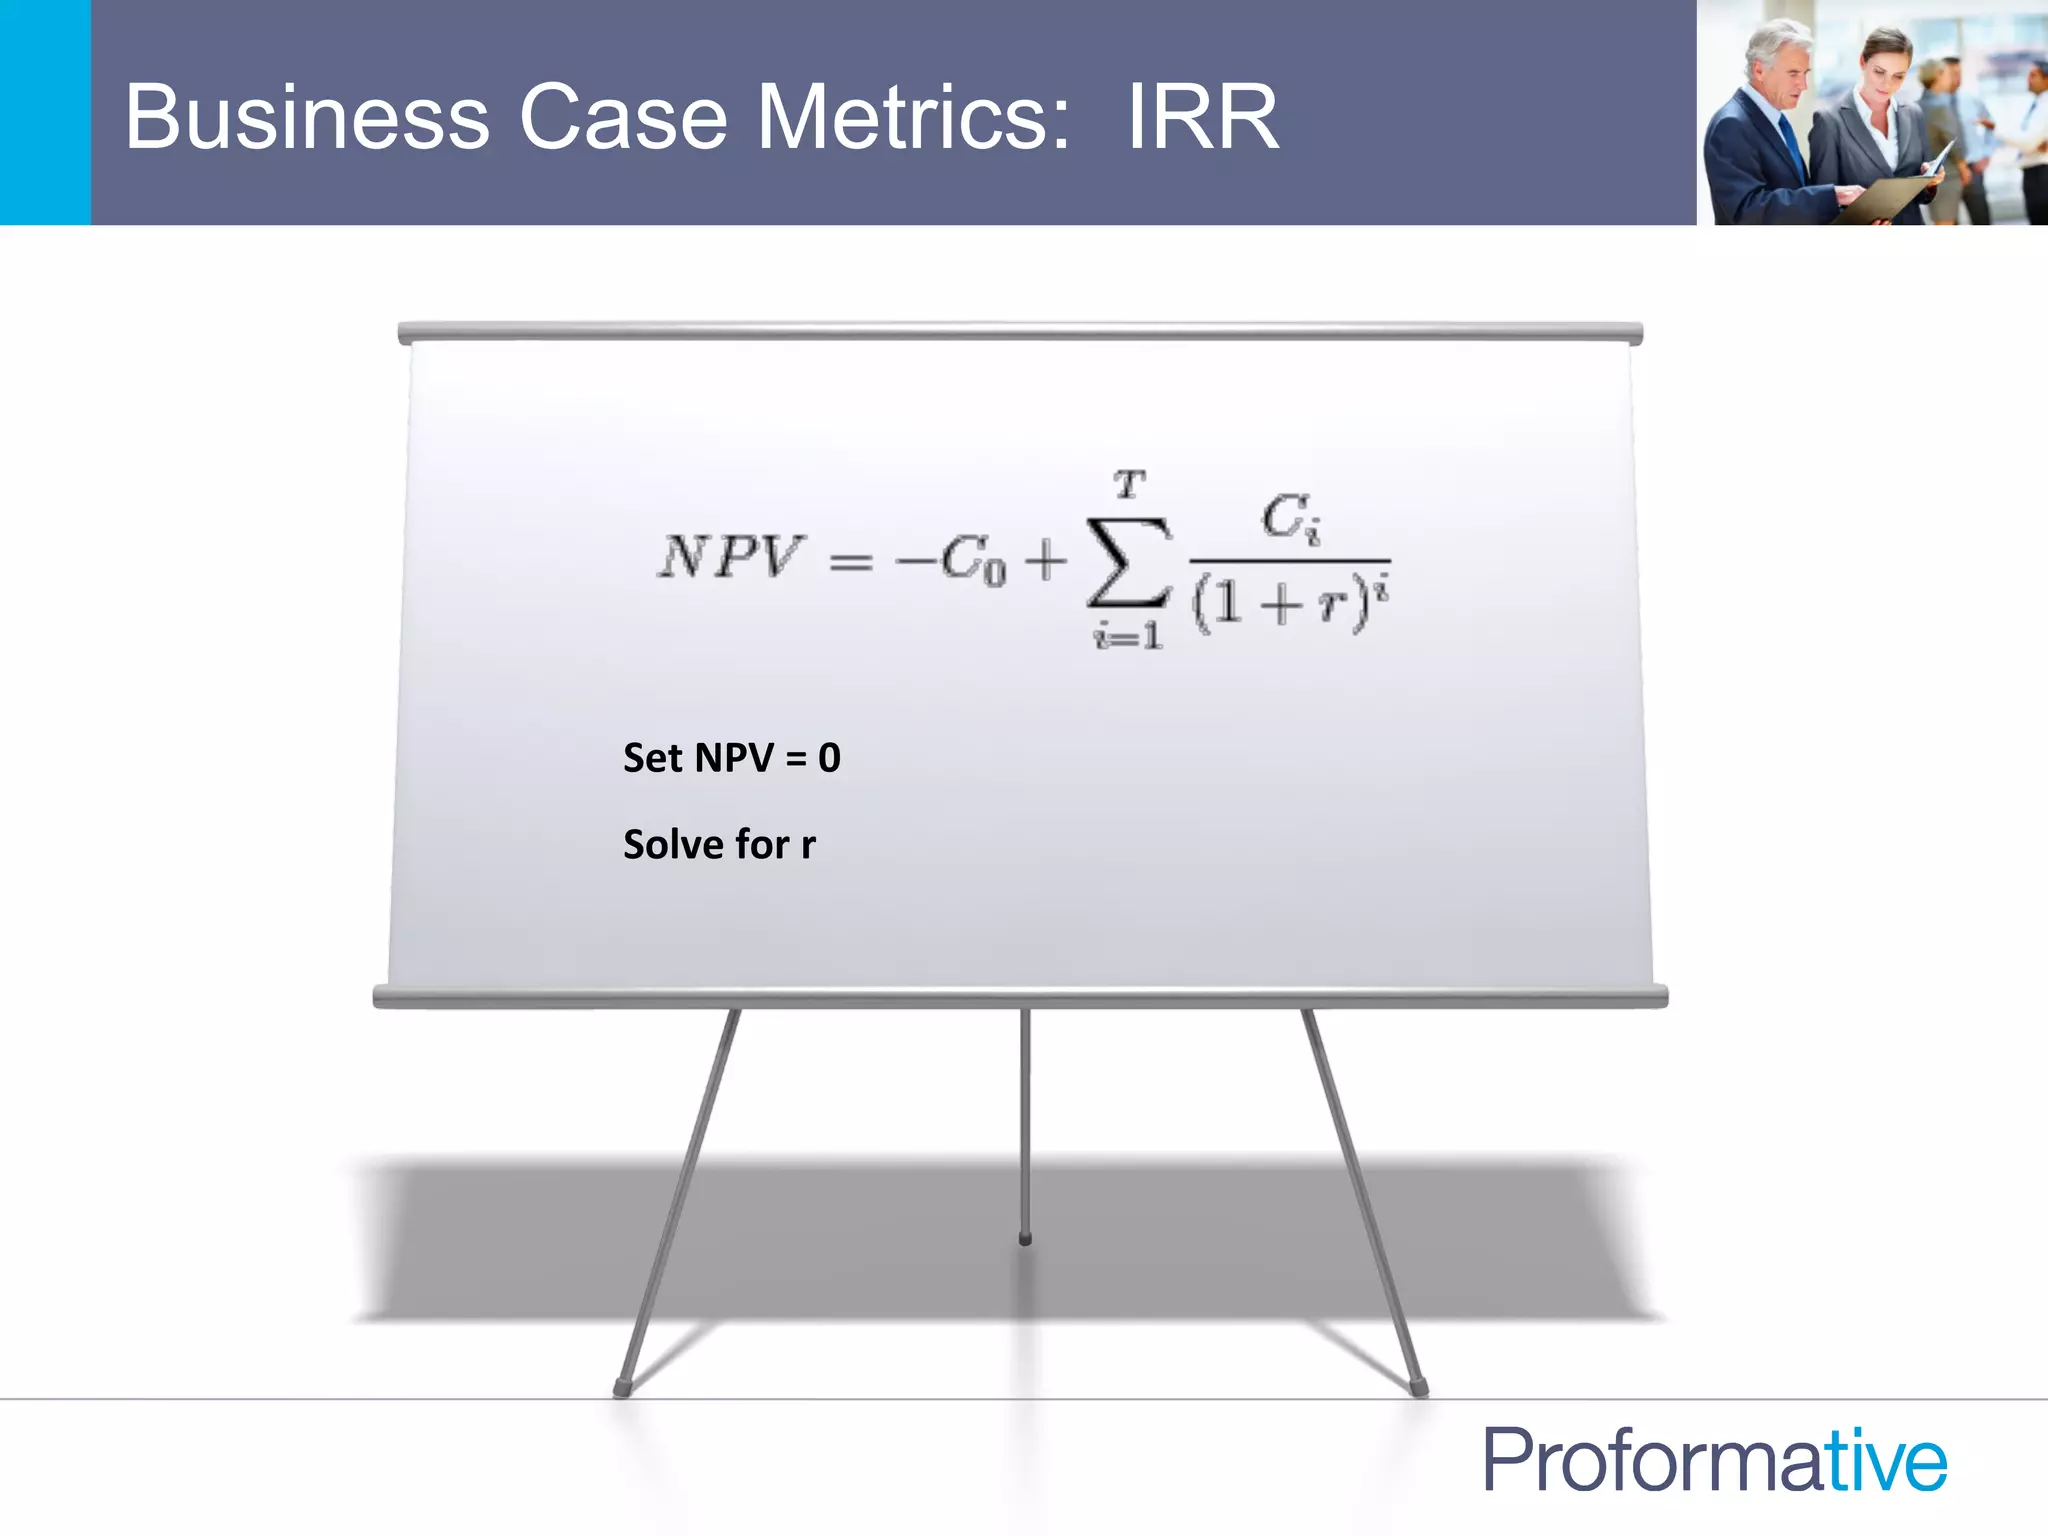
Internal
Rate
of
Return
(IRR)
• Discount
rate
where
NPV
=
0](https://image.slidesharecdn.com/gotransversebusinesscaseanalysisfortechinvestments-151109213948-lva1-app6891/75/How-to-Build-a-Great-Cloud-SaaS-Business-Case-Analysis-for-Technology-Investment-10-2048.jpg)


The document discusses the significance of Business Case Analysis (BCA) for technology investments, highlighting that many IT projects face severe cost and schedule overruns, contributing to substantial financial losses. It outlines the components of effective BCA, key financial metrics, and the benefits of cloud vs. on-premise solutions, emphasizing accuracy, transparency, and scenario planning in decision-making. Ultimately, it underscores the need for thorough evaluation and strategic planning to maximize investment outcomes.


