Download to read offline
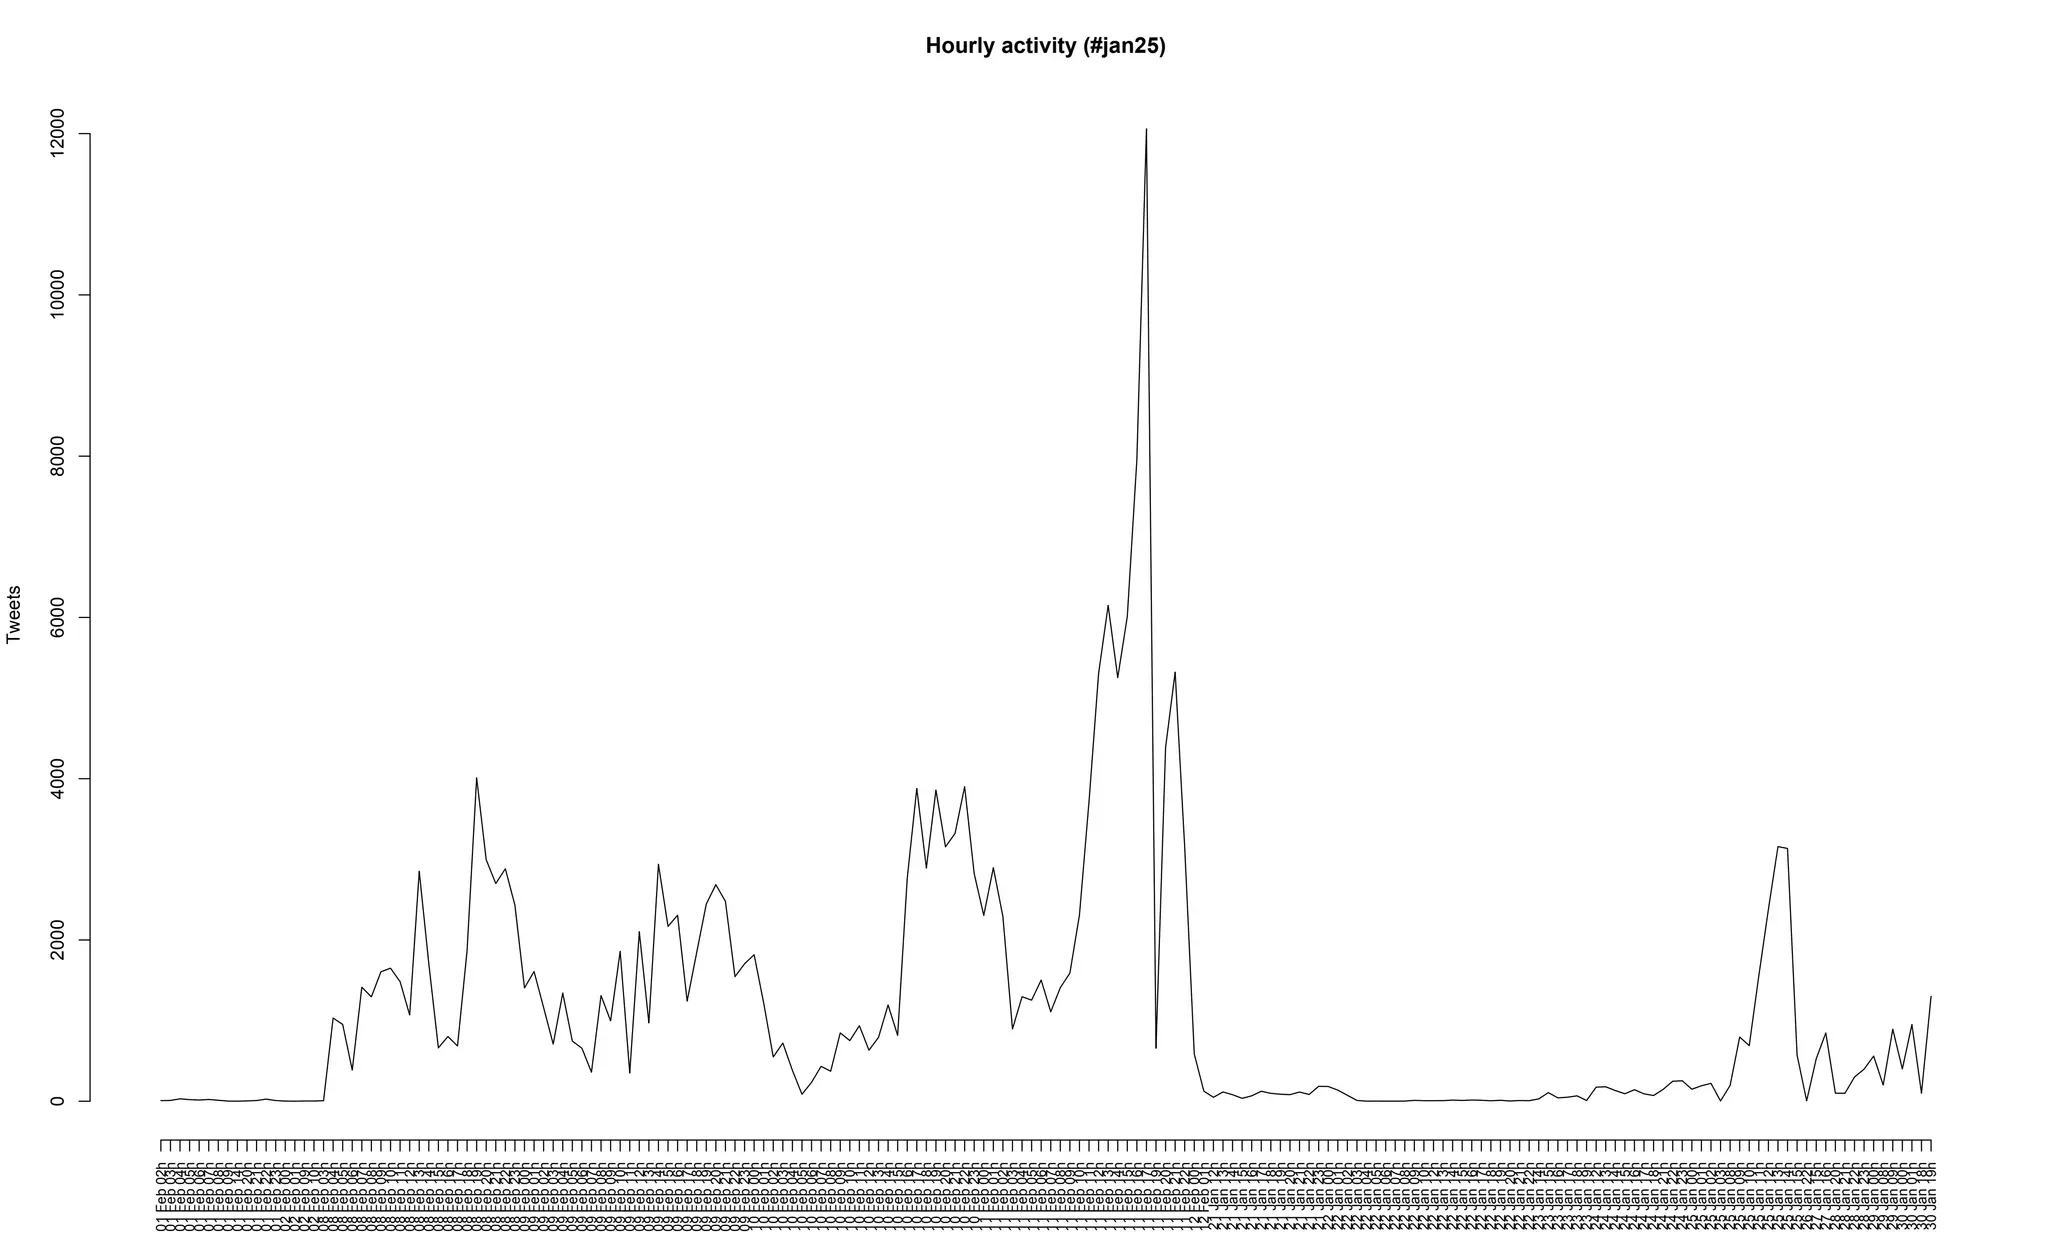

The document shows a line graph of the hourly number of tweets over a period of time, ranging from around 0 to 12,000 tweets per hour. The x-axis is labeled with dates from January 21st to February 12th, while the y-axis measures the number of tweets. There are peaks in tweet activity at various points, such as around January 25th which is labeled as "#jan25" on the graph.


![Vibe Coding vs. Spec-Driven Development [Free Meetup]](https://cdn.slidesharecdn.com/ss_thumbnails/vibecodingvsspecdrivendevelopment-251209105622-43f455e7-thumbnail.jpg?width=640&height=640&fit=bounds)
