SlideShare a Scribd company logo
1 of 51
Hilterman et al. Child Adolesc Psychiatry Ment Health (2018)
12:15
https://doi.org/10.1186/s13034-018-0222-7
R E S E A R C H A R T I C L E
Supervision trajectories of male juvenile
offenders: growth mixture modeling on SAVRY
risk assessments
Ed L. B. Hilterman1,2,3* , Ilja L. Bongers1,2, Tonia L.
Nicholls4,5 and Chijs van Nieuwenhuizen1,2
Abstract
Background: Structured risk/need assessment tools are
increasingly used to orientate risk reduction strategies with
juvenile offenders. The assumption is that the risk/need items
on these tools are sufficiently sensitive to measure
changes in the individual, family and/or contextual
characteristics of juvenile offenders. However, there is very
little
research demonstrating the capacity of these tools to measure
changes in juvenile offenders. Congruent with the
developmental and life-course criminology theories (DLC) the
objective of this study is to explore the existence of
heterogeneous trajectories of juvenile offenders across the
juvenile justice system as measured through five empirical
risk/need areas based on the Structured Assessment of Violence
Risk in Youth (SAVRY ), one of the most widely applied
risk assessment tools for juveniles.
Methods: This longitudinal study included 5205 male juvenile
offenders who transitioned through the Catalan
juvenile justice system between 2006 and 2014. During
intervention they received at least two, and a maximum of
seven, consecutive SAVRY risk/need assessments over an 18-
month period. The heterogenei ty of latent class trajecto-
ries was explored through growth mixture modeling (GMM).
The trajectory class membership was linked to covariates
through multinomial logistic regression analyses.
Results: Through GMM three to four heterogeneous trajectories,
with high quality of separation, were identified in
each of the risk/need areas. The trajectories with low risk/needs
(45–77% of the sample) remained low and presented
a very limited increase in risk/needs during the 18-month
period. The high risk/need trajectories (20–37% of the
sample) showed a limited decrease or no change. Between 5 and
13% of the sample had large reductions in their risk/
needs levels, and approximately 5% showed a large increase in
risk/needs.
Conclusions: In line with the DLC theories this study shows
that trajectories on criminogenic risk/needs can be
heterogeneous and indicate distinct rates of change over time.
The results of this study also may suggest a limited
sensibility to measure change over time of SAVRY’s risk and
protective items. Suggestions to improve the sensitivity of
measuring change over time, such as shorter time frames or
future-oriented time frames for the scoring of the items,
are offered.
Keywords: Dynamic risk factors, Juvenile offenders, Growth
mixture modeling, Risk assessment, Risk/need
trajectories, SAVRY
© The Author(s) 2018. This article is distributed under the
terms of the Creative Commons Attribution 4.0 International
License
(http://creativecommons.org/licenses/by/4.0/), which permits
unrestricted use, distribution, and reproduction in any medium,
provided you give appropriate credit to the original author(s)
and the source, provide a link to the Creative Commons license,
and indicate if changes were made. The Creative Commons
Public Domain Dedication waiver (http://creativecommons.org/
publicdomain/zero/1.0/) applies to the data made available in
this article, unless otherwise stated.
Background
Juvenile offenders have been characterized as ‘moving
targets’ [1]. This refers to the short-term behavioural
change juvenile offenders can exhibit, and reflects the
particular importance of dynamic criminogenic needs for
the orientation of risk reduction strategies with adoles-
cents. Especially in violence risk assessment with juvenile
offenders these criminogenic needs gained importance
in the shift from a prediction-oriented model to a need-
oriented model. Validated risk and need assessment tools
Open Access
Child and Adolescent Psychiatry
and Mental Health
*Correspondence: [email protected]
3 Justa Mesura, Consultancy & Applied Research, Barcelona,
Spain
Full list of author information is available at the end of the
article
http://orcid.org/0000-0001-5187-3328
http://creativecommons.org/licenses/by/4.0/
http://creativecommons.org/publicdomain/zero/1.0/
http://crossmark.crossref.org/dialog/?doi=10.1186/s13034-018-
0222-7&domain=pdf
Page 2 of 15Hilterman et al. Child Adolesc Psychiatry Ment
Health (2018) 12:15
played an important role in this change [2]. According to
the need-oriented model, risk and need assessment tools
are used to guide risk reduction strategies that target spe-
cific criminogenic needs that are relevant in individual
cases [3]. The underlying assumption is that the targeted
risk and need factors have the capacity to change and
that these variables, as defined on risk assessment meas-
ures, are sensitive to change over time.
Adolescent offending trajectories can change under the
influence of emotional processes [4], intimate relations,
neighbourhood and community processes, and life-
events related to family, education or work [5]. As a result
of these processes and life-events changes in offending
trajectories during adolescence are common [5] and can
have distinct implications such as desisting, escalating,
and persisting trajectories [6]. Also the involvement in
the juvenile justice system can have effects on desist-
ence or persistence in delinquent behaviour. Juvenile
justice programs are intended to reduce juvenile delin-
quency. However, these programs often are unavailable
or poor in quality [7] or do not sufficiently address the
criminogenic needs of the juveniles [8]. Illustrating these
problems, Viljoen et al. found that treatment received by
juvenile offenders was not associated with change in their
risk/needs [9]. It is important to match treatment to the
individual’s risk/needs, after a comprehensive risk/need
assessment [10].
The Structured Assessment of Violence Risk in Youth
(SAVRY) [11] is one of the most widely used risk and
need assessment tools for juvenile offenders. Unfortu-
nately, there is very little known about the extent to which
SAVRY is capable of measuring the changes that juvenile
offenders experience during adolescence. In a retro-
spective study in Canada, Viljoen et al. [12] found that
approximately one-third part of the sample of 163 juve-
nile sex offenders, who attended a residential cognitive-
behavioural program, showed a decrease in their average
scores on the SAVRY dynamic risk items and 8% had an
increase on the average scores of the protective items.
In a longitudinal study with male (n = 107) and female
(n = 49) juvenile offenders, Viljoen et al. [13] reported
that SAVRY reassessments during the probation period
were no more predictive than the initial assessment at the
start of the probation, suggesting that the average change
in risk/needs between the two moments in time had no
influence on the predictive validity of the risk assessment.
In another Canadian study of 146 juvenile offenders
(69.2% male) on probation, Viljoen et al. [9] found that
the SAVRY mean-level change scores (baseline scores
minus follow-up scores) of the risk and protective items
showed limited internal sensitivity to change (i.e., change
over time).
These studies were based on the assumption that
change trajectories are homogeneous and reflect lin-
ear change within the population of interest. However,
if change trajectories are not homogeneous but het-
erogeneous and consist of distinct change trajectories,
for example one group with decreasing risk scores and
another with increasing scores, the averaging change
scores across subgroups could disguise changes, falsely
indicating there is no transition over time. The identifica-
tion of heterogeneous trajectories of change over time is
congruent with the developmental and life-course crimi-
nology theories (DLC) [14]. According to the DLC theo-
ries, the assessment of developmental trajectories of ri sk
and protective factors through longitudinal research can
assist in the understanding of within-individual changes
over time [15].
Following the DLC theories on the heterogeneity of
developmental trajectories, the current study explored
the existence of heterogeneous trajectories measured
by risk and protective items of male juvenile offenders
assessed on SAVRY [11]. The principal research ques-
tion of this study was: Are there distinct developmental
trajectories of male juvenile offenders across the juvenile
justice system measured through five empirical risk/need
domains based on SAVRY items? Our second question
examined whether antecedents (e.g., prior violent and
non-violent offenses, previously detained), demograph-
ics (e.g., age) and characteristics of the transition through
the juvenile justice services could differentiate between
any trajectories that emerged.
Methods
Sample
The multiyear sample consisted of 5205 male juvenile
offenders for whom at least two SAVRY risk assess-
ments were completed by professionals of the Catalo-
nian juvenile justice system, in the period from January
2, 2006 until September 10, 2014. At the time of the first
SAVRY assessment the juveniles had an average age of
approximately 17 years (M = 17.64; SD = 1.40). When
they were charged for their first offense, their mean age
was 15.72 years (SD = 1.13). The majority of the sample
was of Spanish origin (n = 2883, 55.4%); the remainder
were of European (n = 191, 3.7%), African (n = 1065,
20.5%), South American (n = 989, 19.0%) or Asian
(n = 77, 1.5%) origin. The mean total score of the first
SAVRY assessment was 16.08 (SD = 9.24), with a range
from 0 to 45 (theoretical range 0–48). The average total
score of the protective factors was 2.71 (SD = 1.95), with
a range of 0 to 6. Before the first SAVRY assessment,
86.2% (n = 4489) of the male juveniles had been charged
with at least one violent offense (M = 4.51, SD = 5.10,
Mdn = 3.00), and 68.0% (n = 3541) with at least one
Page 3 of 15Hilterman et al. Child Adolesc Psychiatry Ment
Health (2018) 12:15
non-violent offense (M = 4.05, SD = 4.83, Mdn = 3.00).
The proportion of juveniles with a history of youth deten-
tion was 17.3% (n = 898, M = 2.91, SD = 2.64). Measured
on the number of imposed sentences (N = 13,228), the
average duration of community probation in the research
period was approximately 12 months (M = .97 year,
Mdn = .74, SD = .71), and the average duration of deten-
tion (N = 7221) in a youth detention centre was .64 years
(Mdn = .49, SD = .69).
Between 2006 and 2014 a total of 79,223 SAVRY
assessments were completed for the sample. Due to the
different duration of penal interventions the juveniles
had been subject to a variable number of consecutive
SAVRY assessments during their juvenile justice inter-
vention. At the start of the intervention all juveniles had
at least two consecutive SAVRY risk assessments, 85.23%
(n = 4436) had three consecutive assessments, 66.67%
(n = 3470) had four assessments, 50.70% (n = 2639) had
five assessments, 38.89% (n = 2024) had six assessments
and 30.41% (n = 1583) had seven consecutive SAVRY
assessments over the 18 month study period. The total of
SAVRY assessment included in this study was 24,562.
Setting
The Catalonian Justice department administers sentences
for adults and juveniles in Catalonia, Spain. The juvenile
sector is divided into three sections, pre-trial assessment,
probation, and custody. The pre-trial assessment section
is divided into eight units that work in close collaboration
with the office of the public prosecutor. The probation
section, with nine juvenile probation units, is responsible
for the administration of all community sanctions. Llib-
ertat vigilada, or community probation, is the most fre-
quently imposed sanction. The custody section consists
of six youth detention centres. Juveniles from the dif-
ferent settings of the juvenile system are not necessarily
distinct groups. For instance, after detention in a custo-
dial setting, juveniles always have community probation
and juveniles who violate the conditions of the probation
can be transferred to a custodial setting. The interven-
tion most often applied during the research period was
probation supervision, 10.7% of juveniles were also sen-
tenced to detention. Juvenile justice professionals could
apply treatment components like group or individual
programs directed towards violent or sexual offenders,
mental health problems, drug abuse, and/or family prob-
lems (Fig. 1).
Measures
Structured Assessment of Violence Risk in Youth (SAVRY)
[11, 16] is a risk assessment tool in the structured pro-
fessional judgment (SPJ) tradition. The SAVRY contains
24 risk items and 6 protective items. Each risk item is
scored on a 3-point scale; low (0), moderate (1) or high
risk (2). Protective items are scored present (1) or absent
(0) (note—for interpretation purposes protective items
have been reverse scored). The final summary risk rating
is the product of a clinical reflection on the basis of the
information gathered on the particular juvenile and is not
based on a sum score. For research purposes, the risk and
protective items can be summed up into total scores with
a range from 0 to 48, and 0 to 6, respectively.
Results regarding inter-rater reliability (intraclass cor-
relation coefficients (ICC), two way random effects model
for absolute agreement and single raters) with SAVRY in
the Catalonian juvenile justice system have been pub-
lished elsewhere and ranged from .93 for the historical
items to .57 for the protective items [17]. Intraclass corre-
lations are often interpreted as follows: < .40 = poor; .40
to .59 = fair; .60 to .74 = good; and .75 to 1.00 = excel-
lent [18].
Instead of relying on the conceptual subscales of
SAVRY proposed by the authors for the current study we
used a gender sensitive order of the SAVRY items as per
their categorization into five factors representing specific
risk/need areas based on prior research (see Fig. 1) [17].
Three fit indices were used to assess the fit of the factor
models: the comparative fit index (CFI), the Tucker–
Lewis index (TLI) and a root mean square of approxi-
mation (RMSEA), CFI and TLI exceeding .90, indicate
acceptable fit, while values close to .95 are recommended
[19]. A RMSEA value close to .06 indicates a good fit [19].
In exploratory factor analyses performed in Mplus [20],
both models had a good fit (Males: CFI = .96; TLI = .94;
RMSEA = .053, 90% CI .051, .055); females: (CFI = .95;
TLI = .94; RMSEA = .049, 90% CI [.044, .054]) these
were replicated in confirmatory factor analyses with
the validation sample (Males: CFI = .94, TLI = .93,
RMSEA = .059, 90% CI [.058, .061], females: CFI = .91,
TLI = .90, RMSEA = .063, 90% CI [.058, .068]). The five
risk/needs areas had good internal consistency for both
genders (between .81 and .71 for males and .82–.70 for
females). For the growth mixture modeling the SAVRY
items of each of the five risk/need areas were summed
up and divided through the theoretical range of the scale,
which resulted in a score between 0 and 1. The SAVRY
assessments were obtained from a database that is part
of the electronic information system of the Catalonian
Juvenile Justice system (Sistema d’Informació de Justícia
Juvenil, SIJJ). All data were anonymized to avoid identifi -
cation of participants.
Criminal history data and the below listed covariates
were collected for each individual from the information
systems for juvenile and adult offenders of the Catalonian
Department of Justice. These official databases include
Page 4 of 15Hilterman et al. Child Adolesc Psychiatry Ment
Health (2018) 12:15
records of impending prosecutions, convictions, and the
process of the execution of sanctions.
Age at first assessment reflects the date of the first
SAVRY assessment.
Prior offenses were classified as violent versus non-vio-
lent as defined in the SAVRY manual and were measured
by the number of criminal charges registered before the
first SAVRY assessment. Because prior violent offenses
and non-violent offenses were Poisson distributed both
variables were recoded into four categories: 0 = zero
prior offenses, 1 = first offenders with only one offense
preceding the first SAVRY assessment, 2 = 2–9 offenses
and 3 = 10 or more prior offenses. The first category,
Fig. 1 Factor solution for SAVRY risk and protective factors for
male and female juvenile offenders
Page 5 of 15Hilterman et al. Child Adolesc Psychiatry Ment
Health (2018) 12:15
zero prior offenses, was used as the reference category
for both variables.
Previous detention was measured as a dichotomous
variable, with “0” not previously detained, and “1” having
been detained before the first SAVRY risk assessment.
Number of sector changes An increase in the number of
sector changes between the three sectors of the juvenile
justice system is an indication of a problematic passing
through the system. Sector changes were measured from
the start of the transition through the juvenile justice sys-
tem, up until the last SAVRY risk/need assessment that
was performed. The minimum value was “0”, and the
maximum value was “3”.
Sentence duration During the research period the
average duration of community probation, the most fre-
quently imposed sanction, was approximately 12 months
(M = .97 year, Mdn = .74, SD = .71). The length of the
current sentence (sentence > 1-year) was measured as a
dichotomized variable with the 1-year average duration as
reference (1 = sentence > 1-year, 0 = sentence ≤ 1-year).
Procedure
According to the protocols that were developed for the
implementation of structured risk/need assessments in
the Catalonian juvenile justice system, professionals have
been using the SAVRY since 2006 for routine risk/need
assessments at different points before and during the
penal sanction: (a) during pre-trial assessment; (b) at the
start of a youth’s probation (llibertat vigilada) or deten-
tion; (c) every 3 months during the probation period or
the youth’s detention; and (d) at the end of the sentence
when the last assessment is performed. Following the
method of structured professional judgment, SAVRY
risk/need assessment was used to identify relevant goals
for the intervention with every individual. From 2006
until 2008 the SAVRY was gradually implemented in the
whole Catalonian juvenile justice sector. Before using
SAVRY, all professionals (i.e., youth probation offic-
ers, group leaders, social workers and psychologists)
received 20 h of risk assessment training. After the train-
ing, individual supervision was provided. Approximately
1–2 years after the initial training professionals partici -
pated in an advanced training to refresh practical and
theoretical knowledge. Professionals also received ongo-
ing training on how to target criminogenic needs during
intervention.
Statistical analysis
Growth mixture modeling (GMM) in Mplus 7.1 [20] was
used to examine the existence of trajectory heterogeneity
in the risk and need developmental pathways of juvenile
offenders during their intervention in the juvenile justice
system. For each possible class GMM estimates the level
of the initial status (intercept), linear change over time
(linear slope) and nonlinear change over time (quadratic
slope) and for each variable the variance and covari -
ance’s were estimated. A slope that is significantly differ -
ent from zero indicates change over time. Change has
a linear form when the trajectory is constant across the
time points (linear slope) or a nonlinear curvature form
(quadratic slope) when the slope describes accelerating
or decelerating trajectories.
The number of latent trajectory classes was estimated
using three indicators: the Bayesian Information Crite-
rion (BIC), the Lo-Mendell-Rubin adjusted likelihood
ratio test and the class size. A model with a lower BIC
value performs better in terms of taking into account
both fit and parsimony. The BIC was preferred over the
adjusted BIC because of its better performance with con-
tinuous outcomes [21]. The Lo-Mendell-Rubin adjusted
likelihood ratio test (LMR-LRT) compares the fit of the
model with one more class to the previously estimated
model with one less class. A significant p value of the
LMR-LRT indicates that the model with one less class
is rejected in favor of the model with one more class.
To avoid small classes, models with a class size smaller
than 3.0% were rejected as larger classes are preferred to
smaller classes which can be less meaningful [21].
The entropy and the average posterior latent class prob-
abilities were used to assess the quality of the trajectory
classifications. Both indices have a range between 0 and
1; higher values indicate a better separation between the
classes. Entropy values of .80, .60 and .40 indicate high,
medium and low class separation [22]. The average latent
class probability for each class reflects the highest prob-
ability of each individual assigned to a particular class. To
avoid incorrect class solutions due to ‘local maxima’ all
models were replicated twice using the seed values from
the highest log-likelihood values as described by Aspa-
rouhov and Muthen [23]. Through these replications it
was confirmed that the models were stable and the model
parameters were based on the global solution. Adoles-
cents with shorter sanctions have fewer SAVRY assess-
ments and consequently fewer data points. Elimination
of these juveniles from the research would have resulted
in the absence of juveniles with shorter sanctions. To
include these juveniles with less data points in the analy-
sis, the full-information maximum likelihood (FIML) was
used to estimate these missing data points of juveniles
whose penal sanctions were shorter than 18 months [24,
25].
The trajectory class membership of the five risk/needs
areas was linked to covariates through multinomial logis-
tic regression analyses. To eliminate non-significant vari-
ables from the equation the backward stepwise method,
with the lowest risk/need trajectory classes as reference
Page 6 of 15Hilterman et al. Child Adolesc Psychiatry Ment
Health (2018) 12:15
categories, was used. For the interpretation of the odds
ratio (OR) we followed the criteria suggested by previous
research [26] in which an OR with a value between 2 and
3 was considered small, 3–5 medium and above 5 large.
Results
Selection of the latent trajectory classes
For the risk/need areas antisocial behaviour, family func-
tioning and personality the linear model with intercept
and linear slope was sufficient to describe the model,
the incorporation of the quadratic slope in the model
resulted in LMR-LRT values that were not significant.
The models of the risk/need areas social support and
treatability improved after the incorporation of the quad-
ratic slope into the model. Because of the better fit of the
model, for the risk/need areas social support and treat-
ability we reported the model with the incorporation of
the quadratic slope, for the remaining risk/need areas the
model with the linear slope was reported. For each of the
risk/need areas, the optimal number of latent class trajec-
tories was estimated; fit statistics for the five models are
summarized in Table 1.
For the risk/need area antisocial behaviour the model
with three classes was preferred. Although the BIC con-
tinued to decrease and the LMR-LRT was significant for
the models with four classes, the four-class model identi-
fied a class that was too small (.5%, n = 28). The entropy
(.80) and average posterior probabilities, .93, .87 and .88,
for all three classes indicated a clear separation between
the trajectories. For the risk/need area family functioning
a three-class model fit the data best, a model with four
classes was rejected due to the non-significant LMR-LRT
(p = .16). The classification indices of the three-class
model of family functioning indicated a high quality of
separation between classes with an entropy of .89 and
average posterior probabilities of .97, .89 and .94, respec-
tively. For the personality risk/need area a model with
five classes was rejected by the LMR-LRT in favour of a
four-class model, moreover the five-class model had one
class that was too small (1.5%, n = 78). The entropy of
the four-class model was .69, and the average posterior
probabilities were .76, 80, .87 and .80 for the classes one
to four, indicating a slightly above medium quality of
class separation. For the risk/need areas social support
and treatability also the quadratic slope was included in
the model, this resulted in improved class separation and
indicated nonlinear development over time. The four-
class model fit the data best for the social support risk/
need area; the LMT-LRT rejected the five-class model,
which also had one too small class (2.1%, n = 111). For
treatability, the last risk/need area based on SAVRY, a
four-class model was also preferred. Although the BIC
value of the five-class model was smaller compared to
the BIC of the previous model, the difference was small,
as was the difference between the entropy values (5-class
model = .76, 4-class model = .75). The five-class model
contained one class which was under the 3.0% cut-off
value for the smallest class (2.2%, n = 114). The average
posterior probabilities of the four-class model were, .86,
.88, .84, and .84, respectively.
The developmental processes of the risk/needs areas
The latent class trajectories of the different risk/need
areas are shown in Fig. 2.
Table 1 Model fit indices for growth mixture models
Entropy and LMR-LRT are not applicable for the 1-class model.
The values in
italics indicate the selected model
BIC Bayesian Information Criterion, LMR-LRT Lo-Mendell-
Rubin adjusted
likelihood ratio test, Entropy average quality of classification
Model BIC LMR-LRT Entropy Smallest class %/(n)
Antisocial behaviour
1 − 42,552.08 n/a n/a n/a
2 − 43,352.39 p < .001 .91 .039 (202)
3 − 44,042.78 p < .001 .80 .040 (207)
4 − 44,209.88 p = .006 .84 .005 (28)
5 − 44,286.48 p = .33 .83 .006 (29)
Family functioning
1 − 50,973.55 n/a n/a n/a
2 − 52,575.68 p < .001 .87 .209 (1088)
3 − 53,646.03 p < .001 .89 .033 (170)
4 − 54,171.66 p = .16 .87 .027 (140)
5 − 54,506.86 p = .20 .90 .021 (111)
Personality
1 − 29,962.82 n/a n/a n/a
2 − 30,254.27 p < .001 .61 .318 (1653)
3 − 30,519.34 p < .001 .74 .157 (818)
4 − 30,721.70 p < .001 .69 .043 (222)
5 − 30,775.80 p = .081 .70 .015 (78)
Social support
1 − 24,159.37 n/a n/a n/a
2 − 24,714.14 p < .001 .72 .337 (1755)
3 − 25,136.04 p < .001 .80 .029 (151)
4 − 25,733.02 p < .001 .82 .053 (278)
5 − 25,913.54 p = .240 .82 .021 (111)
Treatability
1 − 18,466.19 n/a n/a n/a
2 − 18,845.24 p < .001 .65 .416 (2165)
3 − 18,996.01 p < .001 .67 .090 (468)
4 − 19,470.22 p < .001 .75 .049 (256)
5 − 19,559.41 p = .240 .76 .022 (114)
Page 7 of 15Hilterman et al. Child Adolesc Psychiatry Ment
Health (2018) 12:15
Antisocial behaviour
The largest class (mild persisters, 72.8%, n = 3788) was
characterized by a low initial status of antisocial behav-
iour (βintercept = .195, p < .001), which slowly increased
during the transition through juvenile justice (βlinear
slope = .002, p < .001; see Fig. 2). The second largest class
(High persisters, 23.2%, n = 1210) had a high initial status
of antisocial behaviour (βintercept = .604, p < .001) and did
not change during the study period (βlinear slope = − .001,
p > .05). The smallest group, the rapid escalators (4.0%,
n = 207) had a low initial status of antisocial behaviour
(βintercept = .214, p < .001), and escalated rapidly to a high
level (βlinear slope = .093, p < .001).
Family functioning
The largest group (76.8%, n = 4000) was mildly problem-
atic at the starting point (βintercept = .109, p < .001), and
during consecutive assessments slightly more problems
were detected (βlinear slope = .001, p < .01). The second
largest class (19.9%, n = 1035) was observed to be highly
problematic at the initial assessment (βintercept = .632,
p < .001), and this did not change over time (βslope = .002,
p > .05). The smallest group (3.3%, n = 170) was
Fig. 2 Latent class trajectories of the five risk/need areas based
on SAVRY risk and protective factors
Page 8 of 15Hilterman et al. Child Adolesc Psychiatry Ment
Health (2018) 12:15
increasingly problematic; the initial observation was
mildly problematic (βintercept = .177, p < .001), but during
subsequent assessments significant more problems were
observed (βlinear slope = .085, p < .001).
Personality
The largest class (60.7%, n = 3162) was initially char-
acterized by mildly problematic personality traits
(βintercept = .206, p < .001), which changed minimally
over the 18-months period (βlinear slope = − .003, p < .01).
The highly problematic class trajectory had a high start-
ing point (29.7%, n = 1546, βintercept = .596, p < .001)
and exhibited limited improvement during successive
assessments (βlinear slope = − .006, p < .001). The rapid
responders (5.3%, n = 275), had a high initial status
(βintercept = .648, p < .001), but improved rapidly dur-
ing the intervention (βlinear slope = − .087, p < .001). The
rapid escalators (4.3%, n = 222) started the trajectory as
a mildly problematic group (βintercept = .269, p < .001),
but rapidly became more problematic (βlinear slope = .076,
p < .001).
Social support
The mildly impaired integrators were the largest group
(61.5%, n = 3200, βintercept = .227, p < .001); this group
remained stable during the first 6 months of the trajec-
tory (βlinear slope = − .005, p > .05), and deteriorated slowly
during the final 12 months (βquadratic slope = .002, p < .001).
Almost a third of the sample (27.8%, n = 1448) was
poorly integrated at baseline (βintercept = .709, p < .001),
and did not change during subsequent assessments
(βlinear slope = .000, p > .05, βquadratic slope = − .001,
p > .05).
The rapid integrators had a poor initial status (5.4%,
n = 279, βintercept = .697, p < .001), improved rapidly dur-
ing the first 12 months (βlinear slope = − .220, p < .001) but
experienced a limited decrease towards the end of the
18-month period (βquadratic slope = .027, p < .001). To the
contrary, the rapid deterioraters started out as relatively
well socially integrated (5.3%, n = 278, βintercept = .275,
p < .001), deteriorated rapidly during the initial 9 months
(βlinear slope = .254, p < .001), but then improved slightly
towards the end of the trajectory (βquadratic slope = − .036,
p < .001).
Treatability
The largest group, the mild resisters (44.9%, n = 2337),
exhibited low levels of treatment resistance at baseline
(βintercept = .284, p < .001), and increased slightly after
an initial decrease (βlinear slope = − .016, p < .001, βquadratic
slope = .003, p < .001). The high resisters (37.2%, n = 1936,
βintercept, = .719, p < .001) exhibited a high degree of
resistance initially but improved somewhat after a
short stable period (βlinear slope = .003, p > .05, βquadratic
slope = − .003, p < .001). The rapid responders (13.0%,
n = 676) started with a high degree of resistance ini-
tially (βintercept = .730, p < .001), improved rapidly (βlinear
slope = − .221, p < .001), but had a setback after the first
12 months (βquadratic slope = .029, p < .001). The rapid esca-
lators (4.9%, n = 256) started with low-moderate resist-
ance (βintercept = .320, p < .001), escalated rapidly to high
resistance (βlinear slope = .227, p < .001), and improved
somewhat in the last part of the intervention (βquadratic
slope = − .030, p < .001), but never returned to anywhere
near baseline.
Association between covariates and latent trajectory class
membership
Tables 2 and 3 show the odds ratios and the 95% confi-
dence intervals of the multinomial logistic regression
analyses that link the covariates to the latent trajectory
class membership of the risk/need areas antisocial behav-
iour and family functioning (Table 2) and personality,
social support and treatability (Table 3). Here we will
mainly focus our discussion on medium and large odds
ratios.
Antisocial behaviour
All variables in the model were significantly associated
with trajectory class membership, which resulted in a
significant fit (χ2(20) = 1326.64, p < .001, Nagelkerke
R2 = .299). Under the influence of the other variables,
being younger in age increased the odds (OR = .068)
of being in the rapid escalator trajectory more than in
de mild persisters trajectory (for example, compared
to a 17 year old juvenile, a 14 year old had a 4.41 higher
likelihood (4.41 = 1/.68 multiplied by the 3 years differ-
ence in age) to be in the rapid escalator class). Juveniles
who previously committed ten or more violent and non-
violent offenses had a higher likelihood (OR = 9.10 for
prior violence, OR = 8.46 for non-violent offenses) to be
in the high persistent trajectory compared to juveniles
with no offenses in the mild persistent trajectory. Ado-
lescents who had a lower frequency of prior violent and
non-violent offenses (two to nine) this likelihood was
approximately three times higher for each of the offense
types. For the rapid escalators only ten or more prior
violent offenses increased the likelihood (OR = 4.67) of
being in this rapid ascending trajectory, compared to the
mild persisters who did not commit violent offenses. Also
an increasing number of changes between sectors of the
juvenile justice system, an indication of difficulties dur-
ing the execution of the sanction, increased the odds of
being in the rapid escalator trajectory (OR = 2.52 per
change). The rapid escalators had a higher average num-
ber of changes between the three sectors of the juvenile
justice system (M = 1.43, SD = .88) compared to the mild
Page 9 of 15Hilterman et al. Child Adolesc Psychiatry Ment
Health (2018) 12:15
Table 2 Multivariate odds ratios and confidence intervals for
predictors of latent trajectory membership for the risk/
need areas antisocial behaviour and family functioning (N =
5205)
Antisocial behaviour Latent class trajectories
Odds ratios [confidence intervals]
Rapid escalators High persisters
Nagelkerke R2 .299
Age at first assessment .68** [.61, .77] .99 [.94, 1.05]
Prior violent offenses
0 (reference category) 1.00 1.00
1 1.12 [.57, 2.61] 1.46* [1.04, 2.05]
2–9 1.77 [.92, 3.40] 3.02** [2.30, 3.98]
≥ 10 4.67** [2.17, 10.05] 9.10** [6.38, 12.99]
Prior non-violent offenses
0 (reference category) 1.00 1.00
1 1.83* [1.19, 2.82] 1.96** [1.55, 2.47]
2–9 2.18** [1.53, 3.11] 3.18** [2.64, 3.83]
≥ 10 1.11 [.42, 2.92] 8.46** [6.14, 11.66]
Previous detention 1.47 [.84, 2.59] 2.40** [1.83, 3.14]
Number of sector changes 2.52** [2.16, 2.96] 1.49** [1.36,
1.64]
Sentence > 1 year 2.20** [1.46, 3.32] 2.24** [1.88, 2.66]
Family functioning Latent class trajectories
Odds ratios [confidence intervals]
Increasingly problematic Highly problematic
Nagelkerke R2 .067
Age at first assessment .83** [.74, .94] .97 [.92, 1.02]
Prior violent offenses
0 (reference category) 1.00 1.00
1 2.43* [1.02, 5.76] .91 [.69, 1.21]
2–9 2.47* [1.12, 5.42] 1.21 [.96, 1.52]
≥ 10 5.35** [2.24, 12.74] 1.98** [1.44, 2.71]
Prior non-violent offenses
0 (reference category) 1.00 1.00
1 .98 [.59, 1.63] 1.19 [.96, 1.47]
2–9 1.44 [.99, 2.10] 1.41** [1.18, 1.67]
≥ 10 1.87 [.99, 3.55] 2.19** [1.62, 2.96]
Previous detention 1.24 [.73, 2.11] 1.50** [1.16, 1.94]
Number of sector changes 1.55** [1.31–1.85] 1.11* [1.01, 1.22]
Sentence > 1 year 1.75** [1.16, 2.63] 1.36** [1.16, 1.59]
The “mild persisters” trajectory class serves as reference
category in the Antisocial behaviour risk/need area, and the
“mildly problematic” is the reference category in
the Family functioning risk/need area. Previously detained = 1,
not previously detained = 0. Duration sentence ≤ 1 year = 0,
duration sentence > 1 year = 1
Multinomial logistic regression analyses, with backwards
stepwise elimination, was used to link covariates to trajectory
class membership
* p < .05, ** p < .01
persisters (M = .44, SD = .67) and the high persisters
(M = .81, SD = .90, F(2, 5202) = 263.65, p < .001).
Family functioning
All covariates had a significant association with trajec-
tory membership and the fit of the model was signifi-
cant (χ2(20) = 258.45, p < .001, Nagelkerke R2 = .067).
However, the effect sizes of the odds ratios were generally
small. Juveniles who were previously charged with ten or
more violent offenses had a high likelihood (OR = 5.35)
of being in the increasingly problematic trajectory com-
pared to juveniles with no violent offenses in the mildly
problematic trajectory. Compared to the mildly prob-
lematic group, also the number of changes between
Page 10 of 15Hilterman et al. Child Adolesc Psychiatry Ment
Health (2018) 12:15
Table 3 Multivariate odds ratios and confidence intervals for
predictors of latent trajectory membership for the risk/
need areas personality, social support and treatability (N =
5205)
Personality Latent class trajectories
Odds ratios [confidence intervals]
Rapid responders Rapid escalators Highly problematic
Nagelkerke R2 .158
Age at first assessment .85** [.78–.94] .85** [.76–.95] .87**
[.83, .91]
Prior violent offenses
0 (reference category) 1.00 1.00 1.00
1 1.99* [1.02, 3.86] 1.83 [.93, 3.62] 1.31* [1.01, 1.69]
2–9 2.69** [1.49, 4.86] 1.93* [1.06, 3.52] 1.68** [1.36, 2.09]
≥ 10 5.84** [2.91, 11.73] 5.04** [2.49, 10.21] 4.00** [2.92,
5.50]
Prior non-violent offenses
0 (reference category) 1.00 1.00 1.00
1 1.14 [.79, 1.64] 1.40 [.90, 2.16] 1.39** [1.15, 1.68]
2–9 1.11 [.82, 1.49] 1.78** [1.26, 2.52] 1.56** [1.33, 1.82]
≥ 10 1.53 [.88, 2.68] 2.35** [1.29, 4.27] 2.18** [1.61, 2.95]
Previous detention 1.62* [1.03, 2.56] 1.12 [.65, 1.92] 1.77**
[1.36, 2.30]
Number of sector changes 1.63** [1.40, 1.90] 2.21** [1.89,
2.58] 1.31** [1.20, 1.44]
Sentence > 1 year 1.97** [1.45, 2.69] 2.21** [1.89, 2.58]
1.66** [1.44, 1.91]
Social support Latent class trajectories
Odds ratios [confidence intervals]
Rapid integrators Rapid deterioraters Poorly integrated
Nagelkerke R2 .137
Age at first assessment .89* [.81, .98] .86** [.78, .95] .96 [.91,
1.00]
Prior violent offenses
0 (reference category) 1.00 1.00 1.00
1 1.70* [1.00, 2.89] 1.28 [.71, 2.28] 1.13* [.88, 1.46]
2–9 1.61* [1.01, 2.57] 1.62 [.99, 2.66] 1.28* [1.04, 1.58]
≥ 10 1,47 [.75, 2.89] 2.61** [1.39, 4.89] 2.43** [1.79, 3.30]
Prior non-violent offenses
0 (reference category) 1.00 1.00 1.00
1 1.31 [.91, 1.90] 1.68** [1.17, 2.40] 1.52** [1.24, 1.85]
2–9 1.62** [1.20, 2.19] 1.52** [1.12, 2.06] 2.01** [1.71, 2.36]
≥ 10 2.20** [1.22, 3.97] 1.90* [1.03, 3.49] 3.63** [2.68, 4.91]
Previous detention 2.03** [1.28, 3.23] 1.73* [1.09, 2.76] 1.88**
[1.44, 2.46]
Number of sector changes 1.77** [1.51, 2.06] 2.07** [1.79,
2.40] 1.31** [1.19, 1.43]
Sentence > 1 year 1.12 [.85, 1.49] 1.18 [.88, 1.58] 1.80** [1.55,
2.09]
Treatability Latent class trajectories
Odds ratios [confidence intervals]
Rapid responders Rapid escalators High resisters
Nagelkerke R2 .133
Age at first assessment .86** [.80, .92] .84** [.74, .90] .86**
[.82, .90]
Prior violent offenses
0 (reference category) 1.00 1.00 1.00
1 1.47* [1.00, 2.16] 1.31 [.79, 2.19] .88 [.70, 1.12]
2–9 2.15** [1.54, 2.99] 1.15 [.73, 1.80] 1.09 [.89, 1.32]
≥ 10 2.07** [1.30, 3.31] 2.03* [1.12, 3.68] 1.27 [.93, 1.74]
Prior non-violent offenses
0 (reference category) 1.00 1.00 1.00
Page 11 of 15Hilterman et al. Child Adolesc Psychiatry Ment
Health (2018) 12:15
sectors of the juvenile justice system increased the like-
lihood of being a member of the increasingly problem-
atic class (OR = 1.55 per change), more so than of being
in the highly problematic class (OR = 1.11 per change),
although both were significant.
Personality
The model had a good fit (χ2(30) = 752.41, p < .001,
Nagelkerke R2 = .158). Although all covariates had a
significant association with trajectory membership, the
effect sizes of the odds ratios were generally small. Excep-
tions were the large to medium odds ratios regarding ten
or more prior charges for violent offenses and the trajec-
tory membership of the rapid responders, the rapid esca-
lators and the highly problematic trajectories, which were
all significantly different from the mildly problematic tra-
jectory. In additional multinomial logistic analyses, with
the highly problematic class as the reference group and
the mildly problematic class excluded, only the number
of sector changes remained significant (χ2(2) = 61.34,
p < .001, Nagelkerke R2 = .04, OR = 1.30; CI 95% [1.13,
1.49], for rapid responders, OR = 1.75; 95% CI [1.52,
2.03], for rapid escalators).
Social support
The model had a significant fit (χ2(30) = 650.19, p < .001,
Nagelkerke R2 = .137) and all covariates associated sig-
nificantly with trajectory membership. The effect sizes
of the odds ratios were small; the only odds ratio with a
medium effect size was the dummy variable ten or more
prior non-violent offenses, which increased the likeli-
hood of being in the poorly integrated trajectory, com-
pared to juveniles with no non-violent offenses in the
mildly impaired integrators trajectory. In comparison
to the reference group, shifting between sectors of the
juvenile justice system was a risk factor for the rapid
deterioraters trajectory (OR = 2.07 per change) and
rapid integrators trajectory (OR = 1.77 per change) and
to a lesser degree for the poorly integrated trajectory
(OR = 1.31 per change).
Treatability
All variables of the model were associated with trajec-
tory class membership and contributed to the fit of the
model (χ2(30) = 659.80, p < .001, Nagelkerke R2 = .133).
Nonetheless, the effect sizes of the odds ratios, albeit
significant, were generally small. In comparison to the
mild resister subgroup, the high resisters had a moder-
ate higher likelihood to have been charged previously
for non-violent offenses (OR = 3.13). Compared to the
mild resisters, the number of sector changes in the juve-
nile justice system increased the likelihood with 1.88 and
1.89, for every change to be in the rapid escalator or rapid
responder trajectories, for the high resister trajectory this
likelihood was 1.64.
Discussion
The primary aim of this longitudinal study was to exam-
ine the existence of heterogeneous latent class trajec-
tories based on the 30 risk and protective items of the
SAVRY in a large sample of male juvenile offenders.
The identification of risk/need trajectories explores an
imperative issue for need-oriented risk management: the
capacity of risk/need items to change over time. Research
on the changeability of risk/need items of juvenile offend-
ers is scarce but also highly relevant because risk/need
assessment tools increasingly inform risk reduction strat-
egies for this population [27]. However, there is very little
knowledge about the capacity of these tools to measure
change over time and the current study is, as far as we
know, the first study to investigate the heterogeneity of
Table 3 continued
Treatability Latent class trajectories
Odds ratios [confidence intervals]
Rapid responders Rapid escalators High resisters
1 1.43** [1.10, 1.86] 2.01** [1.36, 2.98] 1.71** [1.41, 2.06]
2–9 1.86** [1.50, 2.30] 2.32** [1.66, 3.23] 2.12** [1.81, 2.48]
≥ 10 2.66** [1.73, 4.11] 2.53** [1.32, 4.82] 3.13** [2.26,
4.35]
Previous detention 2.26** [1.57, 3.24] 1.50 [.87, 2.58] 1.88**
[1.40, 2.53]
Number of sector changes 1.88** [1.66, 2.12] 1.89** [1.60,
2.24] 1.64** [1.48, 1.80]
Sentence > 1 year .91 [.75, 1.10] 1.36* [1.00, 1.84] 1.48**
[1.29, 1.69]
The “mildly problematic” trajectory class serves as reference
category in the personality risk/need area, the “mildly impaired
integrators” is the reference category in
the Social support risk/need area, and the “mild resisters” is the
reference category in the treatability risk/need area
Previously detained = 1, not previously detained = 0. Duration
sentence ≤ 1 year = 0, duration sentence > 1 year = 1
Multinomial logistic regression analyses, with backwards
stepwise elimination, was used to link covariates to trajectory
class membership
* p < .05, ** p < .01
Page 12 of 15Hilterman et al. Child Adolesc Psychiatry Ment
Health (2018) 12:15
trajectories of juvenile offenders on SAVRY risk/need
items.
The heterogeneous trajectories that were identified in
each of the five risk/need areas of the SAVRY were char-
acterized by the high quality of separation between the
trajectories. This indicates that the latent trajectories
were distinct from each other. Regarding the principal
question of this study it is important to note that the
unique patterns of changes in risk/needs of the majority
of the identified latent class trajectories showed signifi -
cant changes over time. In the risk/need area antisocial
behaviour, three trajectories were identified, of which
two, the mild persisters and the rapid escalators, indi-
cated significant change over time. However, the change
in the mild persisters was very minimal at .08 points on a
range of 0–1, what would be similar to a 1-point change
in SAVRY score (e.g., the change of one risk factor from
moderate to high).
Similarly, two of three trajectories of the risk/need
area family functioning, the mildly problematic and the
increasingly problematic trajectories, showed significant
change over time. The change exhibited among juve-
niles within these two trajectories was unexpected since
the items of the family functioning risk/need area are
static risk factors. Although unexpected, these results
may illustrate that during the adolescent’s contact with
the juvenile justice system more (often potentially trau-
matic) events that occurred within the family context can
be identified. Notwithstanding the static nature of these
items, they can generate important information [28]; in
particular for possible trauma informed interventions
[29].
In the area of personality, one of the risk/need areas
fully composed of dynamic risk and protective factors,
all four trajectories showed significant change over time.
However, the highly problematic group improved a very
minimal .02 points in risk/needs and the mildly problem-
atic group, the largest class with low risk/needs, showed
a very limited increase over time (with .03 points). The
trajectory of the rapid responders showed an impor-
tant improvement of .35 points (which coincides with
a 5-point change in SAVRY score) in risk/needs over
18 months, but represented only 5.3% of the sample. By
contrast, the trajectory of the rapid escalators (4.3%)
accelerated in the opposite direction and increased .35
points in risk/needs over the same 18-month period.
These results illustrate the heterogeneity of the change
patterns in which different groups of adolescents
developed in opposite directions over time during the
18-months study time-frame.
Of the four trajectories of the social support risk/need
area, the poorly integrated class was the only one that
did not show significant change over time. Furthermore,
the increase of .07 points during the 18-months period
for the mildly impaired integrators was very limited.
Conversely, the trajectory of the rapid integrators had
an accelerated reduction in risk/needs (.41 points) dur-
ing the first 12-months, to increase .09 point in the last
6-months. In comparison, the rapid deterioraters experi -
enced a swift increase in risk/needs of .44 points during
the first 9-months, although they did improve some-
what (.15 points) during the remaining 9-months of the
trajectory.
In the last risk/need area, treatability, the change over
time of the mild resisters (increase of .04 points) and
the high resisters (improvement of .07 points) was also
minimal. The trajectories of the rapid responders and the
rapid escalators illustrated, as the rapid deterioraters and
the rapid integrators of the risk/needs area Social sup-
port, the possible curvature shape of risk/need trajecto-
ries of juvenile offenders. After the baseline assessment
the risk/needs trajectory of the rapid escalators group of
4.9% of the sample increased during the first three assess-
ments with .41 points (equivalent to four points on this
SAVRY risk/need area), to subsequently decrease with
.12 points over the following 9 months. At 13% of the
sample, the rapid responders group was the most preva-
lent class that exhibited a large improvement (.40 points)
in risk/needs during the first 9-months; however, this
group then slowly increased (.10 points) towards the end
of the study period.
In summary, the large classes with high risk/needs did
not change over time or showed limited improvement
in risk/needs during the 18-month follow-up period.
The trajectories with low risk/needs generally remained
low and presented a very limited increase in risk/needs.
Between 5 and 13% of the juveniles had large reductions
in their risk/needs levels; however, approximately 5%
of the juveniles had a negative development during the
intervention, showing large increases in risk/needs.
Trajectories with extensive change over time in oppo-
site directions were observed in three of the risk/need
areas. A visual examination of the graphs in Fig. 2 would
suffice to gauge the loss of essential information in all
five-risk/need areas if the trajectories were averaged.
With the vast majority of research relying on analyses
that reflect average sample differences, homogeneous
change is assumed and the identification of unique heter-
ogeneous change patterns could be hidden. The heteroge-
neity of the risk/need trajectories in the current study is
consistent with the DLC criminology theories. Similar to
the delinquency trajectories [5, 14], the risk/need trajec-
tories of juvenile offenders in the present sample demon-
strate that change over time is likely to be heterogeneous.
Our second research question was what characteristics
identified from prior research including demograp hics
Page 13 of 15Hilterman et al. Child Adolesc Psychiatry Ment
Health (2018) 12:15
(age), criminal history (prior violent and non-violent
offenses, previously detained), and shifting between sec-
tions of the juvenile justice services could differentiate
between the risk/needs trajectories. We found that the
male juveniles in the low risk/needs trajectories, in com-
parison with the remainder trajectories, were older in
age, and had a low frequency of prior offenses, a lower
likelihood of previous detention, shorter current sen-
tences and experienced a very low frequency in sector
changes within the juvenile justice system, indicating a
smooth transition through the system. The trajectories
with high risk/needs and the rapid increasing trajectories
were generally the groups of offenders with more prior
offenses, longer current sentences and a higher likeli-
hood of multiple sector changes in the juvenile justice
system, indicating a problematic transition through the
system. The trajectories that presented a large decrease
or increase in risk/needs over time were younger in com-
parison with the high and low risk/need trajectories.
However, the decreasing trajectories were generally not
very different from the high risk/need and the increas-
ing trajectories. This lack of differences may be explained
by the historical nature of the majority of the covariates
and that in this study we did not have access to treatment
information. Nonetheless, the identified characteristics of
the trajectories with low, high and escalating risk/needs
are in line with the risk-needs-responsivity (RNR) model
[3] in that the most problematic groups were identified
with high risk/needs, and the least problematic groups
with low risk/needs.
Previous studies have suggested that interventions in
juvenile justice services need to be improved and insuffi -
ciently target criminogenic needs [7–9]. Unfortunately, in
the current study we did not have the data to verify these
findings. However, adolescents’ capacity to change over
short periods of time has been widely documented [1,
5]. Another possibility is that SAVRY may have detected
fever changes than actually occurred. This would sug-
gest that the tool is not sufficiently sensitive to measure
changes that juvenile offenders experience during their
transition through the juvenile justice system. The results
of the present study are consistent with the limited num-
ber of studies on the measurement of change with SAVRY
assessments [9, 12, 13]. This small body of work suggests
that SAVRY has difficulties in measuring change in risk/
needs of adolescent offenders. Viljoen and colleagues
recently suggested several potential strategies to enhance
risk assessment tools’ sensitivity to change [9]. One of
their suggestions was a shorter time frame to assess the
items. SAVRY uses time frames that refer “to the latest
6-month period” [11] for the dynamic risk items and
“the factor has been active or present over the preceding
year” regarding the protective items. In assessing future
behaviour the large majority of risk assessment tools ori -
entate the time frames to assess the items backwards, in
the direction of the history of a person: the past year or
the past 3–6 months. But if the objective is the appraisal
of the likelihood of future violent or delinquent behaviour
of a person, it might be more logical to orient the time
frames of the dynamic items towards the coming period,
for example the forthcoming 3–6 months. The SAPROF
is the only tool with a time frame oriented towards the
future [30]. Results of the SAPROF are promising since it
is one of the few adult tools that has shown the ability to
measure change over time in risk/needs [31].
Limitations and future directions
Our findings need to be considered in the context of the
current study’s limitations. First, the use of assessments
performed in a naturalistic setting has clear advantages,
but using data from daily clinical practice also presents
challenges. Previous studies have reported that the use
of assessment measures by professionals in the field can
result in lower reliability [32, 33]. However, various field
studies have shown that SAVRY assessments are com-
pleted with sufficient reliability in juvenile justice field
settings [17, 34]. Second, our study did not have access
to specific information on the nature and quality of the
intervention programs provided for the juveniles, nor the
intensity of these interventions. Future studies should
attempt to obtain information regarding treatment and
management that would provide insight into the extent
to which the intensity and/or specific features of these
interventions are associated with the various risk/need
trajectories. Finally, in the present study we focused on
the internal sensitivity to change through the identifica-
tion of risk/need trajectories of juveniles based on their
evolution on risk/need areas as they progressed through
the juvenile justice system. The association between risk/
needs and offending trajectories could contribute impor-
tantly to the insight of different developmental paths of
juvenile offenders during their adolescence and their
course through juvenile justice services and adjust treat-
ment programs for specific subgroups is an important
avenue for future research. That line of research could
help determine if juveniles in the risk/need trajectories
that show large improvements coincide with ‘desist-
ers’ and the high risk/need groups correspond with life-
course persistent offenders, two groups often identified
in delinquency trajectories [6].
Risk assessment research has principally been based on
cross-sectional research designs and between-individual
differences. To validly use risk assessment tools to ori -
ent and evaluate risk reduction strategies, more knowl-
edge about the changeability of risk/need items of these
tools should become available. Analogue with the DLC
Page 14 of 15Hilterman et al. Child Adolesc Psychiatry Ment
Health (2018) 12:15
theories and the numerous studies on heterogeneous
criminal career trajectories, longitudinal research on the
development of risk/needs over time could be employed
on a broader scale. This type of research could test the
heterogeneity of risk/need trajectories, based on items of
risk assessment tools and accordingly evaluate their sen-
sitivity to measure within-individual changes over time.
It would also be an opportunity to test if future-oriented
time frames could improve the sensitivity to measure
change over time.
Although SAVRY is a promising tool for risk assess-
ment, recent research suggests it could be insufficiently
sensitive to change over time [9, 13]. Since it is one of the
most widely used risk assessment tools for adolescents
there are large quantities of data available from research
and implementation in juvenile justice systems world-
wide [35]. It might be worthwhile to explore if this wealth
of data, and the valuable experiences of its implementa-
tion in juvenile justice systems [36], could be employed
to improve SAVRY’s sensibility to change over time. A
data driven improvement of SAVRY could also stimu-
late the field towards more effective prevention and risk
management.
Conclusions
In line with the developmental and life-course crimi-
nology theories this study illustrated that latent class
trajectories on the basis of SAVRY risk and protec-
tive items can be heterogeneous and indicate distinct
rates of change over time. Several of these trajectories
revealed different patterns of changes in opposite direc-
tions within the same risk/need area, demonstrating the
importance of examining change in a manner that does
not lose sight of this heterogeneity. Although SAVRY is a
promising tool for risk assessment, this study, taken into
the light of recent research [9, 13] suggests it could be
insufficiently sensitive to change over time.
Authors’ contributions
EH was responsible for the study, the design, and the
acquisition of the data.
EH analysed and interpreted the data in collaboration with IB.
EH was a major
contributor in writing the manuscript. IB, TN and ChvN were
involved in criti-
cally revising the work. All authors read and approved the final
manuscript.
Author details
1 GGzE Center for Child & Adolescent Psychiatry, Eindhoven,
The Netherlands.
2 Tilburg University, Scientific Center for Care and Welfare
(Tranzo), Tilburg,
The Netherlands. 3 Justa Mesura, Consultancy & Applied
Research, Barcelona,
Spain. 4 Department of Psychiatry, University of British
Columbia, Vancouver,
Canada. 5 BC Mental Health and Substance Use Services,
Forensic Psychiatric
Services Commission, Coquitlam, Canada.
Acknowledgements
The first author wishes to acknowledge the support of the
Centre for Legal
studies and Specialized Training of the Generalitat de Catalonia
during the
implementation phase.
Competing interests
The authors declare that they have no competing interests.
Availability of data and materials
The data that support the findings of this study are on request
available from
[Departament de Justicia de la Generalitat de Catalunya] but
restrictions apply
to the availability of these data, which were used under license
for the current
study, and so are not publicly available. Data are however
available from the
authors upon reasonable request and with permission of
[Departament de
Justicia de la Generalitat de Catalunya].
Consent for publication
Not applicable.
Ethics approval and consent to participate
This project involved secondary analysis of anonymized data
gathered
through routine procedures by juvenile justice professionals.
Permission to
conduct the research was granted by the Catalonian Department
of Justice.
Funding
This study did not receive any funding.
Publisher’s Note
Springer Nature remains neutral with regard to jurisdictional
claims in pub-
lished maps and institutional affiliations.
Received: 23 June 2017 Accepted: 20 February 2018
References
1. Grisso T. Evaluating the properties of instruments for
screening and risk
assessment. In: Grisso T, Vincent G, Seagrave D, editors.
Mental Health
Screening Assess. Juv. justice. New York: Guildford Press;
2005. p. 71–94.
2. Heilbrun K. Evaluation for risk of violence in adults. New
York: Oxford
University Press; 2009.
3. Andrews DA, Bonta J. The psychology of criminal conduct.
2nd ed. Cin-
cinnati: Anderson Publishing; 1998.
4. Giordano PC, Schroeder RD, Cernkovich SA. Emotions and
crime over
the life course: a neo-meadian perspective on criminal
continuity and
change. Am J Sociol. 2007;112:1603–61.
https://doi.org/10.1086/512710.
5. Thornberry TP, Giordano PC, Uggen C, Matsuda M, Masten
A, Bulten
E, et al. Explanations for offending. In: Loeber R, Farrington
DP, editors.
From Juv. Delinq. to adult crime Crim. careers, justice policy,
Prev. Oxford:
Oxford University Press; 2012. p. 47–85.
http://oxfordindex.oup.com/
view/10.1093/acprof:oso/9780199828166.003.0003?rskey=QE8
U0r&res
ult=2.
6. Jennings WG, Reingle JM. On the number and shape of
developmental/
life-course violence, aggression, and delinquency trajectories: a
state-of-
the-art review. J Crim Justice. 2012;40:472–89.
7. Haqanee Z, Peterson-Badali M, Skilling T. Making, “What
Works” work:
Examining probation officers’ experiences addressing the
criminogenic
needs of juvenile offenders. J Offender Rehabil. 2015;54:37–59.
https://
doi.org/10.1080/10509674.2014.980485.
8. Peterson-Badali M, Skilling T, Haqanee Z. Examining
implementa-
tion of risk assessment in case management for youth in the
justice
system. Crim Justice Behav. 2015;42:304.
http://rd8hp6du2b.search.
serialssolutions.com/?ctx_ver=Z39.88-2004&ctx_enc=info:ofi/
enc:UTF-
8&rfr_id=info:sid/ProQ:socabsshell&rft_val_fmt=info:ofi/
fmt:kev:mtx:journal&rft.genre=article&rft.jtitle=Prison+Journal
&rft.atitle
=Justice+for+All?+Offenders+w.
9. Viljoen JL, Shaffer CS, Gray AL, Douglas KS. Are
adolescent risk assessment
tools sensitive to change? A framework and examination of the
SAVRY
and the YLS/CMI. Law Hum Behav. 2017;41:244–57.
10. Rich P. Forensic case formulation with children and
adolescents. In:
Sturmey P, MacMurran M, editors. Forensic case formul.
Chichester: Wiley;
2011. p. 217–35.
https://doi.org/10.1086/512710
http://oxfordindex.oup.com/view/10.1093/acprof:oso/978019982
8166.003.0003?rskey=QE8U0r&result=2
http://oxfordindex.oup.com/view/10.1093/acprof:oso/978019982
8166.003.0003?rskey=QE8U0r&result=2
http://oxfordindex.oup.com/view/10.1093/acprof:oso/978019982
8166.003.0003?rskey=QE8U0r&result=2
https://doi.org/10.1080/10509674.2014.980485
http://rd8hp6du2b.search.serialssolutions.com/%3fctx_ver%3dZ
39.88-2004%26ctx_enc%3dinfo:ofi/enc:UTF-
8%26rfr_id%3dinfo:sid/ProQ:socabsshell%26rft_val_fmt%3dinf
o:ofi/fmt:kev:mtx:journal%26rft.genre%3darticle%26rft.jtitle%
3dPrison%2bJournal%26rft.atitle%3dJustice%2bfor%2bAll%3f
%2bOffenders%2bw
http://rd8hp6du2b.search.serialssolutions.com/%3fctx_ver%3dZ
39.88-2004%26ctx_enc%3dinfo:ofi/enc:UTF-
8%26rfr_id%3dinfo:sid/ProQ:socabsshell%26rft_val_fmt%3dinf
o:ofi/fmt:kev:mtx:journal%26rft.genre%3darticle%26rft.jtitle%
3dPrison%2bJournal%26rft.atitle%3dJustice%2bfor%2bAll%3f
%2bOffenders%2bw
http://rd8hp6du2b.search.serialssolutions.com/%3fctx_ver%3dZ
39.88-2004%26ctx_enc%3dinfo:ofi/enc:UTF-
8%26rfr_id%3dinfo:sid/ProQ:socabsshell%26rft_val_fmt%3dinf
o:ofi/fmt:kev:mtx:journal%26rft.genre%3darticle%26rft.jtitle%
3dPrison%2bJournal%26rft.atitle%3dJustice%2bfor%2bAll%3f
%2bOffenders%2bw
http://rd8hp6du2b.search.serialssolutions.com/%3fctx_ver%3dZ
39.88-2004%26ctx_enc%3dinfo:ofi/enc:UTF-
8%26rfr_id%3dinfo:sid/ProQ:socabsshell%26rft_val_fmt%3dinf
o:ofi/fmt:kev:mtx:journal%26rft.genre%3darticle%26rft.jtitle%
3dPrison%2bJournal%26rft.atitle%3dJustice%2bfor%2bAll%3f
%2bOffenders%2bw
http://rd8hp6du2b.search.serialssolutions.com/%3fctx_ver%3dZ
39.88-2004%26ctx_enc%3dinfo:ofi/enc:UTF-
8%26rfr_id%3dinfo:sid/ProQ:socabsshell%26rft_val_fmt%3dinf
o:ofi/fmt:kev:mtx:journal%26rft.genre%3darticle%26rft.jtitle%
3dPrison%2bJournal%26rft.atitle%3dJustice%2bfor%2bAll%3f
%2bOffenders%2bw
Page 15 of 15Hilterman et al. Child Adolesc Psychiatry Ment
Health (2018) 12:15
• We accept pre-submission inquiries
• Our selector tool helps you to find the most relevant journal
• We provide round the clock customer support
• Convenient online submission
• Thorough peer review
• Inclusion in PubMed and all major indexing services
• Maximum visibility for your research
Submit your manuscript at
www.biomedcentral.com/submit
Submit your next manuscript to BioMed Central
and we will help you at every step:
11. Borum R, Bartel P, Forth A. Manual for the structured risk
assessment of
violence in youth (SAVRY ), version 1.1. Tampa: University of
South Florida;
2003.
12. Viljoen JL, Gray AL, Shaffer C, Latzman NE, Scalora MJ,
Ullman D. Changes
in J-SOAP-II and SAVRY scores over the course of residential,
cognitive-
behavioral treatment for adolescent sexual offending. Sex Abus
A J Res
Treat. 2015. https://doi.org/10.1177/1079063215595404.
13. Viljoen JL, Gray AL, Shaffer C, Bhanwer A, Tafreshi D,
Douglas KS. Does
reassessment of risk improve predictions? A framework and
examination
of the SAVRY and YLS/CMI. Psychol Assess. 2016.
https://doi.org/10.1037/
pas0000402.
14. Farrington DP. Integrated developmental & life-course
theories of offend-
ing. New Brunswick: Transaction Publishers; 2005.
15. Loeber R, Slot NW, Stouthamer-Loeber M. A three-
dimensional,
cumulative developmental model of serious delinquency. In:
Wikström
P-OH, Sampson RJ, editors. Explan crime. Cambridge:
Cambridge
University Press; 2006. p. 153–94.
http://ebooks.cambridge.org/ref/id/
CBO9780511489341A015. Accessed 1 Mar 2017.
16. Vallès MD, Hilterman ELB. SAVRY Manual per a la
valoració estructurada
de risc de violència en joves [Manual of the Spanish version of
the
Structured Assessment of Violence Risk in Youth]. Barcelona:
Generalitat
de Catalunya, Centre d’Estudis Jurídics i Formació
Especialitzada; 2006.
17. Hilterman ELB, Bongers I, Nicholls TL, van
Nieuwenhuizen C. Identifying
gender specific risk/need areas for male and female juvenile
offenders:
factor analyses with the Structured Assessment of Violence Risk
in Youth
(SAVRY ). Law Hum Behav. 2016;40:82–96.
18. Cicchetti DV., Sparrow SA. Developing criteria for
establishing inter-
rater reliability of specific items: applications to assessment o f
adaptive
behavior. American Assn on Mental Retardation; 1981. p. 127–
37. http://
psycnet.apa.org/psycinfo/1982-00095-001. Accessed 24 Apr
2017.
19. Hu L, Bentler PM. Cutoff criteria for fit indexes in
covariance structure
analysis: Conventional criteria versus new alternatives. Struct
Equ Model A
Multidiscip J. 1999;6:1–55.
https://doi.org/10.1080/10705519909540118.
20. Muthén LK, Muthén BO. Mplus User’s Guide. 7th edn.
Muthén & Muthén;
2015.
http://www.statmodel.com/download/usersguide/MplusUser-
GuideVer_7.pdf.
21. Nylund KL, Asparouhov T, Muthén BO. Deciding on the
number of classes
in latent class analysis and growth mixture modeling: a Monte
Carlo
simulation study. Struct Equ Model. 2007;14:535–69.
22. Clark SL, Muthén B. Relating latent class analysis results
to variables not
included in the analysis. 2009.
https://www.statmodel.com/download/
relatinglca.pdf. Accessed 2 Mar 2017.
23. Asparouhov T, Muthén BO. Using Mplus TECH11 and
TECH14 to test the
number of latent classes. Mplus Web Notes. 2012. p. 1–17.
https://www.
statmodel.com/examples/webnotes/webnote14.pdf. Accessed 2
Mar
2017.
24. Little TD, Jorgensen TD, Lang KM, Moore EWG. On the
joys of missing
data. J Pediatr Psychol. 2014;39:151–62.
https://academic.oup.com/
jpepsy/article/39/2/151/883719/On-the-Joys-of-Missing-Data.
Accessed
2 Apr 2017.
25. Dong Y, Peng C-YJ. Principled missing data methods for
researchers.
Springerplus. 2013;2:222. https://doi.org/10.1186/2193-1801-2-
222.
26. Chen H, Cohen P, Chen S. How big is a big odds ratio?
Interpreting the
magnitudes of odds ratios in epidemiological studies. Commun
Stat
Simul Comput. 2010;39:860–4.
27. Wachter A. Statewide risk assessment in juvenile
probation. JJGPS
StateScan. Pittsburg: National Center for Juvenile Justice; 2015.
p. 1–4.
http://www.nysap.us/JJGPSStateScanStatewideRiskAssessment-
updated-
March2015.pdf. Accessed 20 Mar 2017.
28. Fox BH, Perez N, Cass E, Baglivio MT, Epps N. Trauma
changes everything:
examining the relationship between adverse childhood
experiences
and serious, violent and chronic juvenile offenders. Child Abus
Negl.
2015;46:163–73. https://doi.org/10.1016/j.chiabu.2015.01.011.
29. Ford JD, Kerig PK, Desai N, Feierman J. Psychosocial
interventions for
traumatized youth in the juvenile justice system: research,
evidence base,
and clinical/legal challenges. OJJDP J. Juv. Justice. 2016;5:31–
49.
30. de Vogel V, de Ruiter C, Bouman Y, de Vries Robbé M.
SAPROF. Guidelines
for the assessment of protective factors for violence risk. 2nd
ed. Utrecht:
Van der Hoeven Stichting; 2012.
31. de Vries Robbé M, de Vogel V, Douglas KS, Nijman HLI.
Changes in
dynamic risk and protective factors for violence during
inpatient forensic
psychiatric treatment: Predicting reductions in postdischarge
community
recidivism. Law Hum Behav. 2015;39:53–61.
https://doi.org/10.1037/
lhb0000089.
32. Boccaccini MT, Turner DB, Murrie DC. Do some
evaluators report consist-
ently higher or lower PCL-R scores than others? Findings from
a statewide
sample of sexually violent predator evaluations. Psychol Public
Policy
Law. 2008;14:262–83. https://doi.org/10.1037/a0014523.
33. Edens JF, Vincent GM. Juvenile psychopathy: a clinical
construct in
need of restraint? J. Forensic Psychol Pract. 2008;8:186–97.
https://doi.
org/10.1080/15228930801964042.
34. Vincent GM, Guy LS, Fusco SL, Gershenson BG. Field
reliability of the
SAVRY with juvenile probation officers: Implications for
training. Law Hum
Behav. 2012;36:1–14. https://doi.org/10.1037/h0093974.
35. Borum R, Lodewijks H, Bartel PA, Forth A. Structured
Assessment of
Violence Risk in Youth (SAVRY ). In: Otto RK, Douglas KS,
editors. Handbook
violence risk Assess. New York: Routledge; 2010. p. 63–80.
36. Vincent GM, Guy LS, Perrault RT, Gershenson B. Risk
assessment matters,
but only when implemented well: a multisite study in juvenile
probation.
Law Hum Behav. 2016;40:683–96.
https://doi.org/10.1037/lhb0000214.
https://doi.org/10.1177/1079063215595404
https://doi.org/10.1037/pas0000402
http://ebooks.cambridge.org/ref/id/CBO9780511489341A015
http://psycnet.apa.org/psycinfo/1982-00095-001
https://doi.org/10.1080/10705519909540118
http://www.statmodel.com/download/usersguide/MplusUserGuid
eVer_7.pdf
http://www.statmodel.com/download/usersguide/MplusUserGuid
eVer_7.pdf
https://www.statmodel.com/download/relatinglca.pdf
https://www.statmodel.com/download/relatinglca.pd f
https://www.statmodel.com/examples/webnotes/webnote14.pdf
https://academic.oup.com/jpepsy/article/39/2/151/883719/On-
the-Joys-of-Missing-Data
https://academic.oup.com/jpepsy/article/39/2/151/88371 9/On-
the-Joys-of-Missing-Data
https://doi.org/10.1186/2193-1801-2-222
http://www.nysap.us/JJGPSStateScanStatewideRiskAssessment-
updatedMarch2015.pdf
http://www.nysap.us/JJGPSStateScanStatewideRiskAssessment-
updatedMarch2015.pdf
https://doi.org/10.1016/j.chiabu.2015.01.011
https://doi.org/10.1037/lhb0000089
https://doi.org/10.1037/a0014523
https://doi.org/10.1080/15228930801964042
https://doi.org/10.1037/h0093974
https://doi.org/10.1037/lhb0000214
BioMed Central publishes under the Creative Commons
Attribution License (CCAL). Under
the CCAL, authors retain copyright to the article but users are
allowed to download, reprint,
distribute and /or copy articles in BioMed Central journal s, as
long as the original work is
properly cited.
Supervision trajectories of male juvenile offenders: growth
mixture modeling on SAVRY risk assessmentsAbstract
Background: Methods: Results: Conclusions:
BackgroundMethodsSampleSettingMeasuresProcedureStatistical
analysisResultsSelection of the latent trajectory classesThe
developmental processes of the riskneeds areasAntisocial
behaviourFamily functioningPersonalitySocial
supportTreatabilityAssociation between covariates and latent
trajectory class membershipAntisocial behaviourFamily
functioningPersonalitySocial
supportTreatabilityDiscussionLimitations and future
directionsConclusionsAuthors’ contributionsReferences

More Related Content

Similar to Hilterman et al. Child Adolesc Psychiatry Ment Health (2018)

study of high risk behaviors and their association with personality factors
study of high risk behaviors and their association with personality factorsstudy of high risk behaviors and their association with personality factors
study of high risk behaviors and their association with personality factorsINFOGAIN PUBLICATION
 
Running Head Operationalizing VariableRunning head Methods P.docx
Running Head Operationalizing VariableRunning head Methods P.docxRunning Head Operationalizing VariableRunning head Methods P.docx
Running Head Operationalizing VariableRunning head Methods P.docxcharisellington63520
 
B u l l e t i n S e r i e sU.S. Department of Jus.docx
        B u l l e t i n  S e r i e sU.S. Department of Jus.docx        B u l l e t i n  S e r i e sU.S. Department of Jus.docx
B u l l e t i n S e r i e sU.S. Department of Jus.docxShiraPrater50
 
Health Inequalities Among Australians
Health Inequalities Among AustraliansHealth Inequalities Among Australians
Health Inequalities Among AustraliansLaura Torres
 
SOCA6640 Social Science Research Methods.docx
SOCA6640 Social Science Research Methods.docxSOCA6640 Social Science Research Methods.docx
SOCA6640 Social Science Research Methods.docxsdfghj21
 
Journal article critque #1
Journal article critque #1Journal article critque #1
Journal article critque #1LaKeisha Weber
 
IOSR Journal of Pharmacy (IOSRPHR), www.iosrphr.org, call for paper, research...
IOSR Journal of Pharmacy (IOSRPHR), www.iosrphr.org, call for paper, research...IOSR Journal of Pharmacy (IOSRPHR), www.iosrphr.org, call for paper, research...
IOSR Journal of Pharmacy (IOSRPHR), www.iosrphr.org, call for paper, research...iosrphr_editor
 
Using the empirical research article that your instructor approved i
Using the empirical research article that your instructor approved iUsing the empirical research article that your instructor approved i
Using the empirical research article that your instructor approved iheiditownend
 
Children and Families Forum Suicide Prevention for Children and A
Children and Families Forum Suicide Prevention for Children and AChildren and Families Forum Suicide Prevention for Children and A
Children and Families Forum Suicide Prevention for Children and AJinElias52
 
Assessing Youth Early In The Juvenile Justice System
Assessing Youth Early In The Juvenile Justice SystemAssessing Youth Early In The Juvenile Justice System
Assessing Youth Early In The Juvenile Justice SystemLiz Adams
 
Research Proposal CJS. 503
Research Proposal CJS. 503Research Proposal CJS. 503
Research Proposal CJS. 503Keith Ivone
 
Term Paper Assignment CRIJ 3300 Applied Research and Methods.docx
Term Paper Assignment CRIJ 3300 Applied Research and Methods.docxTerm Paper Assignment CRIJ 3300 Applied Research and Methods.docx
Term Paper Assignment CRIJ 3300 Applied Research and Methods.docxjacqueliner9
 
Perception of Student Offenders on Deterrence Theory
Perception of Student Offenders on Deterrence TheoryPerception of Student Offenders on Deterrence Theory
Perception of Student Offenders on Deterrence Theoryijtsrd
 
Discuss whether or not you feel these programs are effective in prev.pdf
Discuss whether or not you feel these programs are effective in prev.pdfDiscuss whether or not you feel these programs are effective in prev.pdf
Discuss whether or not you feel these programs are effective in prev.pdffashioncollection2
 
Abstract.docxAbstractWith scientific knowledge of youth deve.docx
Abstract.docxAbstractWith scientific knowledge of youth deve.docxAbstract.docxAbstractWith scientific knowledge of youth deve.docx
Abstract.docxAbstractWith scientific knowledge of youth deve.docxaryan532920
 
Preventing Delinquency after DivorceArtresah Lozier, Chaly.docx
Preventing Delinquency after DivorceArtresah Lozier, Chaly.docxPreventing Delinquency after DivorceArtresah Lozier, Chaly.docx
Preventing Delinquency after DivorceArtresah Lozier, Chaly.docxstilliegeorgiana
 
Screening children and young people for risk of re-offending: A Discussion of...
Screening children and young people for risk of re-offending: A Discussion of...Screening children and young people for risk of re-offending: A Discussion of...
Screening children and young people for risk of re-offending: A Discussion of...robine
 
I need participation points, and to get that, i have to respond back.docx
I need participation points, and to get that, i have to respond back.docxI need participation points, and to get that, i have to respond back.docx
I need participation points, and to get that, i have to respond back.docxevontdcichon
 

Similar to Hilterman et al. Child Adolesc Psychiatry Ment Health (2018) (19)

study of high risk behaviors and their association with personality factors
study of high risk behaviors and their association with personality factorsstudy of high risk behaviors and their association with personality factors
study of high risk behaviors and their association with personality factors
 
Running Head Operationalizing VariableRunning head Methods P.docx
Running Head Operationalizing VariableRunning head Methods P.docxRunning Head Operationalizing VariableRunning head Methods P.docx
Running Head Operationalizing VariableRunning head Methods P.docx
 
manajemen rumah sakit 3
manajemen rumah sakit 3manajemen rumah sakit 3
manajemen rumah sakit 3
 
B u l l e t i n S e r i e sU.S. Department of Jus.docx
        B u l l e t i n  S e r i e sU.S. Department of Jus.docx        B u l l e t i n  S e r i e sU.S. Department of Jus.docx
B u l l e t i n S e r i e sU.S. Department of Jus.docx
 
Health Inequalities Among Australians
Health Inequalities Among AustraliansHealth Inequalities Among Australians
Health Inequalities Among Australians
 
SOCA6640 Social Science Research Methods.docx
SOCA6640 Social Science Research Methods.docxSOCA6640 Social Science Research Methods.docx
SOCA6640 Social Science Research Methods.docx
 
Journal article critque #1
Journal article critque #1Journal article critque #1
Journal article critque #1
 
IOSR Journal of Pharmacy (IOSRPHR), www.iosrphr.org, call for paper, research...
IOSR Journal of Pharmacy (IOSRPHR), www.iosrphr.org, call for paper, research...IOSR Journal of Pharmacy (IOSRPHR), www.iosrphr.org, call for paper, research...
IOSR Journal of Pharmacy (IOSRPHR), www.iosrphr.org, call for paper, research...
 
Using the empirical research article that your instructor approved i
Using the empirical research article that your instructor approved iUsing the empirical research article that your instructor approved i
Using the empirical research article that your instructor approved i
 
Children and Families Forum Suicide Prevention for Children and A
Children and Families Forum Suicide Prevention for Children and AChildren and Families Forum Suicide Prevention for Children and A
Children and Families Forum Suicide Prevention for Children and A
 
Assessing Youth Early In The Juvenile Justice System
Assessing Youth Early In The Juvenile Justice SystemAssessing Youth Early In The Juvenile Justice System
Assessing Youth Early In The Juvenile Justice System
 
Research Proposal CJS. 503
Research Proposal CJS. 503Research Proposal CJS. 503
Research Proposal CJS. 503
 
Term Paper Assignment CRIJ 3300 Applied Research and Methods.docx
Term Paper Assignment CRIJ 3300 Applied Research and Methods.docxTerm Paper Assignment CRIJ 3300 Applied Research and Methods.docx
Term Paper Assignment CRIJ 3300 Applied Research and Methods.docx
 
Perception of Student Offenders on Deterrence Theory
Perception of Student Offenders on Deterrence TheoryPerception of Student Offenders on Deterrence Theory
Perception of Student Offenders on Deterrence Theory
 
Discuss whether or not you feel these programs are effective in prev.pdf
Discuss whether or not you feel these programs are effective in prev.pdfDiscuss whether or not you feel these programs are effective in prev.pdf
Discuss whether or not you feel these programs are effective in prev.pdf
 
Abstract.docxAbstractWith scientific knowledge of youth deve.docx
Abstract.docxAbstractWith scientific knowledge of youth deve.docxAbstract.docxAbstractWith scientific knowledge of youth deve.docx
Abstract.docxAbstractWith scientific knowledge of youth deve.docx
 
Preventing Delinquency after DivorceArtresah Lozier, Chaly.docx
Preventing Delinquency after DivorceArtresah Lozier, Chaly.docxPreventing Delinquency after DivorceArtresah Lozier, Chaly.docx
Preventing Delinquency after DivorceArtresah Lozier, Chaly.docx
 
Screening children and young people for risk of re-offending: A Discussion of...
Screening children and young people for risk of re-offending: A Discussion of...Screening children and young people for risk of re-offending: A Discussion of...
Screening children and young people for risk of re-offending: A Discussion of...
 
I need participation points, and to get that, i have to respond back.docx
I need participation points, and to get that, i have to respond back.docxI need participation points, and to get that, i have to respond back.docx
I need participation points, and to get that, i have to respond back.docx
 

More from SusanaFurman449

Please read the description of the Religion ethnography carefully an.docx
Please read the description of the Religion ethnography carefully an.docxPlease read the description of the Religion ethnography carefully an.docx
Please read the description of the Religion ethnography carefully an.docxSusanaFurman449
 
PLEASE read the question carefully.  The creation of teen ido.docx
PLEASE read the question carefully.  The creation of teen ido.docxPLEASE read the question carefully.  The creation of teen ido.docx
PLEASE read the question carefully.  The creation of teen ido.docxSusanaFurman449
 
Please reflect on the relationship between faith, personal disciplin.docx
Please reflect on the relationship between faith, personal disciplin.docxPlease reflect on the relationship between faith, personal disciplin.docx
Please reflect on the relationship between faith, personal disciplin.docxSusanaFurman449
 
Please read the following questions and answer the questions.docx
Please read the following questions and answer the questions.docxPlease read the following questions and answer the questions.docx
Please read the following questions and answer the questions.docxSusanaFurman449
 
PRAISE FOR CRUCIAL CONVERSATIONS Relationships ar.docx
PRAISE FOR CRUCIAL CONVERSATIONS Relationships ar.docxPRAISE FOR CRUCIAL CONVERSATIONS Relationships ar.docx
PRAISE FOR CRUCIAL CONVERSATIONS Relationships ar.docxSusanaFurman449
 
Must Be a hip-hop concert!!!!attend a .docx
Must Be a             hip-hop concert!!!!attend a           .docxMust Be a             hip-hop concert!!!!attend a           .docx
Must Be a hip-hop concert!!!!attend a .docxSusanaFurman449
 
Mini-Paper #3 Johnson & Johnson and a Tale of Two Crises - An Eth.docx
Mini-Paper #3 Johnson & Johnson and a Tale of Two Crises - An Eth.docxMini-Paper #3 Johnson & Johnson and a Tale of Two Crises - An Eth.docx
Mini-Paper #3 Johnson & Johnson and a Tale of Two Crises - An Eth.docxSusanaFurman449
 
Please write these 2 assignments in first person.docx
Please write these 2 assignments in                 first person.docxPlease write these 2 assignments in                 first person.docx
Please write these 2 assignments in first person.docxSusanaFurman449
 
Personal Leadership Training plan AttributesColumbia South.docx
Personal Leadership Training plan  AttributesColumbia South.docxPersonal Leadership Training plan  AttributesColumbia South.docx
Personal Leadership Training plan AttributesColumbia South.docxSusanaFurman449
 
Need help on researching why women join gangs1.How does anxi.docx
Need help on researching why women join gangs1.How does anxi.docxNeed help on researching why women join gangs1.How does anxi.docx
Need help on researching why women join gangs1.How does anxi.docxSusanaFurman449
 
Jung Typology AssessmentThe purpose of this assignment is to ass.docx
Jung Typology AssessmentThe purpose of this assignment is to ass.docxJung Typology AssessmentThe purpose of this assignment is to ass.docx
Jung Typology AssessmentThe purpose of this assignment is to ass.docxSusanaFurman449
 
Journal of Organizational Behavior J. Organiz. Behav. 31, .docx
Journal of Organizational Behavior J. Organiz. Behav. 31, .docxJournal of Organizational Behavior J. Organiz. Behav. 31, .docx
Journal of Organizational Behavior J. Organiz. Behav. 31, .docxSusanaFurman449
 
LDR535 v4Organizational Change ChartLDR535 v4Page 2 of 2.docx
LDR535 v4Organizational Change ChartLDR535 v4Page 2 of 2.docxLDR535 v4Organizational Change ChartLDR535 v4Page 2 of 2.docx
LDR535 v4Organizational Change ChartLDR535 v4Page 2 of 2.docxSusanaFurman449
 
In this paper, you will select an ethics issue from among the topics.docx
In this paper, you will select an ethics issue from among the topics.docxIn this paper, you will select an ethics issue from among the topics.docx
In this paper, you will select an ethics issue from among the topics.docxSusanaFurman449
 
In the past few weeks, you practiced observation skills by watchin.docx
In the past few weeks, you practiced observation skills by watchin.docxIn the past few weeks, you practiced observation skills by watchin.docx
In the past few weeks, you practiced observation skills by watchin.docxSusanaFurman449
 
Overview After analyzing your public health issue in Milestone On.docx
Overview After analyzing your public health issue in Milestone On.docxOverview After analyzing your public health issue in Milestone On.docx
Overview After analyzing your public health issue in Milestone On.docxSusanaFurman449
 
Judicial OpinionsOverview After the simulation, justices writ.docx
Judicial OpinionsOverview After the simulation, justices writ.docxJudicial OpinionsOverview After the simulation, justices writ.docx
Judicial OpinionsOverview After the simulation, justices writ.docxSusanaFurman449
 
IntroductionReview the Vila Health scenario and complete the int.docx
IntroductionReview the Vila Health scenario and complete the int.docxIntroductionReview the Vila Health scenario and complete the int.docx
IntroductionReview the Vila Health scenario and complete the int.docxSusanaFurman449
 
In studying Social Problems, sociologists (and historians) identify .docx
In studying Social Problems, sociologists (and historians) identify .docxIn studying Social Problems, sociologists (and historians) identify .docx
In studying Social Problems, sociologists (and historians) identify .docxSusanaFurman449
 
I need help correcting an integrative review.This was the profes.docx
I need help correcting an integrative review.This was the profes.docxI need help correcting an integrative review.This was the profes.docx
I need help correcting an integrative review.This was the profes.docxSusanaFurman449
 

More from SusanaFurman449 (20)

Please read the description of the Religion ethnography carefully an.docx
Please read the description of the Religion ethnography carefully an.docxPlease read the description of the Religion ethnography carefully an.docx
Please read the description of the Religion ethnography carefully an.docx
 
PLEASE read the question carefully.  The creation of teen ido.docx
PLEASE read the question carefully.  The creation of teen ido.docxPLEASE read the question carefully.  The creation of teen ido.docx
PLEASE read the question carefully.  The creation of teen ido.docx
 
Please reflect on the relationship between faith, personal disciplin.docx
Please reflect on the relationship between faith, personal disciplin.docxPlease reflect on the relationship between faith, personal disciplin.docx
Please reflect on the relationship between faith, personal disciplin.docx
 
Please read the following questions and answer the questions.docx
Please read the following questions and answer the questions.docxPlease read the following questions and answer the questions.docx
Please read the following questions and answer the questions.docx
 
PRAISE FOR CRUCIAL CONVERSATIONS Relationships ar.docx
PRAISE FOR CRUCIAL CONVERSATIONS Relationships ar.docxPRAISE FOR CRUCIAL CONVERSATIONS Relationships ar.docx
PRAISE FOR CRUCIAL CONVERSATIONS Relationships ar.docx
 
Must Be a hip-hop concert!!!!attend a .docx
Must Be a             hip-hop concert!!!!attend a           .docxMust Be a             hip-hop concert!!!!attend a           .docx
Must Be a hip-hop concert!!!!attend a .docx
 
Mini-Paper #3 Johnson & Johnson and a Tale of Two Crises - An Eth.docx
Mini-Paper #3 Johnson & Johnson and a Tale of Two Crises - An Eth.docxMini-Paper #3 Johnson & Johnson and a Tale of Two Crises - An Eth.docx
Mini-Paper #3 Johnson & Johnson and a Tale of Two Crises - An Eth.docx
 
Please write these 2 assignments in first person.docx
Please write these 2 assignments in                 first person.docxPlease write these 2 assignments in                 first person.docx
Please write these 2 assignments in first person.docx
 
Personal Leadership Training plan AttributesColumbia South.docx
Personal Leadership Training plan  AttributesColumbia South.docxPersonal Leadership Training plan  AttributesColumbia South.docx
Personal Leadership Training plan AttributesColumbia South.docx
 
Need help on researching why women join gangs1.How does anxi.docx
Need help on researching why women join gangs1.How does anxi.docxNeed help on researching why women join gangs1.How does anxi.docx
Need help on researching why women join gangs1.How does anxi.docx
 
Jung Typology AssessmentThe purpose of this assignment is to ass.docx
Jung Typology AssessmentThe purpose of this assignment is to ass.docxJung Typology AssessmentThe purpose of this assignment is to ass.docx
Jung Typology AssessmentThe purpose of this assignment is to ass.docx
 
Journal of Organizational Behavior J. Organiz. Behav. 31, .docx
Journal of Organizational Behavior J. Organiz. Behav. 31, .docxJournal of Organizational Behavior J. Organiz. Behav. 31, .docx
Journal of Organizational Behavior J. Organiz. Behav. 31, .docx
 
LDR535 v4Organizational Change ChartLDR535 v4Page 2 of 2.docx
LDR535 v4Organizational Change ChartLDR535 v4Page 2 of 2.docxLDR535 v4Organizational Change ChartLDR535 v4Page 2 of 2.docx
LDR535 v4Organizational Change ChartLDR535 v4Page 2 of 2.docx
 
In this paper, you will select an ethics issue from among the topics.docx
In this paper, you will select an ethics issue from among the topics.docxIn this paper, you will select an ethics issue from among the topics.docx
In this paper, you will select an ethics issue from among the topics.docx
 
In the past few weeks, you practiced observation skills by watchin.docx
In the past few weeks, you practiced observation skills by watchin.docxIn the past few weeks, you practiced observation skills by watchin.docx
In the past few weeks, you practiced observation skills by watchin.docx
 
Overview After analyzing your public health issue in Milestone On.docx
Overview After analyzing your public health issue in Milestone On.docxOverview After analyzing your public health issue in Milestone On.docx
Overview After analyzing your public health issue in Milestone On.docx
 
Judicial OpinionsOverview After the simulation, justices writ.docx
Judicial OpinionsOverview After the simulation, justices writ.docxJudicial OpinionsOverview After the simulation, justices writ.docx
Judicial OpinionsOverview After the simulation, justices writ.docx
 
IntroductionReview the Vila Health scenario and complete the int.docx
IntroductionReview the Vila Health scenario and complete the int.docxIntroductionReview the Vila Health scenario and complete the int.docx
IntroductionReview the Vila Health scenario and complete the int.docx
 
In studying Social Problems, sociologists (and historians) identify .docx
In studying Social Problems, sociologists (and historians) identify .docxIn studying Social Problems, sociologists (and historians) identify .docx
In studying Social Problems, sociologists (and historians) identify .docx
 
I need help correcting an integrative review.This was the profes.docx
I need help correcting an integrative review.This was the profes.docxI need help correcting an integrative review.This was the profes.docx
I need help correcting an integrative review.This was the profes.docx
 

Recently uploaded

A Critique of the Proposed National Education Policy Reform
A Critique of the Proposed National Education Policy ReformA Critique of the Proposed National Education Policy Reform
A Critique of the Proposed National Education Policy ReformChameera Dedduwage
 
Grant Readiness 101 TechSoup and Remy Consulting
Grant Readiness 101 TechSoup and Remy ConsultingGrant Readiness 101 TechSoup and Remy Consulting
Grant Readiness 101 TechSoup and Remy ConsultingTechSoup
 
Sanyam Choudhary Chemistry practical.pdf
Sanyam Choudhary Chemistry practical.pdfSanyam Choudhary Chemistry practical.pdf
Sanyam Choudhary Chemistry practical.pdfsanyamsingh5019
 
Sports & Fitness Value Added Course FY..
Sports & Fitness Value Added Course FY..Sports & Fitness Value Added Course FY..
Sports & Fitness Value Added Course FY..Disha Kariya
 
Software Engineering Methodologies (overview)
Software Engineering Methodologies (overview)Software Engineering Methodologies (overview)
Software Engineering Methodologies (overview)eniolaolutunde
 
The Most Excellent Way | 1 Corinthians 13
The Most Excellent Way | 1 Corinthians 13The Most Excellent Way | 1 Corinthians 13
The Most Excellent Way | 1 Corinthians 13Steve Thomason
 
SOCIAL AND HISTORICAL CONTEXT - LFTVD.pptx
SOCIAL AND HISTORICAL CONTEXT - LFTVD.pptxSOCIAL AND HISTORICAL CONTEXT - LFTVD.pptx
SOCIAL AND HISTORICAL CONTEXT - LFTVD.pptxiammrhaywood
 
Interactive Powerpoint_How to Master effective communication
Interactive Powerpoint_How to Master effective communicationInteractive Powerpoint_How to Master effective communication
Interactive Powerpoint_How to Master effective communicationnomboosow
 
Presentation by Andreas Schleicher Tackling the School Absenteeism Crisis 30 ...
Presentation by Andreas Schleicher Tackling the School Absenteeism Crisis 30 ...Presentation by Andreas Schleicher Tackling the School Absenteeism Crisis 30 ...
Presentation by Andreas Schleicher Tackling the School Absenteeism Crisis 30 ...EduSkills OECD
 
Call Girls in Dwarka Mor Delhi Contact Us 9654467111
Call Girls in Dwarka Mor Delhi Contact Us 9654467111Call Girls in Dwarka Mor Delhi Contact Us 9654467111
Call Girls in Dwarka Mor Delhi Contact Us 9654467111Sapana Sha
 
BAG TECHNIQUE Bag technique-a tool making use of public health bag through wh...
BAG TECHNIQUE Bag technique-a tool making use of public health bag through wh...BAG TECHNIQUE Bag technique-a tool making use of public health bag through wh...
BAG TECHNIQUE Bag technique-a tool making use of public health bag through wh...Sapna Thakur
 
fourth grading exam for kindergarten in writing
fourth grading exam for kindergarten in writingfourth grading exam for kindergarten in writing
fourth grading exam for kindergarten in writingTeacherCyreneCayanan
 
Measures of Dispersion and Variability: Range, QD, AD and SD
Measures of Dispersion and Variability: Range, QD, AD and SDMeasures of Dispersion and Variability: Range, QD, AD and SD
Measures of Dispersion and Variability: Range, QD, AD and SDThiyagu K
 
Explore beautiful and ugly buildings. Mathematics helps us create beautiful d...
Explore beautiful and ugly buildings. Mathematics helps us create beautiful d...Explore beautiful and ugly buildings. Mathematics helps us create beautiful d...
Explore beautiful and ugly buildings. Mathematics helps us create beautiful d...christianmathematics
 
Disha NEET Physics Guide for classes 11 and 12.pdf
Disha NEET Physics Guide for classes 11 and 12.pdfDisha NEET Physics Guide for classes 11 and 12.pdf
Disha NEET Physics Guide for classes 11 and 12.pdfchloefrazer622
 
Advanced Views - Calendar View in Odoo 17
Advanced Views - Calendar View in Odoo 17Advanced Views - Calendar View in Odoo 17
Advanced Views - Calendar View in Odoo 17Celine George
 

Recently uploaded (20)

A Critique of the Proposed National Education Policy Reform
A Critique of the Proposed National Education Policy ReformA Critique of the Proposed National Education Policy Reform
A Critique of the Proposed National Education Policy Reform
 
Grant Readiness 101 TechSoup and Remy Consulting
Grant Readiness 101 TechSoup and Remy ConsultingGrant Readiness 101 TechSoup and Remy Consulting
Grant Readiness 101 TechSoup and Remy Consulting
 
Sanyam Choudhary Chemistry practical.pdf
Sanyam Choudhary Chemistry practical.pdfSanyam Choudhary Chemistry practical.pdf
Sanyam Choudhary Chemistry practical.pdf
 
Código Creativo y Arte de Software | Unidad 1
Código Creativo y Arte de Software | Unidad 1Código Creativo y Arte de Software | Unidad 1
Código Creativo y Arte de Software | Unidad 1
 
Sports & Fitness Value Added Course FY..
Sports & Fitness Value Added Course FY..Sports & Fitness Value Added Course FY..
Sports & Fitness Value Added Course FY..
 
Software Engineering Methodologies (overview)
Software Engineering Methodologies (overview)Software Engineering Methodologies (overview)
Software Engineering Methodologies (overview)
 
Mattingly "AI & Prompt Design: The Basics of Prompt Design"
Mattingly "AI & Prompt Design: The Basics of Prompt Design"Mattingly "AI & Prompt Design: The Basics of Prompt Design"
Mattingly "AI & Prompt Design: The Basics of Prompt Design"
 
The Most Excellent Way | 1 Corinthians 13
The Most Excellent Way | 1 Corinthians 13The Most Excellent Way | 1 Corinthians 13
The Most Excellent Way | 1 Corinthians 13
 
SOCIAL AND HISTORICAL CONTEXT - LFTVD.pptx
SOCIAL AND HISTORICAL CONTEXT - LFTVD.pptxSOCIAL AND HISTORICAL CONTEXT - LFTVD.pptx
SOCIAL AND HISTORICAL CONTEXT - LFTVD.pptx
 
Interactive Powerpoint_How to Master effective communication
Interactive Powerpoint_How to Master effective communicationInteractive Powerpoint_How to Master effective communication
Interactive Powerpoint_How to Master effective communication
 
Presentation by Andreas Schleicher Tackling the School Absenteeism Crisis 30 ...
Presentation by Andreas Schleicher Tackling the School Absenteeism Crisis 30 ...Presentation by Andreas Schleicher Tackling the School Absenteeism Crisis 30 ...
Presentation by Andreas Schleicher Tackling the School Absenteeism Crisis 30 ...
 
Call Girls in Dwarka Mor Delhi Contact Us 9654467111
Call Girls in Dwarka Mor Delhi Contact Us 9654467111Call Girls in Dwarka Mor Delhi Contact Us 9654467111
Call Girls in Dwarka Mor Delhi Contact Us 9654467111
 
BAG TECHNIQUE Bag technique-a tool making use of public health bag through wh...
BAG TECHNIQUE Bag technique-a tool making use of public health bag through wh...BAG TECHNIQUE Bag technique-a tool making use of public health bag through wh...
BAG TECHNIQUE Bag technique-a tool making use of public health bag through wh...
 
fourth grading exam for kindergarten in writing
fourth grading exam for kindergarten in writingfourth grading exam for kindergarten in writing
fourth grading exam for kindergarten in writing
 
Advance Mobile Application Development class 07
Advance Mobile Application Development class 07Advance Mobile Application Development class 07
Advance Mobile Application Development class 07
 
Measures of Dispersion and Variability: Range, QD, AD and SD
Measures of Dispersion and Variability: Range, QD, AD and SDMeasures of Dispersion and Variability: Range, QD, AD and SD
Measures of Dispersion and Variability: Range, QD, AD and SD
 
INDIA QUIZ 2024 RLAC DELHI UNIVERSITY.pptx
INDIA QUIZ 2024 RLAC DELHI UNIVERSITY.pptxINDIA QUIZ 2024 RLAC DELHI UNIVERSITY.pptx
INDIA QUIZ 2024 RLAC DELHI UNIVERSITY.pptx
 
Explore beautiful and ugly buildings. Mathematics helps us create beautiful d...
Explore beautiful and ugly buildings. Mathematics helps us create beautiful d...Explore beautiful and ugly buildings. Mathematics helps us create beautiful d...
Explore beautiful and ugly buildings. Mathematics helps us create beautiful d...
 
Disha NEET Physics Guide for classes 11 and 12.pdf
Disha NEET Physics Guide for classes 11 and 12.pdfDisha NEET Physics Guide for classes 11 and 12.pdf
Disha NEET Physics Guide for classes 11 and 12.pdf
 
Advanced Views - Calendar View in Odoo 17
Advanced Views - Calendar View in Odoo 17Advanced Views - Calendar View in Odoo 17
Advanced Views - Calendar View in Odoo 17
 

Hilterman et al. Child Adolesc Psychiatry Ment Health (2018)

  • 1. Hilterman et al. Child Adolesc Psychiatry Ment Health (2018) 12:15 https://doi.org/10.1186/s13034-018-0222-7 R E S E A R C H A R T I C L E Supervision trajectories of male juvenile offenders: growth mixture modeling on SAVRY risk assessments Ed L. B. Hilterman1,2,3* , Ilja L. Bongers1,2, Tonia L. Nicholls4,5 and Chijs van Nieuwenhuizen1,2 Abstract Background: Structured risk/need assessment tools are increasingly used to orientate risk reduction strategies with juvenile offenders. The assumption is that the risk/need items on these tools are sufficiently sensitive to measure changes in the individual, family and/or contextual characteristics of juvenile offenders. However, there is very little research demonstrating the capacity of these tools to measure changes in juvenile offenders. Congruent with the developmental and life-course criminology theories (DLC) the objective of this study is to explore the existence of heterogeneous trajectories of juvenile offenders across the juvenile justice system as measured through five empirical risk/need areas based on the Structured Assessment of Violence Risk in Youth (SAVRY ), one of the most widely applied risk assessment tools for juveniles. Methods: This longitudinal study included 5205 male juvenile
  • 2. offenders who transitioned through the Catalan juvenile justice system between 2006 and 2014. During intervention they received at least two, and a maximum of seven, consecutive SAVRY risk/need assessments over an 18- month period. The heterogenei ty of latent class trajecto- ries was explored through growth mixture modeling (GMM). The trajectory class membership was linked to covariates through multinomial logistic regression analyses. Results: Through GMM three to four heterogeneous trajectories, with high quality of separation, were identified in each of the risk/need areas. The trajectories with low risk/needs (45–77% of the sample) remained low and presented a very limited increase in risk/needs during the 18-month period. The high risk/need trajectories (20–37% of the sample) showed a limited decrease or no change. Between 5 and 13% of the sample had large reductions in their risk/ needs levels, and approximately 5% showed a large increase in risk/needs. Conclusions: In line with the DLC theories this study shows that trajectories on criminogenic risk/needs can be heterogeneous and indicate distinct rates of change over time. The results of this study also may suggest a limited sensibility to measure change over time of SAVRY’s risk and protective items. Suggestions to improve the sensitivity of measuring change over time, such as shorter time frames or future-oriented time frames for the scoring of the items, are offered. Keywords: Dynamic risk factors, Juvenile offenders, Growth mixture modeling, Risk assessment, Risk/need trajectories, SAVRY © The Author(s) 2018. This article is distributed under the terms of the Creative Commons Attribution 4.0 International
  • 3. License (http://creativecommons.org/licenses/by/4.0/), which permits unrestricted use, distribution, and reproduction in any medium, provided you give appropriate credit to the original author(s) and the source, provide a link to the Creative Commons license, and indicate if changes were made. The Creative Commons Public Domain Dedication waiver (http://creativecommons.org/ publicdomain/zero/1.0/) applies to the data made available in this article, unless otherwise stated. Background Juvenile offenders have been characterized as ‘moving targets’ [1]. This refers to the short-term behavioural change juvenile offenders can exhibit, and reflects the particular importance of dynamic criminogenic needs for the orientation of risk reduction strategies with adoles- cents. Especially in violence risk assessment with juvenile offenders these criminogenic needs gained importance in the shift from a prediction-oriented model to a need- oriented model. Validated risk and need assessment tools Open Access Child and Adolescent Psychiatry and Mental Health *Correspondence: [email protected] 3 Justa Mesura, Consultancy & Applied Research, Barcelona, Spain Full list of author information is available at the end of the article http://orcid.org/0000-0001-5187-3328 http://creativecommons.org/licenses/by/4.0/ http://creativecommons.org/publicdomain/zero/1.0/
  • 4. http://creativecommons.org/publicdomain/zero/1.0/ http://crossmark.crossref.org/dialog/?doi=10.1186/s13034-018- 0222-7&domain=pdf Page 2 of 15Hilterman et al. Child Adolesc Psychiatry Ment Health (2018) 12:15 played an important role in this change [2]. According to the need-oriented model, risk and need assessment tools are used to guide risk reduction strategies that target spe- cific criminogenic needs that are relevant in individual cases [3]. The underlying assumption is that the targeted risk and need factors have the capacity to change and that these variables, as defined on risk assessment meas- ures, are sensitive to change over time. Adolescent offending trajectories can change under the influence of emotional processes [4], intimate relations, neighbourhood and community processes, and life- events related to family, education or work [5]. As a result of these processes and life-events changes in offending trajectories during adolescence are common [5] and can have distinct implications such as desisting, escalating, and persisting trajectories [6]. Also the involvement in the juvenile justice system can have effects on desist- ence or persistence in delinquent behaviour. Juvenile justice programs are intended to reduce juvenile delin- quency. However, these programs often are unavailable or poor in quality [7] or do not sufficiently address the criminogenic needs of the juveniles [8]. Illustrating these problems, Viljoen et al. found that treatment received by juvenile offenders was not associated with change in their risk/needs [9]. It is important to match treatment to the individual’s risk/needs, after a comprehensive risk/need assessment [10].
  • 5. The Structured Assessment of Violence Risk in Youth (SAVRY) [11] is one of the most widely used risk and need assessment tools for juvenile offenders. Unfortu- nately, there is very little known about the extent to which SAVRY is capable of measuring the changes that juvenile offenders experience during adolescence. In a retro- spective study in Canada, Viljoen et al. [12] found that approximately one-third part of the sample of 163 juve- nile sex offenders, who attended a residential cognitive- behavioural program, showed a decrease in their average scores on the SAVRY dynamic risk items and 8% had an increase on the average scores of the protective items. In a longitudinal study with male (n = 107) and female (n = 49) juvenile offenders, Viljoen et al. [13] reported that SAVRY reassessments during the probation period were no more predictive than the initial assessment at the start of the probation, suggesting that the average change in risk/needs between the two moments in time had no influence on the predictive validity of the risk assessment. In another Canadian study of 146 juvenile offenders (69.2% male) on probation, Viljoen et al. [9] found that the SAVRY mean-level change scores (baseline scores minus follow-up scores) of the risk and protective items showed limited internal sensitivity to change (i.e., change over time). These studies were based on the assumption that change trajectories are homogeneous and reflect lin- ear change within the population of interest. However, if change trajectories are not homogeneous but het- erogeneous and consist of distinct change trajectories, for example one group with decreasing risk scores and another with increasing scores, the averaging change scores across subgroups could disguise changes, falsely indicating there is no transition over time. The identifica-
  • 6. tion of heterogeneous trajectories of change over time is congruent with the developmental and life-course crimi- nology theories (DLC) [14]. According to the DLC theo- ries, the assessment of developmental trajectories of ri sk and protective factors through longitudinal research can assist in the understanding of within-individual changes over time [15]. Following the DLC theories on the heterogeneity of developmental trajectories, the current study explored the existence of heterogeneous trajectories measured by risk and protective items of male juvenile offenders assessed on SAVRY [11]. The principal research ques- tion of this study was: Are there distinct developmental trajectories of male juvenile offenders across the juvenile justice system measured through five empirical risk/need domains based on SAVRY items? Our second question examined whether antecedents (e.g., prior violent and non-violent offenses, previously detained), demograph- ics (e.g., age) and characteristics of the transition through the juvenile justice services could differentiate between any trajectories that emerged. Methods Sample The multiyear sample consisted of 5205 male juvenile offenders for whom at least two SAVRY risk assess- ments were completed by professionals of the Catalo- nian juvenile justice system, in the period from January 2, 2006 until September 10, 2014. At the time of the first SAVRY assessment the juveniles had an average age of approximately 17 years (M = 17.64; SD = 1.40). When they were charged for their first offense, their mean age was 15.72 years (SD = 1.13). The majority of the sample was of Spanish origin (n = 2883, 55.4%); the remainder were of European (n = 191, 3.7%), African (n = 1065,
  • 7. 20.5%), South American (n = 989, 19.0%) or Asian (n = 77, 1.5%) origin. The mean total score of the first SAVRY assessment was 16.08 (SD = 9.24), with a range from 0 to 45 (theoretical range 0–48). The average total score of the protective factors was 2.71 (SD = 1.95), with a range of 0 to 6. Before the first SAVRY assessment, 86.2% (n = 4489) of the male juveniles had been charged with at least one violent offense (M = 4.51, SD = 5.10, Mdn = 3.00), and 68.0% (n = 3541) with at least one Page 3 of 15Hilterman et al. Child Adolesc Psychiatry Ment Health (2018) 12:15 non-violent offense (M = 4.05, SD = 4.83, Mdn = 3.00). The proportion of juveniles with a history of youth deten- tion was 17.3% (n = 898, M = 2.91, SD = 2.64). Measured on the number of imposed sentences (N = 13,228), the average duration of community probation in the research period was approximately 12 months (M = .97 year, Mdn = .74, SD = .71), and the average duration of deten- tion (N = 7221) in a youth detention centre was .64 years (Mdn = .49, SD = .69). Between 2006 and 2014 a total of 79,223 SAVRY assessments were completed for the sample. Due to the different duration of penal interventions the juveniles had been subject to a variable number of consecutive SAVRY assessments during their juvenile justice inter- vention. At the start of the intervention all juveniles had at least two consecutive SAVRY risk assessments, 85.23% (n = 4436) had three consecutive assessments, 66.67% (n = 3470) had four assessments, 50.70% (n = 2639) had five assessments, 38.89% (n = 2024) had six assessments and 30.41% (n = 1583) had seven consecutive SAVRY
  • 8. assessments over the 18 month study period. The total of SAVRY assessment included in this study was 24,562. Setting The Catalonian Justice department administers sentences for adults and juveniles in Catalonia, Spain. The juvenile sector is divided into three sections, pre-trial assessment, probation, and custody. The pre-trial assessment section is divided into eight units that work in close collaboration with the office of the public prosecutor. The probation section, with nine juvenile probation units, is responsible for the administration of all community sanctions. Llib- ertat vigilada, or community probation, is the most fre- quently imposed sanction. The custody section consists of six youth detention centres. Juveniles from the dif- ferent settings of the juvenile system are not necessarily distinct groups. For instance, after detention in a custo- dial setting, juveniles always have community probation and juveniles who violate the conditions of the probation can be transferred to a custodial setting. The interven- tion most often applied during the research period was probation supervision, 10.7% of juveniles were also sen- tenced to detention. Juvenile justice professionals could apply treatment components like group or individual programs directed towards violent or sexual offenders, mental health problems, drug abuse, and/or family prob- lems (Fig. 1). Measures Structured Assessment of Violence Risk in Youth (SAVRY) [11, 16] is a risk assessment tool in the structured pro- fessional judgment (SPJ) tradition. The SAVRY contains 24 risk items and 6 protective items. Each risk item is scored on a 3-point scale; low (0), moderate (1) or high risk (2). Protective items are scored present (1) or absent
  • 9. (0) (note—for interpretation purposes protective items have been reverse scored). The final summary risk rating is the product of a clinical reflection on the basis of the information gathered on the particular juvenile and is not based on a sum score. For research purposes, the risk and protective items can be summed up into total scores with a range from 0 to 48, and 0 to 6, respectively. Results regarding inter-rater reliability (intraclass cor- relation coefficients (ICC), two way random effects model for absolute agreement and single raters) with SAVRY in the Catalonian juvenile justice system have been pub- lished elsewhere and ranged from .93 for the historical items to .57 for the protective items [17]. Intraclass corre- lations are often interpreted as follows: < .40 = poor; .40 to .59 = fair; .60 to .74 = good; and .75 to 1.00 = excel- lent [18]. Instead of relying on the conceptual subscales of SAVRY proposed by the authors for the current study we used a gender sensitive order of the SAVRY items as per their categorization into five factors representing specific risk/need areas based on prior research (see Fig. 1) [17]. Three fit indices were used to assess the fit of the factor models: the comparative fit index (CFI), the Tucker– Lewis index (TLI) and a root mean square of approxi- mation (RMSEA), CFI and TLI exceeding .90, indicate acceptable fit, while values close to .95 are recommended [19]. A RMSEA value close to .06 indicates a good fit [19]. In exploratory factor analyses performed in Mplus [20], both models had a good fit (Males: CFI = .96; TLI = .94; RMSEA = .053, 90% CI .051, .055); females: (CFI = .95; TLI = .94; RMSEA = .049, 90% CI [.044, .054]) these were replicated in confirmatory factor analyses with the validation sample (Males: CFI = .94, TLI = .93, RMSEA = .059, 90% CI [.058, .061], females: CFI = .91,
  • 10. TLI = .90, RMSEA = .063, 90% CI [.058, .068]). The five risk/needs areas had good internal consistency for both genders (between .81 and .71 for males and .82–.70 for females). For the growth mixture modeling the SAVRY items of each of the five risk/need areas were summed up and divided through the theoretical range of the scale, which resulted in a score between 0 and 1. The SAVRY assessments were obtained from a database that is part of the electronic information system of the Catalonian Juvenile Justice system (Sistema d’Informació de Justícia Juvenil, SIJJ). All data were anonymized to avoid identifi - cation of participants. Criminal history data and the below listed covariates were collected for each individual from the information systems for juvenile and adult offenders of the Catalonian Department of Justice. These official databases include Page 4 of 15Hilterman et al. Child Adolesc Psychiatry Ment Health (2018) 12:15 records of impending prosecutions, convictions, and the process of the execution of sanctions. Age at first assessment reflects the date of the first SAVRY assessment. Prior offenses were classified as violent versus non-vio- lent as defined in the SAVRY manual and were measured by the number of criminal charges registered before the first SAVRY assessment. Because prior violent offenses and non-violent offenses were Poisson distributed both variables were recoded into four categories: 0 = zero
  • 11. prior offenses, 1 = first offenders with only one offense preceding the first SAVRY assessment, 2 = 2–9 offenses and 3 = 10 or more prior offenses. The first category, Fig. 1 Factor solution for SAVRY risk and protective factors for male and female juvenile offenders Page 5 of 15Hilterman et al. Child Adolesc Psychiatry Ment Health (2018) 12:15 zero prior offenses, was used as the reference category for both variables. Previous detention was measured as a dichotomous variable, with “0” not previously detained, and “1” having been detained before the first SAVRY risk assessment. Number of sector changes An increase in the number of sector changes between the three sectors of the juvenile justice system is an indication of a problematic passing through the system. Sector changes were measured from the start of the transition through the juvenile justice sys- tem, up until the last SAVRY risk/need assessment that was performed. The minimum value was “0”, and the maximum value was “3”. Sentence duration During the research period the average duration of community probation, the most fre- quently imposed sanction, was approximately 12 months (M = .97 year, Mdn = .74, SD = .71). The length of the current sentence (sentence > 1-year) was measured as a dichotomized variable with the 1-year average duration as reference (1 = sentence > 1-year, 0 = sentence ≤ 1-year).
  • 12. Procedure According to the protocols that were developed for the implementation of structured risk/need assessments in the Catalonian juvenile justice system, professionals have been using the SAVRY since 2006 for routine risk/need assessments at different points before and during the penal sanction: (a) during pre-trial assessment; (b) at the start of a youth’s probation (llibertat vigilada) or deten- tion; (c) every 3 months during the probation period or the youth’s detention; and (d) at the end of the sentence when the last assessment is performed. Following the method of structured professional judgment, SAVRY risk/need assessment was used to identify relevant goals for the intervention with every individual. From 2006 until 2008 the SAVRY was gradually implemented in the whole Catalonian juvenile justice sector. Before using SAVRY, all professionals (i.e., youth probation offic- ers, group leaders, social workers and psychologists) received 20 h of risk assessment training. After the train- ing, individual supervision was provided. Approximately 1–2 years after the initial training professionals partici - pated in an advanced training to refresh practical and theoretical knowledge. Professionals also received ongo- ing training on how to target criminogenic needs during intervention. Statistical analysis Growth mixture modeling (GMM) in Mplus 7.1 [20] was used to examine the existence of trajectory heterogeneity in the risk and need developmental pathways of juvenile offenders during their intervention in the juvenile justice system. For each possible class GMM estimates the level of the initial status (intercept), linear change over time (linear slope) and nonlinear change over time (quadratic slope) and for each variable the variance and covari -
  • 13. ance’s were estimated. A slope that is significantly differ - ent from zero indicates change over time. Change has a linear form when the trajectory is constant across the time points (linear slope) or a nonlinear curvature form (quadratic slope) when the slope describes accelerating or decelerating trajectories. The number of latent trajectory classes was estimated using three indicators: the Bayesian Information Crite- rion (BIC), the Lo-Mendell-Rubin adjusted likelihood ratio test and the class size. A model with a lower BIC value performs better in terms of taking into account both fit and parsimony. The BIC was preferred over the adjusted BIC because of its better performance with con- tinuous outcomes [21]. The Lo-Mendell-Rubin adjusted likelihood ratio test (LMR-LRT) compares the fit of the model with one more class to the previously estimated model with one less class. A significant p value of the LMR-LRT indicates that the model with one less class is rejected in favor of the model with one more class. To avoid small classes, models with a class size smaller than 3.0% were rejected as larger classes are preferred to smaller classes which can be less meaningful [21]. The entropy and the average posterior latent class prob- abilities were used to assess the quality of the trajectory classifications. Both indices have a range between 0 and 1; higher values indicate a better separation between the classes. Entropy values of .80, .60 and .40 indicate high, medium and low class separation [22]. The average latent class probability for each class reflects the highest prob- ability of each individual assigned to a particular class. To avoid incorrect class solutions due to ‘local maxima’ all models were replicated twice using the seed values from the highest log-likelihood values as described by Aspa- rouhov and Muthen [23]. Through these replications it
  • 14. was confirmed that the models were stable and the model parameters were based on the global solution. Adoles- cents with shorter sanctions have fewer SAVRY assess- ments and consequently fewer data points. Elimination of these juveniles from the research would have resulted in the absence of juveniles with shorter sanctions. To include these juveniles with less data points in the analy- sis, the full-information maximum likelihood (FIML) was used to estimate these missing data points of juveniles whose penal sanctions were shorter than 18 months [24, 25]. The trajectory class membership of the five risk/needs areas was linked to covariates through multinomial logis- tic regression analyses. To eliminate non-significant vari- ables from the equation the backward stepwise method, with the lowest risk/need trajectory classes as reference Page 6 of 15Hilterman et al. Child Adolesc Psychiatry Ment Health (2018) 12:15 categories, was used. For the interpretation of the odds ratio (OR) we followed the criteria suggested by previous research [26] in which an OR with a value between 2 and 3 was considered small, 3–5 medium and above 5 large. Results Selection of the latent trajectory classes For the risk/need areas antisocial behaviour, family func- tioning and personality the linear model with intercept and linear slope was sufficient to describe the model, the incorporation of the quadratic slope in the model resulted in LMR-LRT values that were not significant. The models of the risk/need areas social support and
  • 15. treatability improved after the incorporation of the quad- ratic slope into the model. Because of the better fit of the model, for the risk/need areas social support and treat- ability we reported the model with the incorporation of the quadratic slope, for the remaining risk/need areas the model with the linear slope was reported. For each of the risk/need areas, the optimal number of latent class trajec- tories was estimated; fit statistics for the five models are summarized in Table 1. For the risk/need area antisocial behaviour the model with three classes was preferred. Although the BIC con- tinued to decrease and the LMR-LRT was significant for the models with four classes, the four-class model identi- fied a class that was too small (.5%, n = 28). The entropy (.80) and average posterior probabilities, .93, .87 and .88, for all three classes indicated a clear separation between the trajectories. For the risk/need area family functioning a three-class model fit the data best, a model with four classes was rejected due to the non-significant LMR-LRT (p = .16). The classification indices of the three-class model of family functioning indicated a high quality of separation between classes with an entropy of .89 and average posterior probabilities of .97, .89 and .94, respec- tively. For the personality risk/need area a model with five classes was rejected by the LMR-LRT in favour of a four-class model, moreover the five-class model had one class that was too small (1.5%, n = 78). The entropy of the four-class model was .69, and the average posterior probabilities were .76, 80, .87 and .80 for the classes one to four, indicating a slightly above medium quality of class separation. For the risk/need areas social support and treatability also the quadratic slope was included in the model, this resulted in improved class separation and indicated nonlinear development over time. The four- class model fit the data best for the social support risk/
  • 16. need area; the LMT-LRT rejected the five-class model, which also had one too small class (2.1%, n = 111). For treatability, the last risk/need area based on SAVRY, a four-class model was also preferred. Although the BIC value of the five-class model was smaller compared to the BIC of the previous model, the difference was small, as was the difference between the entropy values (5-class model = .76, 4-class model = .75). The five-class model contained one class which was under the 3.0% cut-off value for the smallest class (2.2%, n = 114). The average posterior probabilities of the four-class model were, .86, .88, .84, and .84, respectively. The developmental processes of the risk/needs areas The latent class trajectories of the different risk/need areas are shown in Fig. 2. Table 1 Model fit indices for growth mixture models Entropy and LMR-LRT are not applicable for the 1-class model. The values in italics indicate the selected model BIC Bayesian Information Criterion, LMR-LRT Lo-Mendell- Rubin adjusted likelihood ratio test, Entropy average quality of classification Model BIC LMR-LRT Entropy Smallest class %/(n) Antisocial behaviour 1 − 42,552.08 n/a n/a n/a 2 − 43,352.39 p < .001 .91 .039 (202) 3 − 44,042.78 p < .001 .80 .040 (207) 4 − 44,209.88 p = .006 .84 .005 (28)
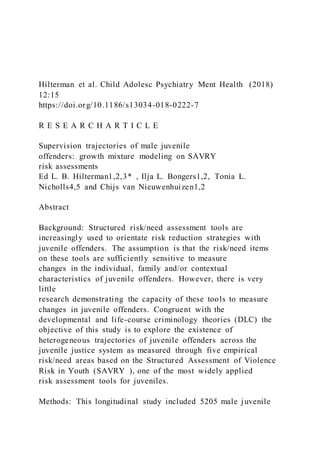
  • 17. 5 − 44,286.48 p = .33 .83 .006 (29) Family functioning 1 − 50,973.55 n/a n/a n/a 2 − 52,575.68 p < .001 .87 .209 (1088) 3 − 53,646.03 p < .001 .89 .033 (170) 4 − 54,171.66 p = .16 .87 .027 (140) 5 − 54,506.86 p = .20 .90 .021 (111) Personality 1 − 29,962.82 n/a n/a n/a 2 − 30,254.27 p < .001 .61 .318 (1653) 3 − 30,519.34 p < .001 .74 .157 (818) 4 − 30,721.70 p < .001 .69 .043 (222) 5 − 30,775.80 p = .081 .70 .015 (78) Social support 1 − 24,159.37 n/a n/a n/a 2 − 24,714.14 p < .001 .72 .337 (1755) 3 − 25,136.04 p < .001 .80 .029 (151) 4 − 25,733.02 p < .001 .82 .053 (278) 5 − 25,913.54 p = .240 .82 .021 (111) Treatability 1 − 18,466.19 n/a n/a n/a 2 − 18,845.24 p < .001 .65 .416 (2165) 3 − 18,996.01 p < .001 .67 .090 (468) 4 − 19,470.22 p < .001 .75 .049 (256) 5 − 19,559.41 p = .240 .76 .022 (114)
  • 18. Page 7 of 15Hilterman et al. Child Adolesc Psychiatry Ment Health (2018) 12:15 Antisocial behaviour The largest class (mild persisters, 72.8%, n = 3788) was characterized by a low initial status of antisocial behav- iour (βintercept = .195, p < .001), which slowly increased during the transition through juvenile justice (βlinear slope = .002, p < .001; see Fig. 2). The second largest class (High persisters, 23.2%, n = 1210) had a high initial status of antisocial behaviour (βintercept = .604, p < .001) and did not change during the study period (βlinear slope = − .001, p > .05). The smallest group, the rapid escalators (4.0%, n = 207) had a low initial status of antisocial behaviour (βintercept = .214, p < .001), and escalated rapidly to a high level (βlinear slope = .093, p < .001). Family functioning The largest group (76.8%, n = 4000) was mildly problem- atic at the starting point (βintercept = .109, p < .001), and during consecutive assessments slightly more problems were detected (βlinear slope = .001, p < .01). The second largest class (19.9%, n = 1035) was observed to be highly problematic at the initial assessment (βintercept = .632, p < .001), and this did not change over time (βslope = .002, p > .05). The smallest group (3.3%, n = 170) was Fig. 2 Latent class trajectories of the five risk/need areas based on SAVRY risk and protective factors Page 8 of 15Hilterman et al. Child Adolesc Psychiatry Ment Health (2018) 12:15
  • 19. increasingly problematic; the initial observation was mildly problematic (βintercept = .177, p < .001), but during subsequent assessments significant more problems were observed (βlinear slope = .085, p < .001). Personality The largest class (60.7%, n = 3162) was initially char- acterized by mildly problematic personality traits (βintercept = .206, p < .001), which changed minimally over the 18-months period (βlinear slope = − .003, p < .01). The highly problematic class trajectory had a high start- ing point (29.7%, n = 1546, βintercept = .596, p < .001) and exhibited limited improvement during successive assessments (βlinear slope = − .006, p < .001). The rapid responders (5.3%, n = 275), had a high initial status (βintercept = .648, p < .001), but improved rapidly dur- ing the intervention (βlinear slope = − .087, p < .001). The rapid escalators (4.3%, n = 222) started the trajectory as a mildly problematic group (βintercept = .269, p < .001), but rapidly became more problematic (βlinear slope = .076, p < .001). Social support The mildly impaired integrators were the largest group (61.5%, n = 3200, βintercept = .227, p < .001); this group remained stable during the first 6 months of the trajec- tory (βlinear slope = − .005, p > .05), and deteriorated slowly during the final 12 months (βquadratic slope = .002, p < .001). Almost a third of the sample (27.8%, n = 1448) was poorly integrated at baseline (βintercept = .709, p < .001), and did not change during subsequent assessments (βlinear slope = .000, p > .05, βquadratic slope = − .001, p > .05). The rapid integrators had a poor initial status (5.4%, n = 279, βintercept = .697, p < .001), improved rapidly dur- ing the first 12 months (βlinear slope = − .220, p < .001) but
  • 20. experienced a limited decrease towards the end of the 18-month period (βquadratic slope = .027, p < .001). To the contrary, the rapid deterioraters started out as relatively well socially integrated (5.3%, n = 278, βintercept = .275, p < .001), deteriorated rapidly during the initial 9 months (βlinear slope = .254, p < .001), but then improved slightly towards the end of the trajectory (βquadratic slope = − .036, p < .001). Treatability The largest group, the mild resisters (44.9%, n = 2337), exhibited low levels of treatment resistance at baseline (βintercept = .284, p < .001), and increased slightly after an initial decrease (βlinear slope = − .016, p < .001, βquadratic slope = .003, p < .001). The high resisters (37.2%, n = 1936, βintercept, = .719, p < .001) exhibited a high degree of resistance initially but improved somewhat after a short stable period (βlinear slope = .003, p > .05, βquadratic slope = − .003, p < .001). The rapid responders (13.0%, n = 676) started with a high degree of resistance ini- tially (βintercept = .730, p < .001), improved rapidly (βlinear slope = − .221, p < .001), but had a setback after the first 12 months (βquadratic slope = .029, p < .001). The rapid esca- lators (4.9%, n = 256) started with low-moderate resist- ance (βintercept = .320, p < .001), escalated rapidly to high resistance (βlinear slope = .227, p < .001), and improved somewhat in the last part of the intervention (βquadratic slope = − .030, p < .001), but never returned to anywhere near baseline. Association between covariates and latent trajectory class membership Tables 2 and 3 show the odds ratios and the 95% confi- dence intervals of the multinomial logistic regression analyses that link the covariates to the latent trajectory
  • 21. class membership of the risk/need areas antisocial behav- iour and family functioning (Table 2) and personality, social support and treatability (Table 3). Here we will mainly focus our discussion on medium and large odds ratios. Antisocial behaviour All variables in the model were significantly associated with trajectory class membership, which resulted in a significant fit (χ2(20) = 1326.64, p < .001, Nagelkerke R2 = .299). Under the influence of the other variables, being younger in age increased the odds (OR = .068) of being in the rapid escalator trajectory more than in de mild persisters trajectory (for example, compared to a 17 year old juvenile, a 14 year old had a 4.41 higher likelihood (4.41 = 1/.68 multiplied by the 3 years differ- ence in age) to be in the rapid escalator class). Juveniles who previously committed ten or more violent and non- violent offenses had a higher likelihood (OR = 9.10 for prior violence, OR = 8.46 for non-violent offenses) to be in the high persistent trajectory compared to juveniles with no offenses in the mild persistent trajectory. Ado- lescents who had a lower frequency of prior violent and non-violent offenses (two to nine) this likelihood was approximately three times higher for each of the offense types. For the rapid escalators only ten or more prior violent offenses increased the likelihood (OR = 4.67) of being in this rapid ascending trajectory, compared to the mild persisters who did not commit violent offenses. Also an increasing number of changes between sectors of the juvenile justice system, an indication of difficulties dur- ing the execution of the sanction, increased the odds of being in the rapid escalator trajectory (OR = 2.52 per change). The rapid escalators had a higher average num- ber of changes between the three sectors of the juvenile justice system (M = 1.43, SD = .88) compared to the mild
  • 22. Page 9 of 15Hilterman et al. Child Adolesc Psychiatry Ment Health (2018) 12:15 Table 2 Multivariate odds ratios and confidence intervals for predictors of latent trajectory membership for the risk/ need areas antisocial behaviour and family functioning (N = 5205) Antisocial behaviour Latent class trajectories Odds ratios [confidence intervals] Rapid escalators High persisters Nagelkerke R2 .299 Age at first assessment .68** [.61, .77] .99 [.94, 1.05] Prior violent offenses 0 (reference category) 1.00 1.00 1 1.12 [.57, 2.61] 1.46* [1.04, 2.05] 2–9 1.77 [.92, 3.40] 3.02** [2.30, 3.98] ≥ 10 4.67** [2.17, 10.05] 9.10** [6.38, 12.99] Prior non-violent offenses 0 (reference category) 1.00 1.00 1 1.83* [1.19, 2.82] 1.96** [1.55, 2.47] 2–9 2.18** [1.53, 3.11] 3.18** [2.64, 3.83]
  • 23. ≥ 10 1.11 [.42, 2.92] 8.46** [6.14, 11.66] Previous detention 1.47 [.84, 2.59] 2.40** [1.83, 3.14] Number of sector changes 2.52** [2.16, 2.96] 1.49** [1.36, 1.64] Sentence > 1 year 2.20** [1.46, 3.32] 2.24** [1.88, 2.66] Family functioning Latent class trajectories Odds ratios [confidence intervals] Increasingly problematic Highly problematic Nagelkerke R2 .067 Age at first assessment .83** [.74, .94] .97 [.92, 1.02] Prior violent offenses 0 (reference category) 1.00 1.00 1 2.43* [1.02, 5.76] .91 [.69, 1.21] 2–9 2.47* [1.12, 5.42] 1.21 [.96, 1.52] ≥ 10 5.35** [2.24, 12.74] 1.98** [1.44, 2.71] Prior non-violent offenses 0 (reference category) 1.00 1.00 1 .98 [.59, 1.63] 1.19 [.96, 1.47] 2–9 1.44 [.99, 2.10] 1.41** [1.18, 1.67] ≥ 10 1.87 [.99, 3.55] 2.19** [1.62, 2.96]
  • 24. Previous detention 1.24 [.73, 2.11] 1.50** [1.16, 1.94] Number of sector changes 1.55** [1.31–1.85] 1.11* [1.01, 1.22] Sentence > 1 year 1.75** [1.16, 2.63] 1.36** [1.16, 1.59] The “mild persisters” trajectory class serves as reference category in the Antisocial behaviour risk/need area, and the “mildly problematic” is the reference category in the Family functioning risk/need area. Previously detained = 1, not previously detained = 0. Duration sentence ≤ 1 year = 0, duration sentence > 1 year = 1 Multinomial logistic regression analyses, with backwards stepwise elimination, was used to link covariates to trajectory class membership * p < .05, ** p < .01 persisters (M = .44, SD = .67) and the high persisters (M = .81, SD = .90, F(2, 5202) = 263.65, p < .001). Family functioning All covariates had a significant association with trajec- tory membership and the fit of the model was signifi- cant (χ2(20) = 258.45, p < .001, Nagelkerke R2 = .067). However, the effect sizes of the odds ratios were generally small. Juveniles who were previously charged with ten or more violent offenses had a high likelihood (OR = 5.35) of being in the increasingly problematic trajectory com- pared to juveniles with no violent offenses in the mildly problematic trajectory. Compared to the mildly prob- lematic group, also the number of changes between
  • 25. Page 10 of 15Hilterman et al. Child Adolesc Psychiatry Ment Health (2018) 12:15 Table 3 Multivariate odds ratios and confidence intervals for predictors of latent trajectory membership for the risk/ need areas personality, social support and treatability (N = 5205) Personality Latent class trajectories Odds ratios [confidence intervals] Rapid responders Rapid escalators Highly problematic Nagelkerke R2 .158 Age at first assessment .85** [.78–.94] .85** [.76–.95] .87** [.83, .91] Prior violent offenses 0 (reference category) 1.00 1.00 1.00 1 1.99* [1.02, 3.86] 1.83 [.93, 3.62] 1.31* [1.01, 1.69] 2–9 2.69** [1.49, 4.86] 1.93* [1.06, 3.52] 1.68** [1.36, 2.09] ≥ 10 5.84** [2.91, 11.73] 5.04** [2.49, 10.21] 4.00** [2.92, 5.50] Prior non-violent offenses 0 (reference category) 1.00 1.00 1.00 1 1.14 [.79, 1.64] 1.40 [.90, 2.16] 1.39** [1.15, 1.68] 2–9 1.11 [.82, 1.49] 1.78** [1.26, 2.52] 1.56** [1.33, 1.82]
  • 26. ≥ 10 1.53 [.88, 2.68] 2.35** [1.29, 4.27] 2.18** [1.61, 2.95] Previous detention 1.62* [1.03, 2.56] 1.12 [.65, 1.92] 1.77** [1.36, 2.30] Number of sector changes 1.63** [1.40, 1.90] 2.21** [1.89, 2.58] 1.31** [1.20, 1.44] Sentence > 1 year 1.97** [1.45, 2.69] 2.21** [1.89, 2.58] 1.66** [1.44, 1.91] Social support Latent class trajectories Odds ratios [confidence intervals] Rapid integrators Rapid deterioraters Poorly integrated Nagelkerke R2 .137 Age at first assessment .89* [.81, .98] .86** [.78, .95] .96 [.91, 1.00] Prior violent offenses 0 (reference category) 1.00 1.00 1.00 1 1.70* [1.00, 2.89] 1.28 [.71, 2.28] 1.13* [.88, 1.46] 2–9 1.61* [1.01, 2.57] 1.62 [.99, 2.66] 1.28* [1.04, 1.58] ≥ 10 1,47 [.75, 2.89] 2.61** [1.39, 4.89] 2.43** [1.79, 3.30] Prior non-violent offenses 0 (reference category) 1.00 1.00 1.00 1 1.31 [.91, 1.90] 1.68** [1.17, 2.40] 1.52** [1.24, 1.85] 2–9 1.62** [1.20, 2.19] 1.52** [1.12, 2.06] 2.01** [1.71, 2.36]
  • 27. ≥ 10 2.20** [1.22, 3.97] 1.90* [1.03, 3.49] 3.63** [2.68, 4.91] Previous detention 2.03** [1.28, 3.23] 1.73* [1.09, 2.76] 1.88** [1.44, 2.46] Number of sector changes 1.77** [1.51, 2.06] 2.07** [1.79, 2.40] 1.31** [1.19, 1.43] Sentence > 1 year 1.12 [.85, 1.49] 1.18 [.88, 1.58] 1.80** [1.55, 2.09] Treatability Latent class trajectories Odds ratios [confidence intervals] Rapid responders Rapid escalators High resisters Nagelkerke R2 .133 Age at first assessment .86** [.80, .92] .84** [.74, .90] .86** [.82, .90] Prior violent offenses 0 (reference category) 1.00 1.00 1.00 1 1.47* [1.00, 2.16] 1.31 [.79, 2.19] .88 [.70, 1.12] 2–9 2.15** [1.54, 2.99] 1.15 [.73, 1.80] 1.09 [.89, 1.32] ≥ 10 2.07** [1.30, 3.31] 2.03* [1.12, 3.68] 1.27 [.93, 1.74] Prior non-violent offenses 0 (reference category) 1.00 1.00 1.00
  • 28. Page 11 of 15Hilterman et al. Child Adolesc Psychiatry Ment Health (2018) 12:15 sectors of the juvenile justice system increased the like- lihood of being a member of the increasingly problem- atic class (OR = 1.55 per change), more so than of being in the highly problematic class (OR = 1.11 per change), although both were significant. Personality The model had a good fit (χ2(30) = 752.41, p < .001, Nagelkerke R2 = .158). Although all covariates had a significant association with trajectory membership, the effect sizes of the odds ratios were generally small. Excep- tions were the large to medium odds ratios regarding ten or more prior charges for violent offenses and the trajec- tory membership of the rapid responders, the rapid esca- lators and the highly problematic trajectories, which were all significantly different from the mildly problematic tra- jectory. In additional multinomial logistic analyses, with the highly problematic class as the reference group and the mildly problematic class excluded, only the number of sector changes remained significant (χ2(2) = 61.34, p < .001, Nagelkerke R2 = .04, OR = 1.30; CI 95% [1.13, 1.49], for rapid responders, OR = 1.75; 95% CI [1.52, 2.03], for rapid escalators). Social support The model had a significant fit (χ2(30) = 650.19, p < .001, Nagelkerke R2 = .137) and all covariates associated sig- nificantly with trajectory membership. The effect sizes of the odds ratios were small; the only odds ratio with a medium effect size was the dummy variable ten or more prior non-violent offenses, which increased the likeli- hood of being in the poorly integrated trajectory, com- pared to juveniles with no non-violent offenses in the
  • 29. mildly impaired integrators trajectory. In comparison to the reference group, shifting between sectors of the juvenile justice system was a risk factor for the rapid deterioraters trajectory (OR = 2.07 per change) and rapid integrators trajectory (OR = 1.77 per change) and to a lesser degree for the poorly integrated trajectory (OR = 1.31 per change). Treatability All variables of the model were associated with trajec- tory class membership and contributed to the fit of the model (χ2(30) = 659.80, p < .001, Nagelkerke R2 = .133). Nonetheless, the effect sizes of the odds ratios, albeit significant, were generally small. In comparison to the mild resister subgroup, the high resisters had a moder- ate higher likelihood to have been charged previously for non-violent offenses (OR = 3.13). Compared to the mild resisters, the number of sector changes in the juve- nile justice system increased the likelihood with 1.88 and 1.89, for every change to be in the rapid escalator or rapid responder trajectories, for the high resister trajectory this likelihood was 1.64. Discussion The primary aim of this longitudinal study was to exam- ine the existence of heterogeneous latent class trajec- tories based on the 30 risk and protective items of the SAVRY in a large sample of male juvenile offenders. The identification of risk/need trajectories explores an imperative issue for need-oriented risk management: the capacity of risk/need items to change over time. Research on the changeability of risk/need items of juvenile offend- ers is scarce but also highly relevant because risk/need assessment tools increasingly inform risk reduction strat- egies for this population [27]. However, there is very little
  • 30. knowledge about the capacity of these tools to measure change over time and the current study is, as far as we know, the first study to investigate the heterogeneity of Table 3 continued Treatability Latent class trajectories Odds ratios [confidence intervals] Rapid responders Rapid escalators High resisters 1 1.43** [1.10, 1.86] 2.01** [1.36, 2.98] 1.71** [1.41, 2.06] 2–9 1.86** [1.50, 2.30] 2.32** [1.66, 3.23] 2.12** [1.81, 2.48] ≥ 10 2.66** [1.73, 4.11] 2.53** [1.32, 4.82] 3.13** [2.26, 4.35] Previous detention 2.26** [1.57, 3.24] 1.50 [.87, 2.58] 1.88** [1.40, 2.53] Number of sector changes 1.88** [1.66, 2.12] 1.89** [1.60, 2.24] 1.64** [1.48, 1.80] Sentence > 1 year .91 [.75, 1.10] 1.36* [1.00, 1.84] 1.48** [1.29, 1.69] The “mildly problematic” trajectory class serves as reference category in the personality risk/need area, the “mildly impaired integrators” is the reference category in the Social support risk/need area, and the “mild resisters” is the reference category in the treatability risk/need area Previously detained = 1, not previously detained = 0. Duration sentence ≤ 1 year = 0, duration sentence > 1 year = 1 Multinomial logistic regression analyses, with backwards stepwise elimination, was used to link covariates to trajectory
  • 31. class membership * p < .05, ** p < .01 Page 12 of 15Hilterman et al. Child Adolesc Psychiatry Ment Health (2018) 12:15 trajectories of juvenile offenders on SAVRY risk/need items. The heterogeneous trajectories that were identified in each of the five risk/need areas of the SAVRY were char- acterized by the high quality of separation between the trajectories. This indicates that the latent trajectories were distinct from each other. Regarding the principal question of this study it is important to note that the unique patterns of changes in risk/needs of the majority of the identified latent class trajectories showed signifi - cant changes over time. In the risk/need area antisocial behaviour, three trajectories were identified, of which two, the mild persisters and the rapid escalators, indi- cated significant change over time. However, the change in the mild persisters was very minimal at .08 points on a range of 0–1, what would be similar to a 1-point change in SAVRY score (e.g., the change of one risk factor from moderate to high). Similarly, two of three trajectories of the risk/need area family functioning, the mildly problematic and the increasingly problematic trajectories, showed significant change over time. The change exhibited among juve- niles within these two trajectories was unexpected since the items of the family functioning risk/need area are static risk factors. Although unexpected, these results
  • 32. may illustrate that during the adolescent’s contact with the juvenile justice system more (often potentially trau- matic) events that occurred within the family context can be identified. Notwithstanding the static nature of these items, they can generate important information [28]; in particular for possible trauma informed interventions [29]. In the area of personality, one of the risk/need areas fully composed of dynamic risk and protective factors, all four trajectories showed significant change over time. However, the highly problematic group improved a very minimal .02 points in risk/needs and the mildly problem- atic group, the largest class with low risk/needs, showed a very limited increase over time (with .03 points). The trajectory of the rapid responders showed an impor- tant improvement of .35 points (which coincides with a 5-point change in SAVRY score) in risk/needs over 18 months, but represented only 5.3% of the sample. By contrast, the trajectory of the rapid escalators (4.3%) accelerated in the opposite direction and increased .35 points in risk/needs over the same 18-month period. These results illustrate the heterogeneity of the change patterns in which different groups of adolescents developed in opposite directions over time during the 18-months study time-frame. Of the four trajectories of the social support risk/need area, the poorly integrated class was the only one that did not show significant change over time. Furthermore, the increase of .07 points during the 18-months period for the mildly impaired integrators was very limited. Conversely, the trajectory of the rapid integrators had an accelerated reduction in risk/needs (.41 points) dur- ing the first 12-months, to increase .09 point in the last
  • 33. 6-months. In comparison, the rapid deterioraters experi - enced a swift increase in risk/needs of .44 points during the first 9-months, although they did improve some- what (.15 points) during the remaining 9-months of the trajectory. In the last risk/need area, treatability, the change over time of the mild resisters (increase of .04 points) and the high resisters (improvement of .07 points) was also minimal. The trajectories of the rapid responders and the rapid escalators illustrated, as the rapid deterioraters and the rapid integrators of the risk/needs area Social sup- port, the possible curvature shape of risk/need trajecto- ries of juvenile offenders. After the baseline assessment the risk/needs trajectory of the rapid escalators group of 4.9% of the sample increased during the first three assess- ments with .41 points (equivalent to four points on this SAVRY risk/need area), to subsequently decrease with .12 points over the following 9 months. At 13% of the sample, the rapid responders group was the most preva- lent class that exhibited a large improvement (.40 points) in risk/needs during the first 9-months; however, this group then slowly increased (.10 points) towards the end of the study period. In summary, the large classes with high risk/needs did not change over time or showed limited improvement in risk/needs during the 18-month follow-up period. The trajectories with low risk/needs generally remained low and presented a very limited increase in risk/needs. Between 5 and 13% of the juveniles had large reductions in their risk/needs levels; however, approximately 5% of the juveniles had a negative development during the intervention, showing large increases in risk/needs. Trajectories with extensive change over time in oppo-
  • 34. site directions were observed in three of the risk/need areas. A visual examination of the graphs in Fig. 2 would suffice to gauge the loss of essential information in all five-risk/need areas if the trajectories were averaged. With the vast majority of research relying on analyses that reflect average sample differences, homogeneous change is assumed and the identification of unique heter- ogeneous change patterns could be hidden. The heteroge- neity of the risk/need trajectories in the current study is consistent with the DLC criminology theories. Similar to the delinquency trajectories [5, 14], the risk/need trajec- tories of juvenile offenders in the present sample demon- strate that change over time is likely to be heterogeneous. Our second research question was what characteristics identified from prior research including demograp hics Page 13 of 15Hilterman et al. Child Adolesc Psychiatry Ment Health (2018) 12:15 (age), criminal history (prior violent and non-violent offenses, previously detained), and shifting between sec- tions of the juvenile justice services could differentiate between the risk/needs trajectories. We found that the male juveniles in the low risk/needs trajectories, in com- parison with the remainder trajectories, were older in age, and had a low frequency of prior offenses, a lower likelihood of previous detention, shorter current sen- tences and experienced a very low frequency in sector changes within the juvenile justice system, indicating a smooth transition through the system. The trajectories with high risk/needs and the rapid increasing trajectories were generally the groups of offenders with more prior offenses, longer current sentences and a higher likeli-
  • 35. hood of multiple sector changes in the juvenile justice system, indicating a problematic transition through the system. The trajectories that presented a large decrease or increase in risk/needs over time were younger in com- parison with the high and low risk/need trajectories. However, the decreasing trajectories were generally not very different from the high risk/need and the increas- ing trajectories. This lack of differences may be explained by the historical nature of the majority of the covariates and that in this study we did not have access to treatment information. Nonetheless, the identified characteristics of the trajectories with low, high and escalating risk/needs are in line with the risk-needs-responsivity (RNR) model [3] in that the most problematic groups were identified with high risk/needs, and the least problematic groups with low risk/needs. Previous studies have suggested that interventions in juvenile justice services need to be improved and insuffi - ciently target criminogenic needs [7–9]. Unfortunately, in the current study we did not have the data to verify these findings. However, adolescents’ capacity to change over short periods of time has been widely documented [1, 5]. Another possibility is that SAVRY may have detected fever changes than actually occurred. This would sug- gest that the tool is not sufficiently sensitive to measure changes that juvenile offenders experience during their transition through the juvenile justice system. The results of the present study are consistent with the limited num- ber of studies on the measurement of change with SAVRY assessments [9, 12, 13]. This small body of work suggests that SAVRY has difficulties in measuring change in risk/ needs of adolescent offenders. Viljoen and colleagues recently suggested several potential strategies to enhance risk assessment tools’ sensitivity to change [9]. One of their suggestions was a shorter time frame to assess the
  • 36. items. SAVRY uses time frames that refer “to the latest 6-month period” [11] for the dynamic risk items and “the factor has been active or present over the preceding year” regarding the protective items. In assessing future behaviour the large majority of risk assessment tools ori - entate the time frames to assess the items backwards, in the direction of the history of a person: the past year or the past 3–6 months. But if the objective is the appraisal of the likelihood of future violent or delinquent behaviour of a person, it might be more logical to orient the time frames of the dynamic items towards the coming period, for example the forthcoming 3–6 months. The SAPROF is the only tool with a time frame oriented towards the future [30]. Results of the SAPROF are promising since it is one of the few adult tools that has shown the ability to measure change over time in risk/needs [31]. Limitations and future directions Our findings need to be considered in the context of the current study’s limitations. First, the use of assessments performed in a naturalistic setting has clear advantages, but using data from daily clinical practice also presents challenges. Previous studies have reported that the use of assessment measures by professionals in the field can result in lower reliability [32, 33]. However, various field studies have shown that SAVRY assessments are com- pleted with sufficient reliability in juvenile justice field settings [17, 34]. Second, our study did not have access to specific information on the nature and quality of the intervention programs provided for the juveniles, nor the intensity of these interventions. Future studies should attempt to obtain information regarding treatment and management that would provide insight into the extent to which the intensity and/or specific features of these interventions are associated with the various risk/need
  • 37. trajectories. Finally, in the present study we focused on the internal sensitivity to change through the identifica- tion of risk/need trajectories of juveniles based on their evolution on risk/need areas as they progressed through the juvenile justice system. The association between risk/ needs and offending trajectories could contribute impor- tantly to the insight of different developmental paths of juvenile offenders during their adolescence and their course through juvenile justice services and adjust treat- ment programs for specific subgroups is an important avenue for future research. That line of research could help determine if juveniles in the risk/need trajectories that show large improvements coincide with ‘desist- ers’ and the high risk/need groups correspond with life- course persistent offenders, two groups often identified in delinquency trajectories [6]. Risk assessment research has principally been based on cross-sectional research designs and between-individual differences. To validly use risk assessment tools to ori - ent and evaluate risk reduction strategies, more knowl- edge about the changeability of risk/need items of these tools should become available. Analogue with the DLC Page 14 of 15Hilterman et al. Child Adolesc Psychiatry Ment Health (2018) 12:15 theories and the numerous studies on heterogeneous criminal career trajectories, longitudinal research on the development of risk/needs over time could be employed on a broader scale. This type of research could test the heterogeneity of risk/need trajectories, based on items of risk assessment tools and accordingly evaluate their sen- sitivity to measure within-individual changes over time.
  • 38. It would also be an opportunity to test if future-oriented time frames could improve the sensitivity to measure change over time. Although SAVRY is a promising tool for risk assess- ment, recent research suggests it could be insufficiently sensitive to change over time [9, 13]. Since it is one of the most widely used risk assessment tools for adolescents there are large quantities of data available from research and implementation in juvenile justice systems world- wide [35]. It might be worthwhile to explore if this wealth of data, and the valuable experiences of its implementa- tion in juvenile justice systems [36], could be employed to improve SAVRY’s sensibility to change over time. A data driven improvement of SAVRY could also stimu- late the field towards more effective prevention and risk management. Conclusions In line with the developmental and life-course crimi- nology theories this study illustrated that latent class trajectories on the basis of SAVRY risk and protec- tive items can be heterogeneous and indicate distinct rates of change over time. Several of these trajectories revealed different patterns of changes in opposite direc- tions within the same risk/need area, demonstrating the importance of examining change in a manner that does not lose sight of this heterogeneity. Although SAVRY is a promising tool for risk assessment, this study, taken into the light of recent research [9, 13] suggests it could be insufficiently sensitive to change over time. Authors’ contributions EH was responsible for the study, the design, and the acquisition of the data. EH analysed and interpreted the data in collaboration with IB.
  • 39. EH was a major contributor in writing the manuscript. IB, TN and ChvN were involved in criti- cally revising the work. All authors read and approved the final manuscript. Author details 1 GGzE Center for Child & Adolescent Psychiatry, Eindhoven, The Netherlands. 2 Tilburg University, Scientific Center for Care and Welfare (Tranzo), Tilburg, The Netherlands. 3 Justa Mesura, Consultancy & Applied Research, Barcelona, Spain. 4 Department of Psychiatry, University of British Columbia, Vancouver, Canada. 5 BC Mental Health and Substance Use Services, Forensic Psychiatric Services Commission, Coquitlam, Canada. Acknowledgements The first author wishes to acknowledge the support of the Centre for Legal studies and Specialized Training of the Generalitat de Catalonia during the implementation phase. Competing interests The authors declare that they have no competing interests. Availability of data and materials The data that support the findings of this study are on request available from [Departament de Justicia de la Generalitat de Catalunya] but restrictions apply to the availability of these data, which were used under license for the current
  • 40. study, and so are not publicly available. Data are however available from the authors upon reasonable request and with permission of [Departament de Justicia de la Generalitat de Catalunya]. Consent for publication Not applicable. Ethics approval and consent to participate This project involved secondary analysis of anonymized data gathered through routine procedures by juvenile justice professionals. Permission to conduct the research was granted by the Catalonian Department of Justice. Funding This study did not receive any funding. Publisher’s Note Springer Nature remains neutral with regard to jurisdictional claims in pub- lished maps and institutional affiliations. Received: 23 June 2017 Accepted: 20 February 2018 References 1. Grisso T. Evaluating the properties of instruments for screening and risk assessment. In: Grisso T, Vincent G, Seagrave D, editors. Mental Health Screening Assess. Juv. justice. New York: Guildford Press; 2005. p. 71–94.
  • 41. 2. Heilbrun K. Evaluation for risk of violence in adults. New York: Oxford University Press; 2009. 3. Andrews DA, Bonta J. The psychology of criminal conduct. 2nd ed. Cin- cinnati: Anderson Publishing; 1998. 4. Giordano PC, Schroeder RD, Cernkovich SA. Emotions and crime over the life course: a neo-meadian perspective on criminal continuity and change. Am J Sociol. 2007;112:1603–61. https://doi.org/10.1086/512710. 5. Thornberry TP, Giordano PC, Uggen C, Matsuda M, Masten A, Bulten E, et al. Explanations for offending. In: Loeber R, Farrington DP, editors. From Juv. Delinq. to adult crime Crim. careers, justice policy, Prev. Oxford: Oxford University Press; 2012. p. 47–85. http://oxfordindex.oup.com/ view/10.1093/acprof:oso/9780199828166.003.0003?rskey=QE8 U0r&res ult=2. 6. Jennings WG, Reingle JM. On the number and shape of developmental/ life-course violence, aggression, and delinquency trajectories: a state-of- the-art review. J Crim Justice. 2012;40:472–89. 7. Haqanee Z, Peterson-Badali M, Skilling T. Making, “What Works” work: Examining probation officers’ experiences addressing the
  • 42. criminogenic needs of juvenile offenders. J Offender Rehabil. 2015;54:37–59. https:// doi.org/10.1080/10509674.2014.980485. 8. Peterson-Badali M, Skilling T, Haqanee Z. Examining implementa- tion of risk assessment in case management for youth in the justice system. Crim Justice Behav. 2015;42:304. http://rd8hp6du2b.search. serialssolutions.com/?ctx_ver=Z39.88-2004&ctx_enc=info:ofi/ enc:UTF- 8&rfr_id=info:sid/ProQ:socabsshell&rft_val_fmt=info:ofi/ fmt:kev:mtx:journal&rft.genre=article&rft.jtitle=Prison+Journal &rft.atitle =Justice+for+All?+Offenders+w. 9. Viljoen JL, Shaffer CS, Gray AL, Douglas KS. Are adolescent risk assessment tools sensitive to change? A framework and examination of the SAVRY and the YLS/CMI. Law Hum Behav. 2017;41:244–57. 10. Rich P. Forensic case formulation with children and adolescents. In: Sturmey P, MacMurran M, editors. Forensic case formul. Chichester: Wiley; 2011. p. 217–35. https://doi.org/10.1086/512710 http://oxfordindex.oup.com/view/10.1093/acprof:oso/978019982 8166.003.0003?rskey=QE8U0r&result=2 http://oxfordindex.oup.com/view/10.1093/acprof:oso/978019982 8166.003.0003?rskey=QE8U0r&result=2 http://oxfordindex.oup.com/view/10.1093/acprof:oso/978019982
  • 43. 8166.003.0003?rskey=QE8U0r&result=2 https://doi.org/10.1080/10509674.2014.980485 https://doi.org/10.1080/10509674.2014.980485 http://rd8hp6du2b.search.serialssolutions.com/%3fctx_ver%3dZ 39.88-2004%26ctx_enc%3dinfo:ofi/enc:UTF- 8%26rfr_id%3dinfo:sid/ProQ:socabsshell%26rft_val_fmt%3dinf o:ofi/fmt:kev:mtx:journal%26rft.genre%3darticle%26rft.jtitle% 3dPrison%2bJournal%26rft.atitle%3dJustice%2bfor%2bAll%3f %2bOffenders%2bw http://rd8hp6du2b.search.serialssolutions.com/%3fctx_ver%3dZ 39.88-2004%26ctx_enc%3dinfo:ofi/enc:UTF- 8%26rfr_id%3dinfo:sid/ProQ:socabsshell%26rft_val_fmt%3dinf o:ofi/fmt:kev:mtx:journal%26rft.genre%3darticle%26rft.jtitle% 3dPrison%2bJournal%26rft.atitle%3dJustice%2bfor%2bAll%3f %2bOffenders%2bw http://rd8hp6du2b.search.serialssolutions.com/%3fctx_ver%3dZ 39.88-2004%26ctx_enc%3dinfo:ofi/enc:UTF- 8%26rfr_id%3dinfo:sid/ProQ:socabsshell%26rft_val_fmt%3dinf o:ofi/fmt:kev:mtx:journal%26rft.genre%3darticle%26rft.jtitle% 3dPrison%2bJournal%26rft.atitle%3dJustice%2bfor%2bAll%3f %2bOffenders%2bw http://rd8hp6du2b.search.serialssolutions.com/%3fctx_ver%3dZ 39.88-2004%26ctx_enc%3dinfo:ofi/enc:UTF- 8%26rfr_id%3dinfo:sid/ProQ:socabsshell%26rft_val_fmt%3dinf o:ofi/fmt:kev:mtx:journal%26rft.genre%3darticle%26rft.jtitle% 3dPrison%2bJournal%26rft.atitle%3dJustice%2bfor%2bAll%3f %2bOffenders%2bw http://rd8hp6du2b.search.serialssolutions.com/%3fctx_ver%3dZ 39.88-2004%26ctx_enc%3dinfo:ofi/enc:UTF- 8%26rfr_id%3dinfo:sid/ProQ:socabsshell%26rft_val_fmt%3dinf o:ofi/fmt:kev:mtx:journal%26rft.genre%3darticle%26rft.jtitle% 3dPrison%2bJournal%26rft.atitle%3dJustice%2bfor%2bAll%3f %2bOffenders%2bw Page 15 of 15Hilterman et al. Child Adolesc Psychiatry Ment
  • 44. Health (2018) 12:15 • We accept pre-submission inquiries • Our selector tool helps you to find the most relevant journal • We provide round the clock customer support • Convenient online submission • Thorough peer review • Inclusion in PubMed and all major indexing services • Maximum visibility for your research Submit your manuscript at www.biomedcentral.com/submit Submit your next manuscript to BioMed Central and we will help you at every step: 11. Borum R, Bartel P, Forth A. Manual for the structured risk assessment of violence in youth (SAVRY ), version 1.1. Tampa: University of South Florida; 2003. 12. Viljoen JL, Gray AL, Shaffer C, Latzman NE, Scalora MJ, Ullman D. Changes in J-SOAP-II and SAVRY scores over the course of residential, cognitive- behavioral treatment for adolescent sexual offending. Sex Abus A J Res Treat. 2015. https://doi.org/10.1177/1079063215595404. 13. Viljoen JL, Gray AL, Shaffer C, Bhanwer A, Tafreshi D, Douglas KS. Does reassessment of risk improve predictions? A framework and examination of the SAVRY and YLS/CMI. Psychol Assess. 2016. https://doi.org/10.1037/
  • 45. pas0000402. 14. Farrington DP. Integrated developmental & life-course theories of offend- ing. New Brunswick: Transaction Publishers; 2005. 15. Loeber R, Slot NW, Stouthamer-Loeber M. A three- dimensional, cumulative developmental model of serious delinquency. In: Wikström P-OH, Sampson RJ, editors. Explan crime. Cambridge: Cambridge University Press; 2006. p. 153–94. http://ebooks.cambridge.org/ref/id/ CBO9780511489341A015. Accessed 1 Mar 2017. 16. Vallès MD, Hilterman ELB. SAVRY Manual per a la valoració estructurada de risc de violència en joves [Manual of the Spanish version of the Structured Assessment of Violence Risk in Youth]. Barcelona: Generalitat de Catalunya, Centre d’Estudis Jurídics i Formació Especialitzada; 2006. 17. Hilterman ELB, Bongers I, Nicholls TL, van Nieuwenhuizen C. Identifying gender specific risk/need areas for male and female juvenile offenders: factor analyses with the Structured Assessment of Violence Risk in Youth (SAVRY ). Law Hum Behav. 2016;40:82–96. 18. Cicchetti DV., Sparrow SA. Developing criteria for establishing inter- rater reliability of specific items: applications to assessment o f
  • 46. adaptive behavior. American Assn on Mental Retardation; 1981. p. 127– 37. http:// psycnet.apa.org/psycinfo/1982-00095-001. Accessed 24 Apr 2017. 19. Hu L, Bentler PM. Cutoff criteria for fit indexes in covariance structure analysis: Conventional criteria versus new alternatives. Struct Equ Model A Multidiscip J. 1999;6:1–55. https://doi.org/10.1080/10705519909540118. 20. Muthén LK, Muthén BO. Mplus User’s Guide. 7th edn. Muthén & Muthén; 2015. http://www.statmodel.com/download/usersguide/MplusUser- GuideVer_7.pdf. 21. Nylund KL, Asparouhov T, Muthén BO. Deciding on the number of classes in latent class analysis and growth mixture modeling: a Monte Carlo simulation study. Struct Equ Model. 2007;14:535–69. 22. Clark SL, Muthén B. Relating latent class analysis results to variables not included in the analysis. 2009. https://www.statmodel.com/download/ relatinglca.pdf. Accessed 2 Mar 2017. 23. Asparouhov T, Muthén BO. Using Mplus TECH11 and TECH14 to test the number of latent classes. Mplus Web Notes. 2012. p. 1–17. https://www. statmodel.com/examples/webnotes/webnote14.pdf. Accessed 2
  • 47. Mar 2017. 24. Little TD, Jorgensen TD, Lang KM, Moore EWG. On the joys of missing data. J Pediatr Psychol. 2014;39:151–62. https://academic.oup.com/ jpepsy/article/39/2/151/883719/On-the-Joys-of-Missing-Data. Accessed 2 Apr 2017. 25. Dong Y, Peng C-YJ. Principled missing data methods for researchers. Springerplus. 2013;2:222. https://doi.org/10.1186/2193-1801-2- 222. 26. Chen H, Cohen P, Chen S. How big is a big odds ratio? Interpreting the magnitudes of odds ratios in epidemiological studies. Commun Stat Simul Comput. 2010;39:860–4. 27. Wachter A. Statewide risk assessment in juvenile probation. JJGPS StateScan. Pittsburg: National Center for Juvenile Justice; 2015. p. 1–4. http://www.nysap.us/JJGPSStateScanStatewideRiskAssessment- updated- March2015.pdf. Accessed 20 Mar 2017. 28. Fox BH, Perez N, Cass E, Baglivio MT, Epps N. Trauma changes everything: examining the relationship between adverse childhood experiences and serious, violent and chronic juvenile offenders. Child Abus Negl.
  • 48. 2015;46:163–73. https://doi.org/10.1016/j.chiabu.2015.01.011. 29. Ford JD, Kerig PK, Desai N, Feierman J. Psychosocial interventions for traumatized youth in the juvenile justice system: research, evidence base, and clinical/legal challenges. OJJDP J. Juv. Justice. 2016;5:31– 49. 30. de Vogel V, de Ruiter C, Bouman Y, de Vries Robbé M. SAPROF. Guidelines for the assessment of protective factors for violence risk. 2nd ed. Utrecht: Van der Hoeven Stichting; 2012. 31. de Vries Robbé M, de Vogel V, Douglas KS, Nijman HLI. Changes in dynamic risk and protective factors for violence during inpatient forensic psychiatric treatment: Predicting reductions in postdischarge community recidivism. Law Hum Behav. 2015;39:53–61. https://doi.org/10.1037/ lhb0000089. 32. Boccaccini MT, Turner DB, Murrie DC. Do some evaluators report consist- ently higher or lower PCL-R scores than others? Findings from a statewide sample of sexually violent predator evaluations. Psychol Public Policy Law. 2008;14:262–83. https://doi.org/10.1037/a0014523. 33. Edens JF, Vincent GM. Juvenile psychopathy: a clinical construct in need of restraint? J. Forensic Psychol Pract. 2008;8:186–97.
  • 49. https://doi. org/10.1080/15228930801964042. 34. Vincent GM, Guy LS, Fusco SL, Gershenson BG. Field reliability of the SAVRY with juvenile probation officers: Implications for training. Law Hum Behav. 2012;36:1–14. https://doi.org/10.1037/h0093974. 35. Borum R, Lodewijks H, Bartel PA, Forth A. Structured Assessment of Violence Risk in Youth (SAVRY ). In: Otto RK, Douglas KS, editors. Handbook violence risk Assess. New York: Routledge; 2010. p. 63–80. 36. Vincent GM, Guy LS, Perrault RT, Gershenson B. Risk assessment matters, but only when implemented well: a multisite study in juvenile probation. Law Hum Behav. 2016;40:683–96. https://doi.org/10.1037/lhb0000214. https://doi.org/10.1177/1079063215595404 https://doi.org/10.1037/pas0000402 https://doi.org/10.1037/pas0000402 http://ebooks.cambridge.org/ref/id/CBO9780511489341A015 http://ebooks.cambridge.org/ref/id/CBO9780511489341A015 http://psycnet.apa.org/psycinfo/1982-00095-001 http://psycnet.apa.org/psycinfo/1982-00095-001 https://doi.org/10.1080/10705519909540118 http://www.statmodel.com/download/usersguide/MplusUserGuid eVer_7.pdf http://www.statmodel.com/download/usersguide/MplusUserGuid eVer_7.pdf https://www.statmodel.com/download/relatinglca.pdf https://www.statmodel.com/download/relatinglca.pd f
  • 50. https://www.statmodel.com/examples/webnotes/webnote14.pdf https://www.statmodel.com/examples/webnotes/webnote14.pdf https://academic.oup.com/jpepsy/article/39/2/151/883719/On- the-Joys-of-Missing-Data https://academic.oup.com/jpepsy/article/39/2/151/88371 9/On- the-Joys-of-Missing-Data https://doi.org/10.1186/2193-1801-2-222 http://www.nysap.us/JJGPSStateScanStatewideRiskAssessment- updatedMarch2015.pdf http://www.nysap.us/JJGPSStateScanStatewideRiskAssessment- updatedMarch2015.pdf https://doi.org/10.1016/j.chiabu.2015.01.011 https://doi.org/10.1037/lhb0000089 https://doi.org/10.1037/lhb0000089 https://doi.org/10.1037/a0014523 https://doi.org/10.1080/15228930801964042 https://doi.org/10.1080/15228930801964042 https://doi.org/10.1037/h0093974 https://doi.org/10.1037/lhb0000214 BioMed Central publishes under the Creative Commons Attribution License (CCAL). Under the CCAL, authors retain copyright to the article but users are allowed to download, reprint, distribute and /or copy articles in BioMed Central journal s, as long as the original work is properly cited. Supervision trajectories of male juvenile offenders: growth mixture modeling on SAVRY risk assessmentsAbstract Background: Methods: Results: Conclusions: BackgroundMethodsSampleSettingMeasuresProcedureStatistical analysisResultsSelection of the latent trajectory classesThe developmental processes of the riskneeds areasAntisocial behaviourFamily functioningPersonalitySocial supportTreatabilityAssociation between covariates and latent
  • 51. trajectory class membershipAntisocial behaviourFamily functioningPersonalitySocial supportTreatabilityDiscussionLimitations and future directionsConclusionsAuthors’ contributionsReferences