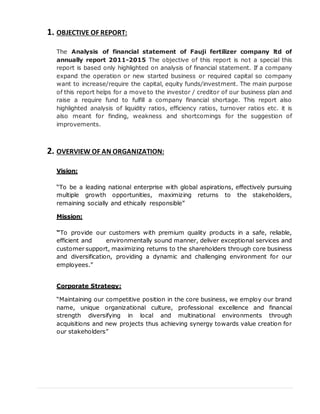
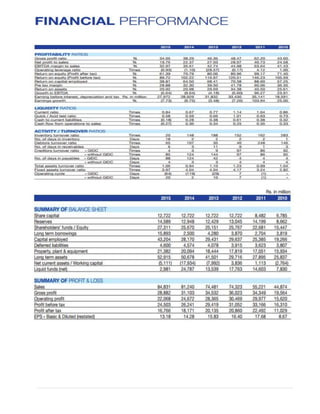
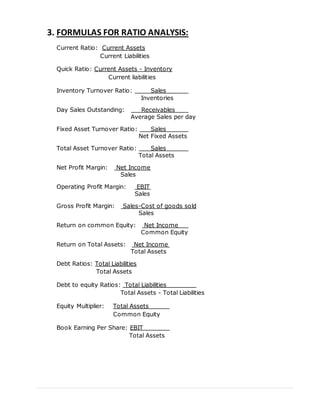
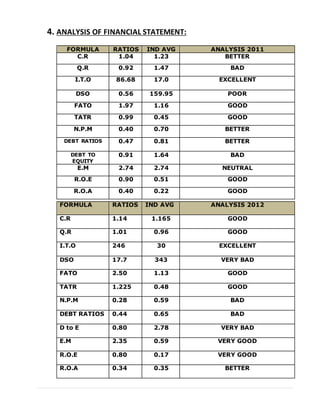
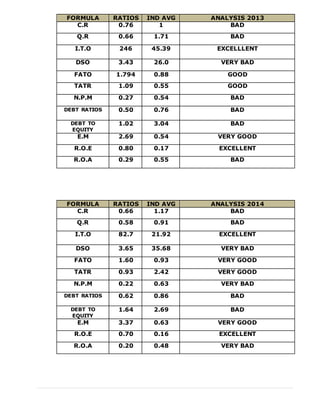
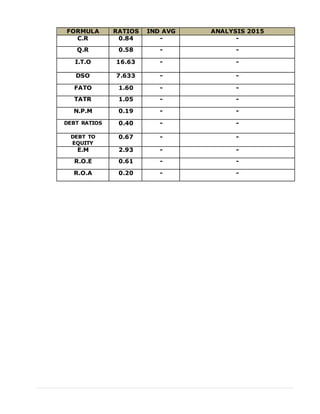
ANALYSIS OF FINANCIAL STATEMENT
“FAUJI FERITILZER COMPANY LTD”
SUBMITTED BY:
 Umair khan
 Bachelor of Business Administration
 BBA – Evening (VII)
 Roll No. 1307534
 Enrolment No. BBA/E/11004/13
 Mobile No. 0332-2375948
 Email. Umair.khan418@hotmail.com
 Federal Urdu University Gulshan Campus Karachi, Pakistan
 Report Submission: 19/NOV/2016
SUBMITTED TO:
 SIR ABDUL AZIZ ALI
 Course: Analysis of Financial Statement
 Assignment - I
Table of Contents
1) OBJECTIVE OF REPORT
2) OVERVIEW OF AN ORGANIZTION & FINANCIAL PEROFOMANCE
3) FORMULAS FOR RATIOS ANALYSIS
4) ANALYSIS OF FINANCIAL STATEMENT 2011
5) ANALYSIS OF FINANCIAL STATEMENT 2012
6) ANALYSIS OF FINANCIAL STATEMENT 2013
7) ANALYSIS OF FINANCIAL STATEMENT
1. OBJECTIVE OF REPORT:
The Analysis of financial statement of Fauji fertilizer company ltd of
annually report 2011-2015 The objective of this report is not a special this
report is based only highlighted on analysis of financial statement. If a company
expand the operation or new started business or required capital so company
want to increase/require the capital, equity funds/investment. The main purpose
of this report helps for a move to the investor / creditor of our business plan and
raise a require fund to fulfill a company financial shortage. This report also
highlighted analysis of liquidity ratios, efficiency ratios, turnover ratios etc. it is
also meant for finding, weakness and shortcomings for the suggestion of
improvements.
2. OVERVIEW OF AN ORGANIZATION:
Vision:
“To be a leading national enterprise with global aspirations, effectively pursuing
multiple growth opportunities, maximizing returns to the stakeholders,
remaining socially and ethically responsible”
Mission:
“To provide our customers with premium quality products in a safe, reliable,
efficient and environmentally sound manner, deliver exceptional services and
customer support, maximizing returns to the shareholders through core business
and diversification, providing a dynamic and challenging environment for our
employees.”
Corporate Strategy:
“Maintaining our competitive position in the core business, we employ our brand
name, unique organizational culture, professional excellence and financial
strength diversifying in local and multinational environments through
acquisitions and new projects thus achieving synergy towards value creation for
our stakeholders”
3. FORMULAS FOR RATIO ANALYSIS:
Current Ratio: Current Assets
Current Liabilities
Quick Ratio: Current Assets - Inventory
Current liabilities
Inventory Turnover Ratio: Sales
Inventories
Day Sales Outstanding: Receivables
Average Sales per day
Fixed Asset Turnover Ratio: Sales
Net Fixed Assets
Total Asset Turnover Ratio: Sales
Total Assets
Net Profit Margin: Net Income
Sales
Operating Profit Margin: EBIT
Sales
Gross Profit Margin: Sales-Cost of goods sold
Sales
Return on common Equity: Net Income
Common Equity
Return on Total Assets: Net Income
Total Assets
Debt Ratios: Total Liabilities
Total Assets
Debt to equity Ratios: Total Liabilities
Total Assets - Total Liabilities
Equity Multiplier: Total Assets
Common Equity
Book Earning Per Share: EBIT
Total Assets
4. ANALYSIS OF FINANCIAL STATEMENT:
FORMULA RATIOS IND AVG ANALYSIS 2011
C.R 1.04 1.23 BETTER
Q.R 0.92 1.47 BAD
I.T.O 86.68 17.0 EXCELLENT
DSO 0.56 159.95 POOR
FATO 1.97 1.16 GOOD
TATR 0.99 0.45 GOOD
N.P.M 0.40 0.70 BETTER
DEBT RATIOS 0.47 0.81 BETTER
DEBT TO
EQUITY
0.91 1.64 BAD
E.M 2.74 2.74 NEUTRAL
R.O.E 0.90 0.51 GOOD
R.O.A 0.40 0.22 GOOD
FORMULA RATIOS IND AVG ANALYSIS 2012
C.R 1.14 1.165 GOOD
Q.R 1.01 0.96 GOOD
I.T.O 246 30 EXCELLENT
DSO 17.7 343 VERY BAD
FATO 2.50 1.13 GOOD
TATR 1.225 0.48 GOOD
N.P.M 0.28 0.59 BAD
DEBT RATIOS 0.44 0.65 BAD
D to E 0.80 2.78 VERY BAD
E.M 2.35 0.59 VERY GOOD
R.O.E 0.80 0.17 VERY GOOD
R.O.A 0.34 0.35 BETTER
FORMULA RATIOS IND AVG ANALYSIS 2013
C.R 0.76 1 BAD
Q.R 0.66 1.71 BAD
I.T.O 246 45.39 EXCELLLENT
DSO 3.43 26.0 VERY BAD
FATO 1.794 0.88 GOOD
TATR 1.09 0.55 GOOD
N.P.M 0.27 0.54 BAD
DEBT RATIOS 0.50 0.76 BAD
DEBT TO
EQUITY
1.02 3.04 BAD
E.M 2.69 0.54 VERY GOOD
R.O.E 0.80 0.17 EXCELLENT
R.O.A 0.29 0.55 BAD
FORMULA RATIOS IND AVG ANALYSIS 2014
C.R 0.66 1.17 BAD
Q.R 0.58 0.91 BAD
I.T.O 82.7 21.92 EXCELLENT
DSO 3.65 35.68 VERY BAD
FATO 1.60 0.93 VERY GOOD
TATR 0.93 2.42 VERY GOOD
N.P.M 0.22 0.63 VERY BAD
DEBT RATIOS 0.62 0.86 BAD
DEBT TO
EQUITY
1.64 2.69 BAD
E.M 3.37 0.63 VERY GOOD
R.O.E 0.70 0.16 EXCELLENT
R.O.A 0.20 0.48 VERY BAD
FORMULA RATIOS IND AVG ANALYSIS 2015
C.R 0.84 - -
Q.R 0.58 - -
I.T.O 16.63 - -
DSO 7.633 - -
FATO 1.60 - -
TATR 1.05 - -
N.P.M 0.19 - -
DEBT RATIOS 0.40 - -
DEBT TO
EQUITY
0.67 - -
E.M 2.93 - -
R.O.E 0.61 - -
R.O.A 0.20 - -
Higlighted analysis of financial statement

Higlighted analysis of financial statement

  • 1.
    ANALYSIS OF FINANCIALSTATEMENT “FAUJI FERITILZER COMPANY LTD” SUBMITTED BY:  Umair khan  Bachelor of Business Administration  BBA – Evening (VII)  Roll No. 1307534  Enrolment No. BBA/E/11004/13  Mobile No. 0332-2375948  Email. Umair.khan418@hotmail.com  Federal Urdu University Gulshan Campus Karachi, Pakistan  Report Submission: 19/NOV/2016 SUBMITTED TO:  SIR ABDUL AZIZ ALI  Course: Analysis of Financial Statement  Assignment - I
  • 2.
    Table of Contents 1)OBJECTIVE OF REPORT 2) OVERVIEW OF AN ORGANIZTION & FINANCIAL PEROFOMANCE 3) FORMULAS FOR RATIOS ANALYSIS 4) ANALYSIS OF FINANCIAL STATEMENT 2011 5) ANALYSIS OF FINANCIAL STATEMENT 2012 6) ANALYSIS OF FINANCIAL STATEMENT 2013 7) ANALYSIS OF FINANCIAL STATEMENT
  • 3.
    1. OBJECTIVE OFREPORT: The Analysis of financial statement of Fauji fertilizer company ltd of annually report 2011-2015 The objective of this report is not a special this report is based only highlighted on analysis of financial statement. If a company expand the operation or new started business or required capital so company want to increase/require the capital, equity funds/investment. The main purpose of this report helps for a move to the investor / creditor of our business plan and raise a require fund to fulfill a company financial shortage. This report also highlighted analysis of liquidity ratios, efficiency ratios, turnover ratios etc. it is also meant for finding, weakness and shortcomings for the suggestion of improvements. 2. OVERVIEW OF AN ORGANIZATION: Vision: “To be a leading national enterprise with global aspirations, effectively pursuing multiple growth opportunities, maximizing returns to the stakeholders, remaining socially and ethically responsible” Mission: “To provide our customers with premium quality products in a safe, reliable, efficient and environmentally sound manner, deliver exceptional services and customer support, maximizing returns to the shareholders through core business and diversification, providing a dynamic and challenging environment for our employees.” Corporate Strategy: “Maintaining our competitive position in the core business, we employ our brand name, unique organizational culture, professional excellence and financial strength diversifying in local and multinational environments through acquisitions and new projects thus achieving synergy towards value creation for our stakeholders”
  • 5.
    3. FORMULAS FORRATIO ANALYSIS: Current Ratio: Current Assets Current Liabilities Quick Ratio: Current Assets - Inventory Current liabilities Inventory Turnover Ratio: Sales Inventories Day Sales Outstanding: Receivables Average Sales per day Fixed Asset Turnover Ratio: Sales Net Fixed Assets Total Asset Turnover Ratio: Sales Total Assets Net Profit Margin: Net Income Sales Operating Profit Margin: EBIT Sales Gross Profit Margin: Sales-Cost of goods sold Sales Return on common Equity: Net Income Common Equity Return on Total Assets: Net Income Total Assets Debt Ratios: Total Liabilities Total Assets Debt to equity Ratios: Total Liabilities Total Assets - Total Liabilities Equity Multiplier: Total Assets Common Equity Book Earning Per Share: EBIT Total Assets
  • 6.
    4. ANALYSIS OFFINANCIAL STATEMENT: FORMULA RATIOS IND AVG ANALYSIS 2011 C.R 1.04 1.23 BETTER Q.R 0.92 1.47 BAD I.T.O 86.68 17.0 EXCELLENT DSO 0.56 159.95 POOR FATO 1.97 1.16 GOOD TATR 0.99 0.45 GOOD N.P.M 0.40 0.70 BETTER DEBT RATIOS 0.47 0.81 BETTER DEBT TO EQUITY 0.91 1.64 BAD E.M 2.74 2.74 NEUTRAL R.O.E 0.90 0.51 GOOD R.O.A 0.40 0.22 GOOD FORMULA RATIOS IND AVG ANALYSIS 2012 C.R 1.14 1.165 GOOD Q.R 1.01 0.96 GOOD I.T.O 246 30 EXCELLENT DSO 17.7 343 VERY BAD FATO 2.50 1.13 GOOD TATR 1.225 0.48 GOOD N.P.M 0.28 0.59 BAD DEBT RATIOS 0.44 0.65 BAD D to E 0.80 2.78 VERY BAD E.M 2.35 0.59 VERY GOOD R.O.E 0.80 0.17 VERY GOOD R.O.A 0.34 0.35 BETTER
  • 7.
    FORMULA RATIOS INDAVG ANALYSIS 2013 C.R 0.76 1 BAD Q.R 0.66 1.71 BAD I.T.O 246 45.39 EXCELLLENT DSO 3.43 26.0 VERY BAD FATO 1.794 0.88 GOOD TATR 1.09 0.55 GOOD N.P.M 0.27 0.54 BAD DEBT RATIOS 0.50 0.76 BAD DEBT TO EQUITY 1.02 3.04 BAD E.M 2.69 0.54 VERY GOOD R.O.E 0.80 0.17 EXCELLENT R.O.A 0.29 0.55 BAD FORMULA RATIOS IND AVG ANALYSIS 2014 C.R 0.66 1.17 BAD Q.R 0.58 0.91 BAD I.T.O 82.7 21.92 EXCELLENT DSO 3.65 35.68 VERY BAD FATO 1.60 0.93 VERY GOOD TATR 0.93 2.42 VERY GOOD N.P.M 0.22 0.63 VERY BAD DEBT RATIOS 0.62 0.86 BAD DEBT TO EQUITY 1.64 2.69 BAD E.M 3.37 0.63 VERY GOOD R.O.E 0.70 0.16 EXCELLENT R.O.A 0.20 0.48 VERY BAD
  • 8.
    FORMULA RATIOS INDAVG ANALYSIS 2015 C.R 0.84 - - Q.R 0.58 - - I.T.O 16.63 - - DSO 7.633 - - FATO 1.60 - - TATR 1.05 - - N.P.M 0.19 - - DEBT RATIOS 0.40 - - DEBT TO EQUITY 0.67 - - E.M 2.93 - - R.O.E 0.61 - - R.O.A 0.20 - -