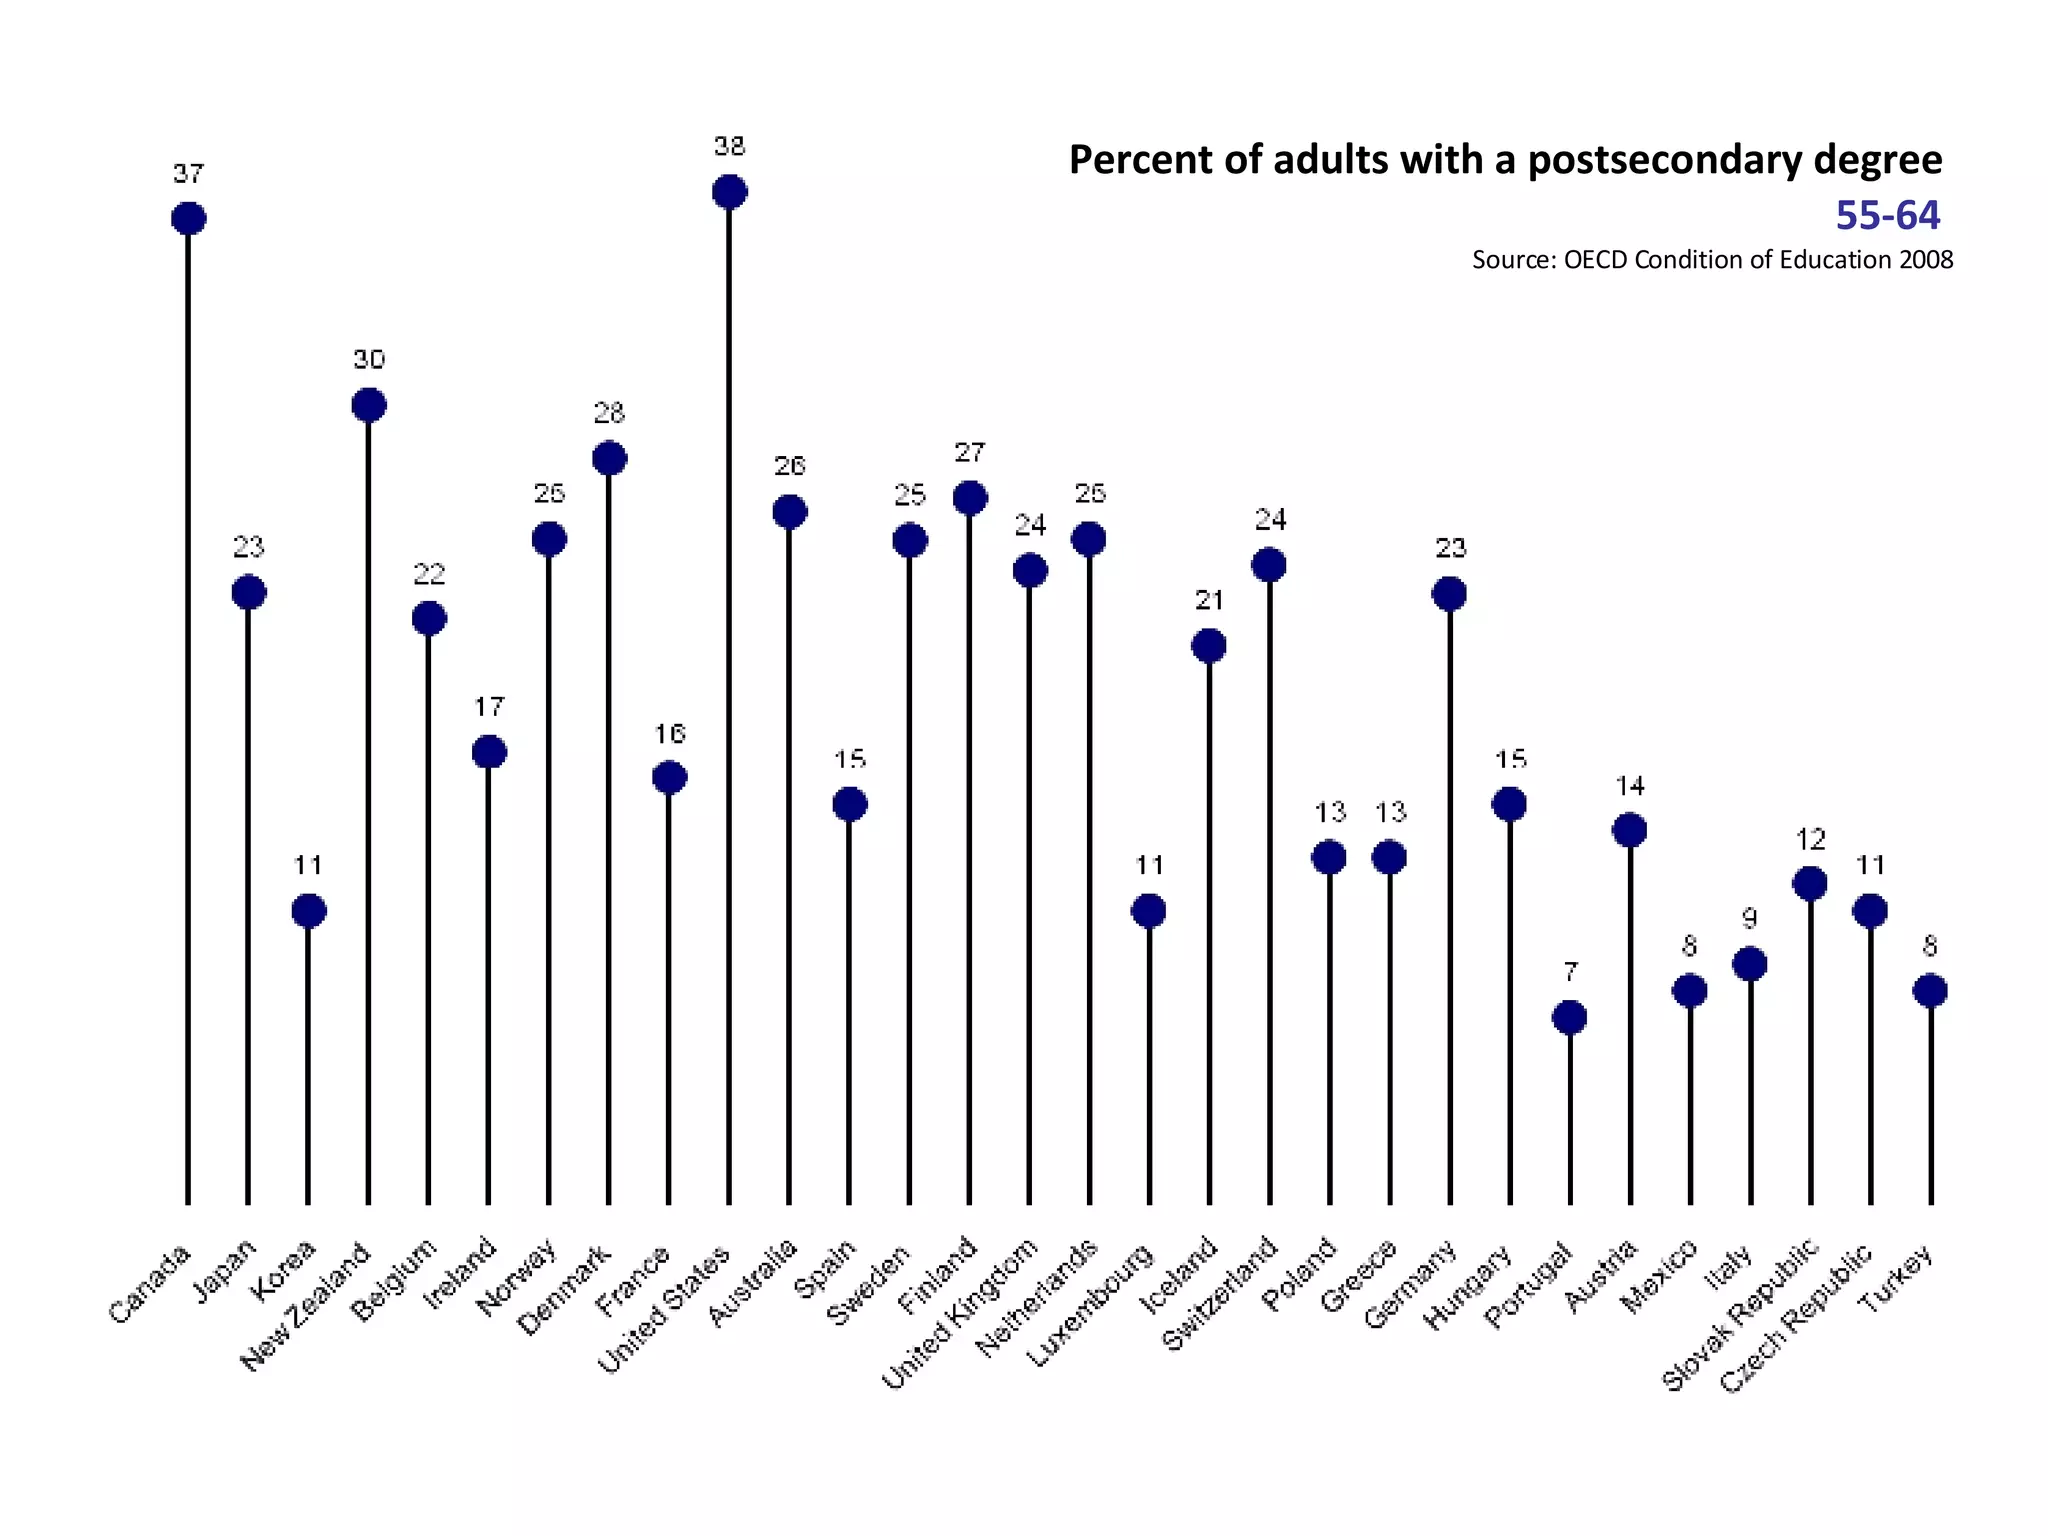
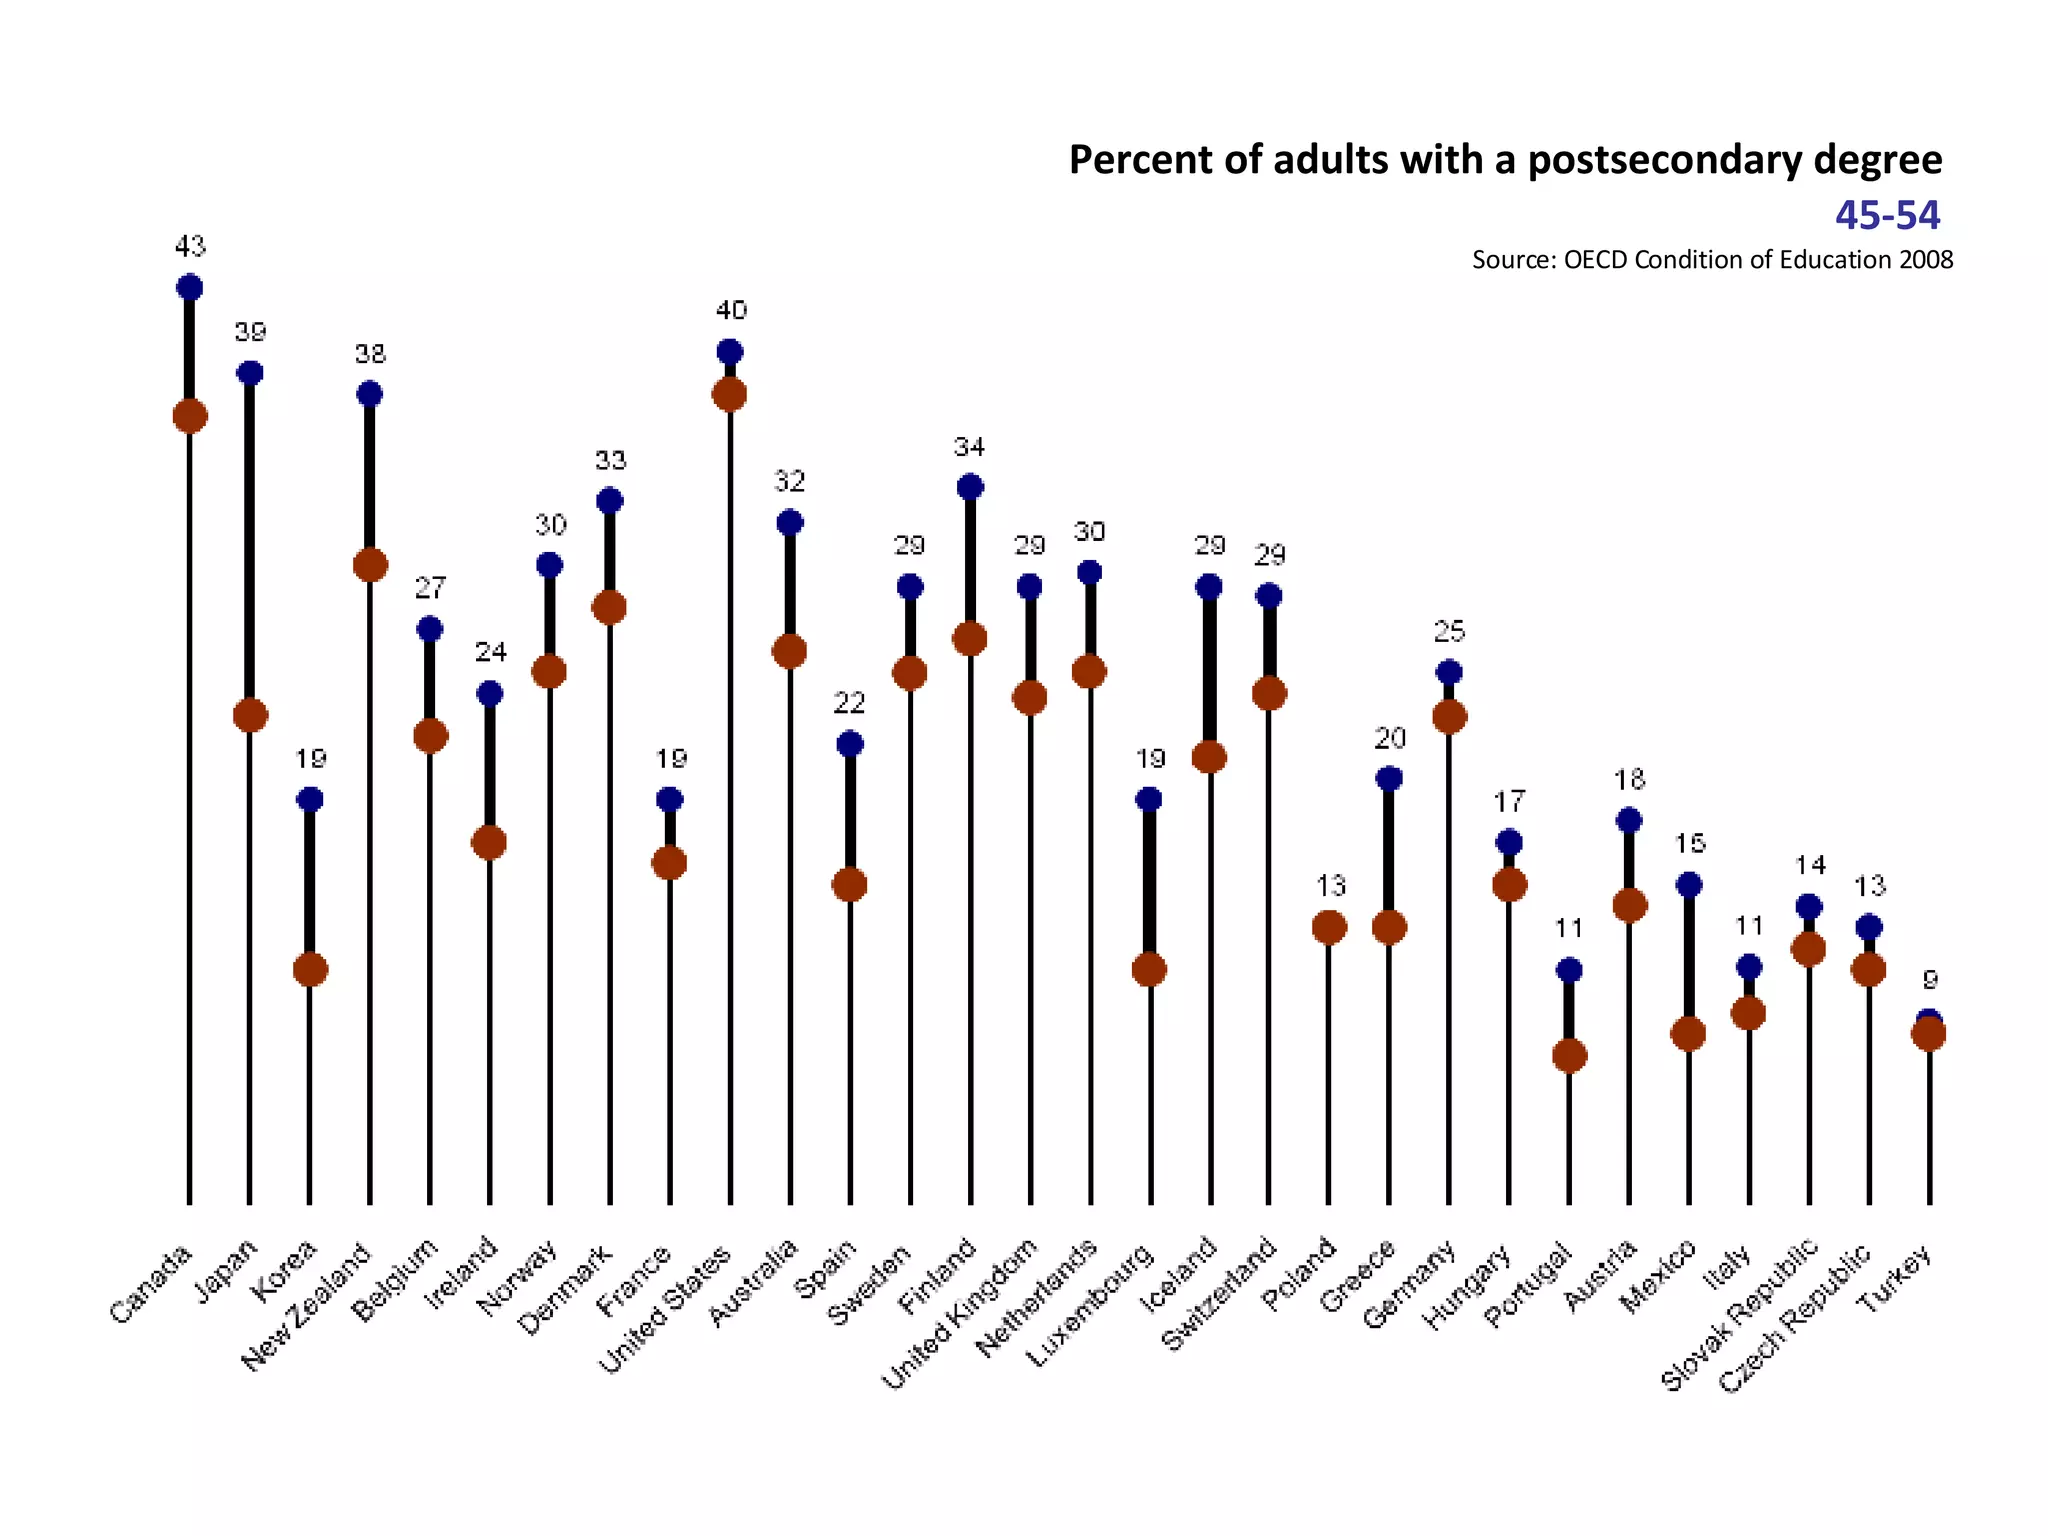
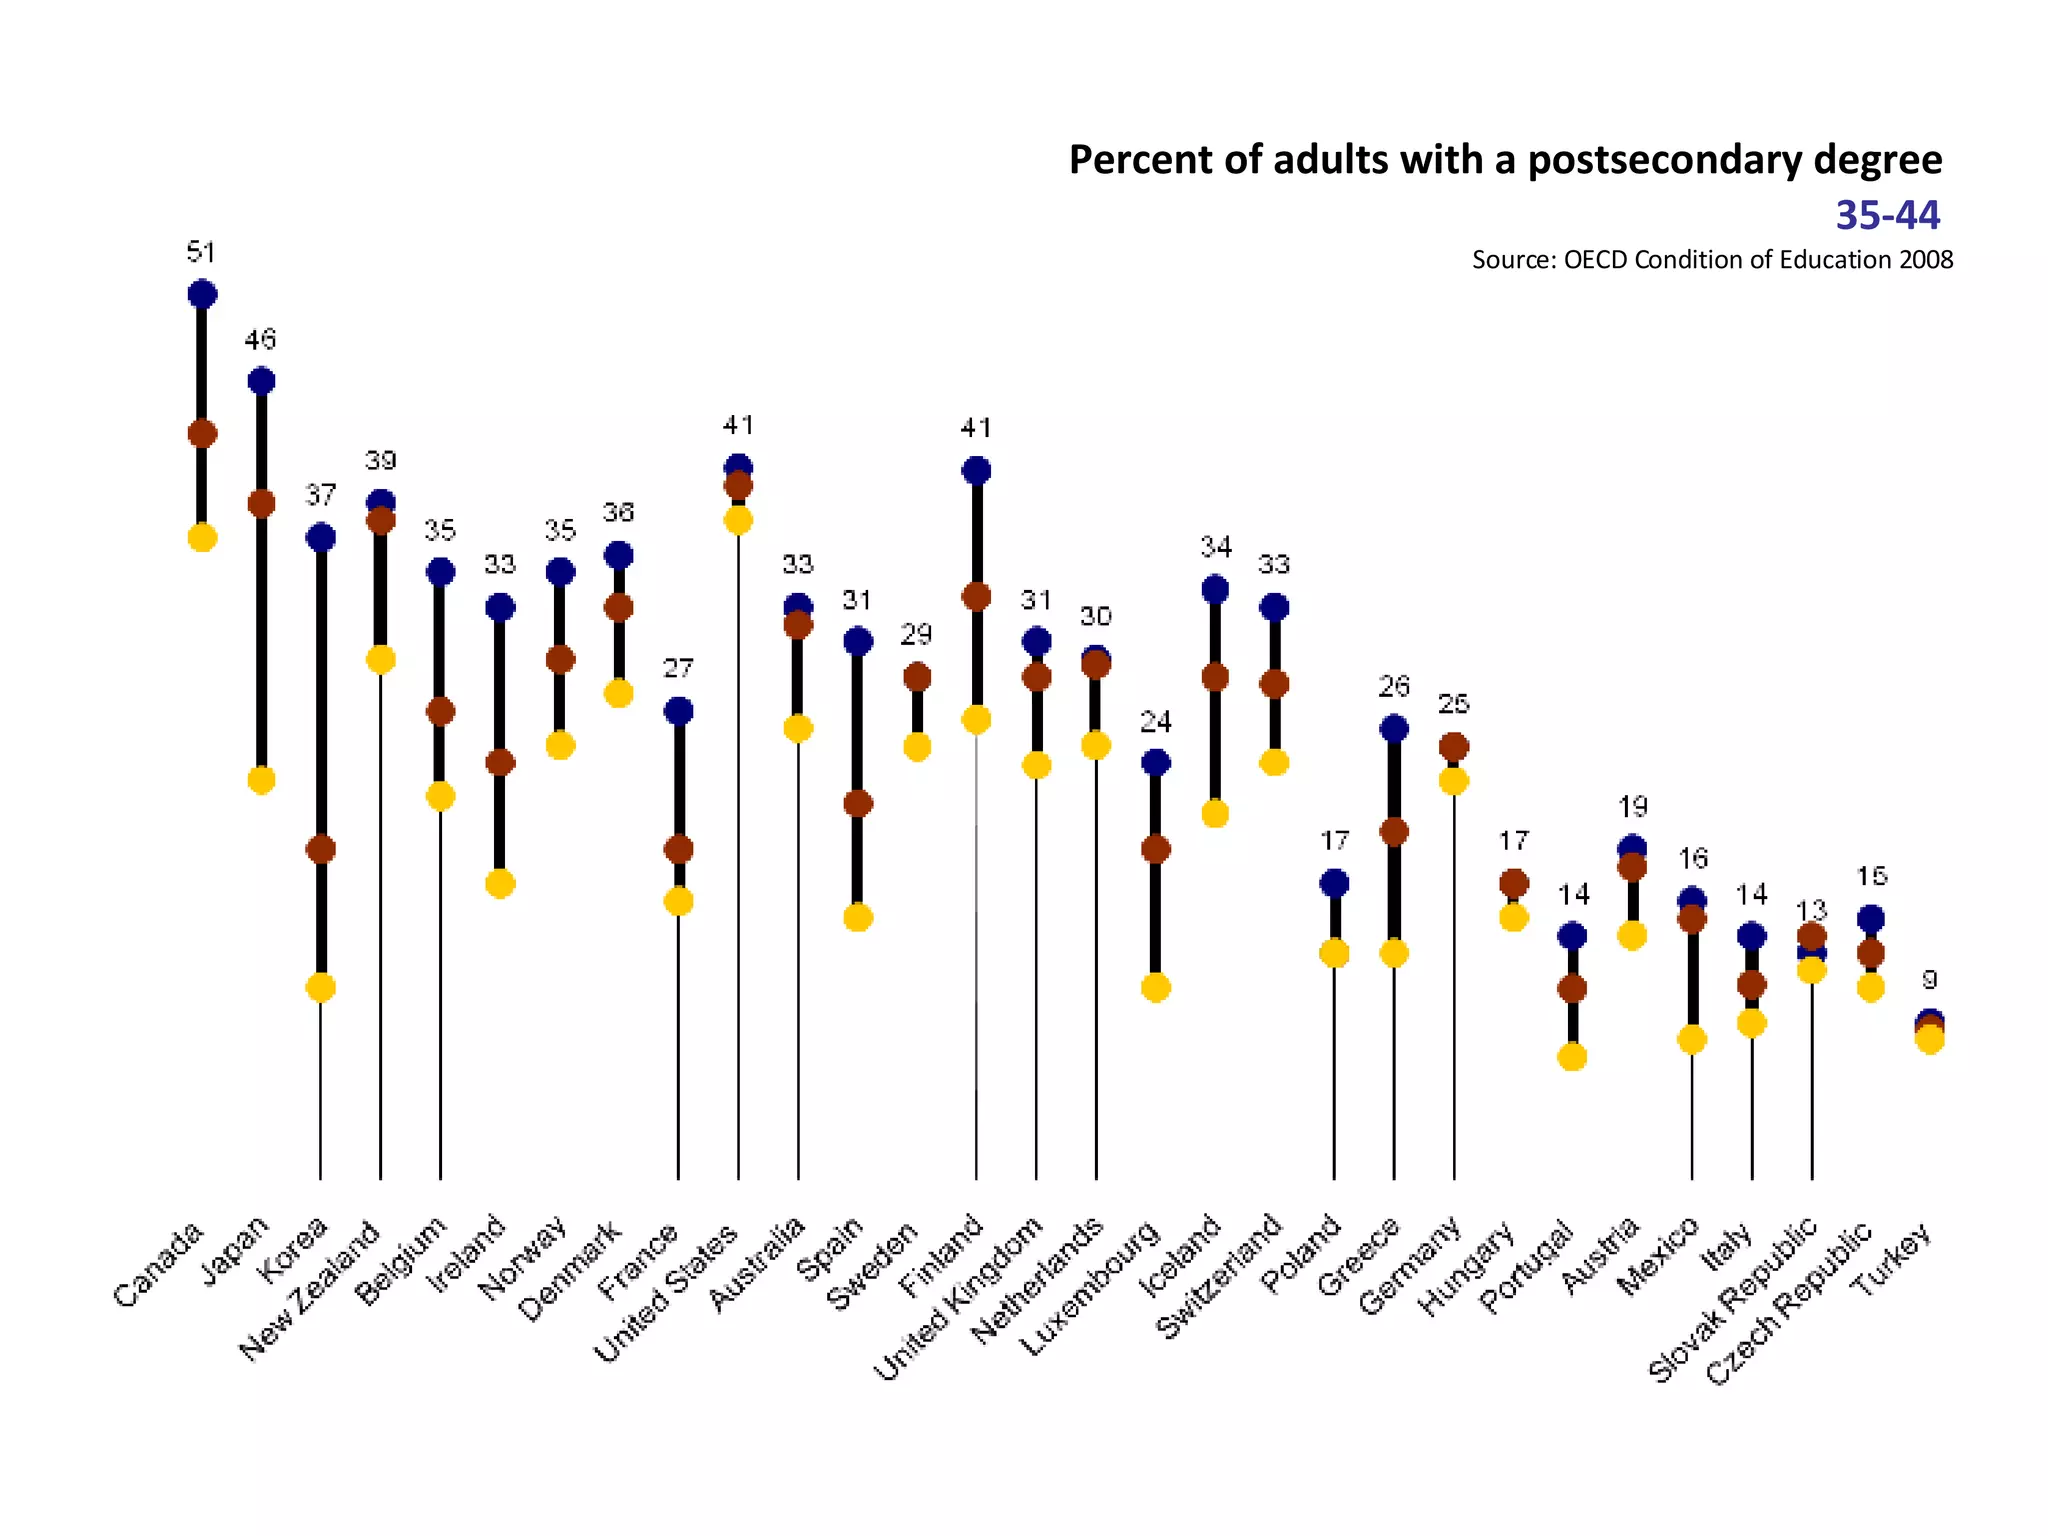
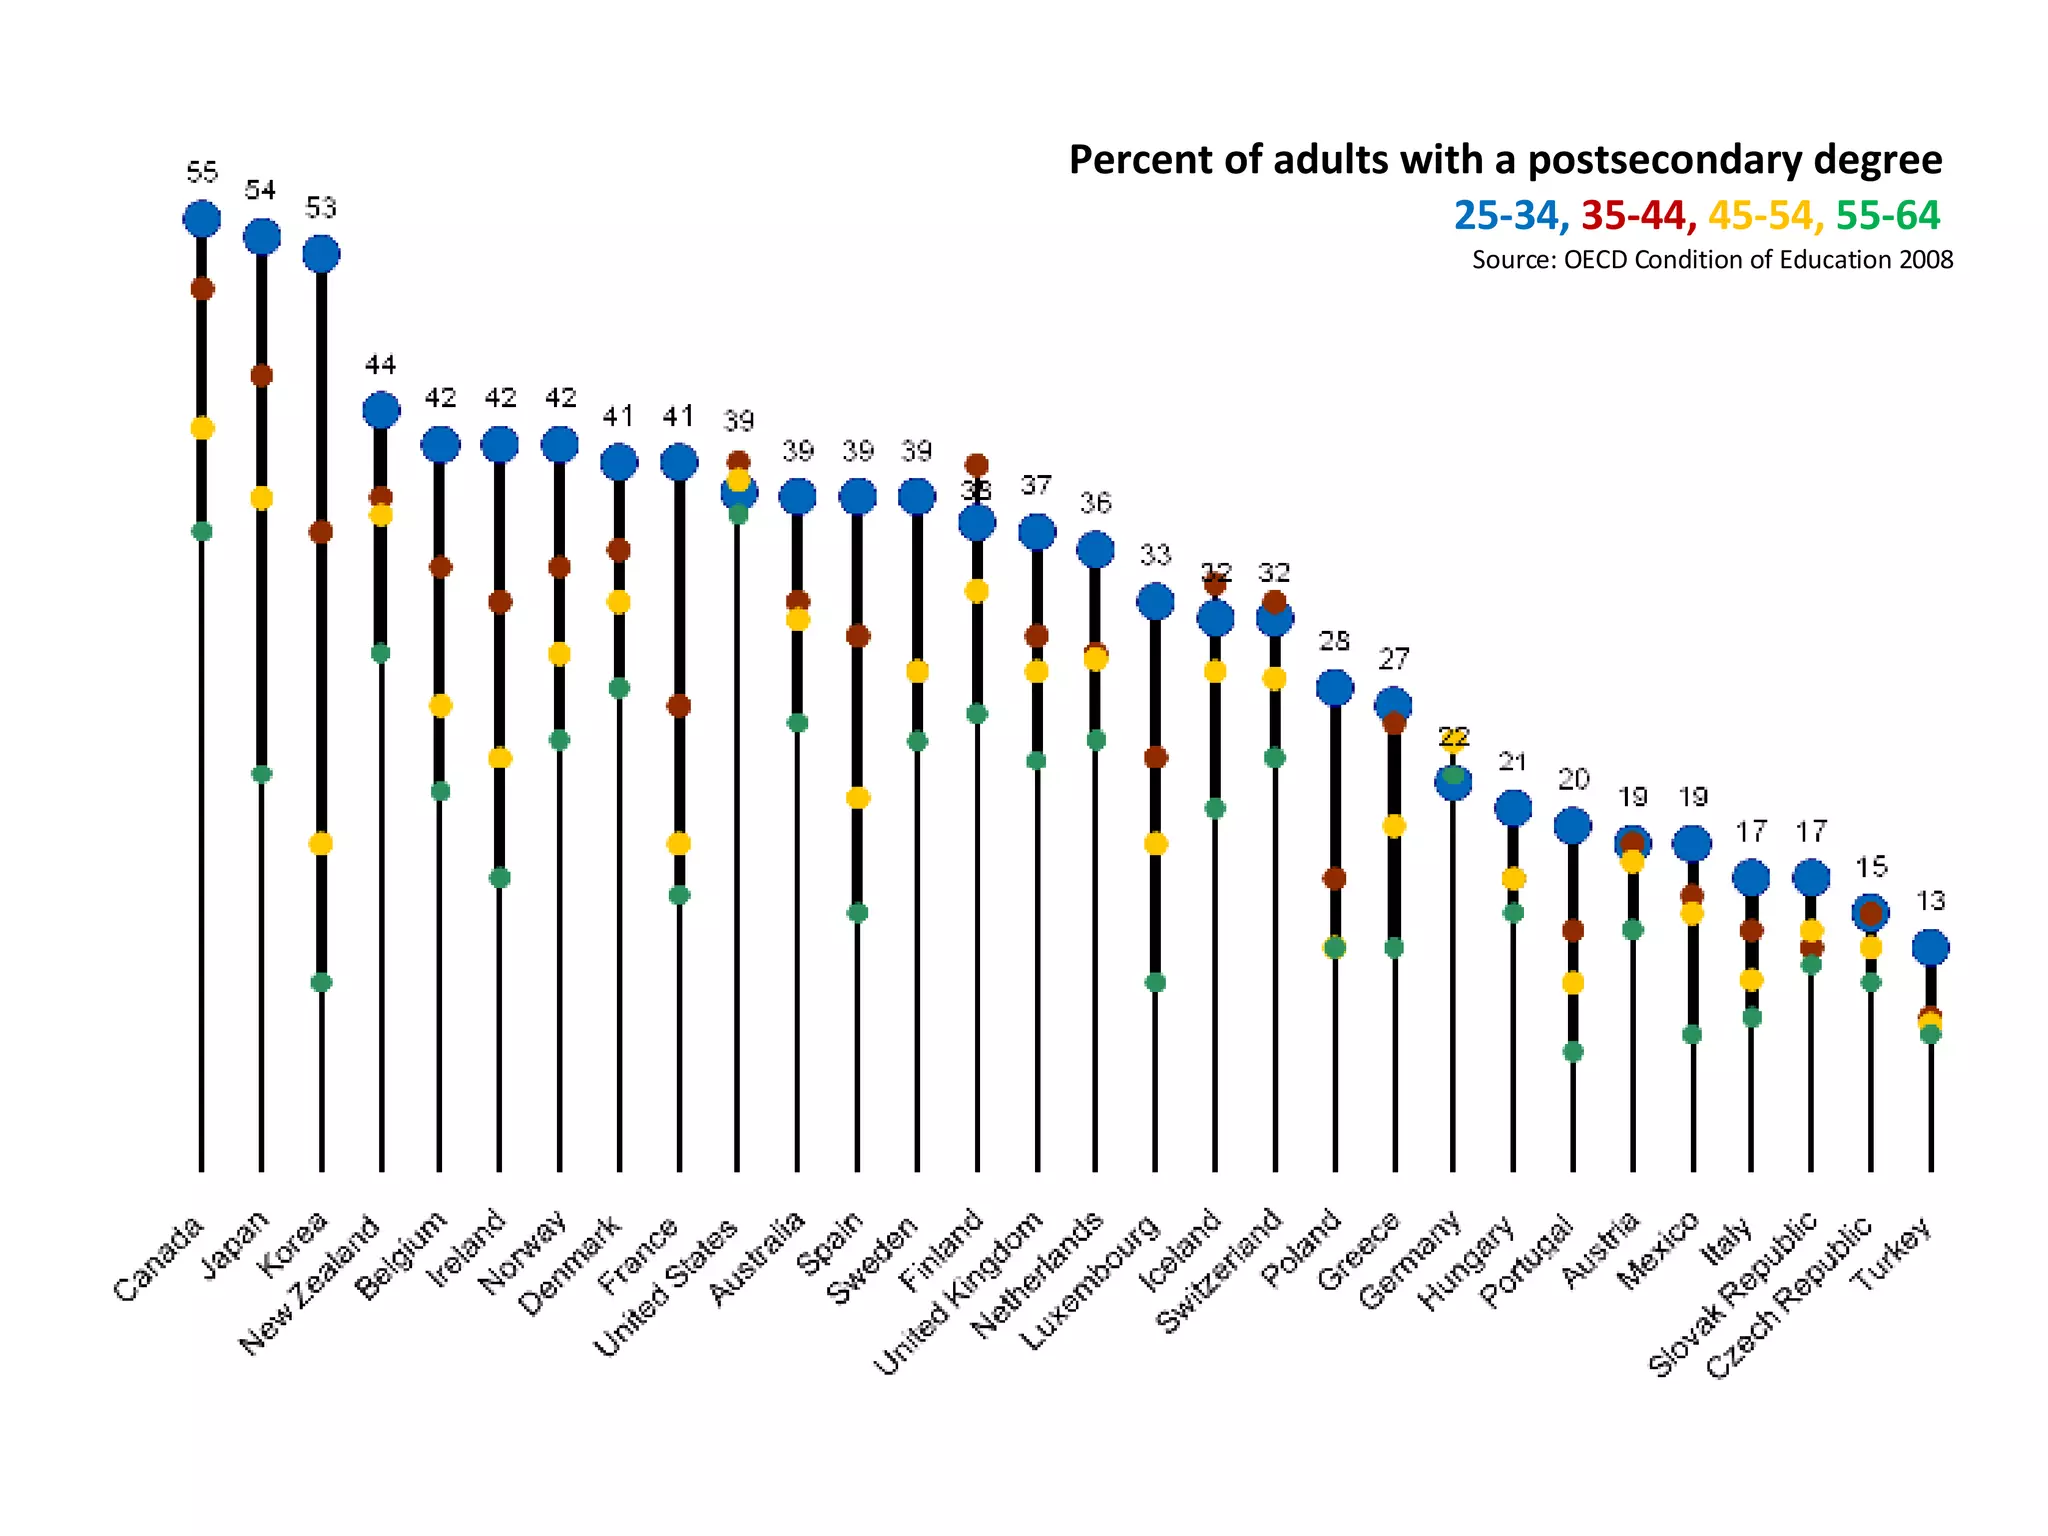
Increasing Higher Education Attainment: The Emerging Agenda for Policy, Practice, and Research Dewayne Matthews Vice President for Policy and Strategy Lumina Foundation for Education
Percent of adults with a postsecondary degree   55-64   Source: OECD Condition of Education 2008
Percent of adults with a postsecondary degree   45-54   Source: OECD Condition of Education 2008
Percent of adults with a postsecondary degree   35-44   Source: OECD Condition of Education 2008
Percent of adults with a postsecondary degree   25-34,   35-44,  45-54,   55-64   Source: OECD Condition of Education 2008
54 52 50 48 46 44 42 40 38 36 34 32 30 28 26 24 22 Canada Japan Korea Massachusetts Minnesota North Dakota Connecticut/Colorado/New York New Jersey/Vermont/New Hampshire Illinois/Maryland/Nebraska Virginia/Iowa Wisconsin/RI/SD/WA Pennsylvania/Kansas/Delaware Hawaii Utah/Montana Michigan/North Carolina/Georgia Ohio/MO/OR/WY/CA/FL/ME Indiana Idaho/South Carolina/Arizona Texas/Alabama/Tennessee/Alaska Oklahoma Kentucky/New Mexico Mississippi/Louisiana West Virginia/Arkansas Nevada Norway/Ireland/Belgium United States/ Australia/Spain/Sweden Denmark/France Finland Netherlands Iceland/Switzerland Greece Germany Mexico/Austria U.K. Luxembourg Poland Hungary/Portugal New Zealand
52 50 48 46 44 42 40 38 36 34 32 30 28 26 24 22 20 64 60 56 52 48 44 40 36 32 28 24 20 16 12 8 Hamilton Monroe Tippecanoe Marion/Hendricks/Warrick Boone Allen/St. Joseph/Hancock LaGrange/Crawford Scott Switzerland/Fayette Parke Pike/Owens/Jennings Starke/Noble/Clinton Indiana counties Canada Japan Korea Norway/Ireland/Belgium United States/ Australia/Spain/Sweden Denmark/France Finland Netherlands Iceland/Switzerland Greece Germany Mexico/Austria U.K. Luxembourg Poland Hungary/Portugal New Zealand Italy/Slovak Republic Czech Republic Turkey
United States Canada Sweden Finland Norway Korea Ireland Spain Denmark Belgium Percentage of new entrants to the labor market that have completed higher education Source: OECD Education at a Glance 2007
Composition of the U.S. population, 2000 to 2050 Source: United States Census Bureau White, non-Hispanic Hispanic Black Asian Other
Reaching 60% attainment by 2025 Graduates already in the workforce 31,000,000 New graduates from immigration 6,400,000 New graduates at current rates of production 41,000,000 New graduates needed 16,200,000 To reach a higher education attainment rate of 60% by 2025, the U.S. needs to increase the production of college graduates by 40%.
Expenditures per student, 2004 Instructional  and  non-instructional Source: OECD 2007

Higher Education Attainment Data

  • 1.
    Increasing Higher EducationAttainment: The Emerging Agenda for Policy, Practice, and Research Dewayne Matthews Vice President for Policy and Strategy Lumina Foundation for Education
  • 2.
    Percent of adultswith a postsecondary degree 55-64 Source: OECD Condition of Education 2008
  • 3.
    Percent of adultswith a postsecondary degree 45-54 Source: OECD Condition of Education 2008
  • 4.
    Percent of adultswith a postsecondary degree 35-44 Source: OECD Condition of Education 2008
  • 5.
    Percent of adultswith a postsecondary degree 25-34, 35-44, 45-54, 55-64 Source: OECD Condition of Education 2008
  • 6.
    54 52 5048 46 44 42 40 38 36 34 32 30 28 26 24 22 Canada Japan Korea Massachusetts Minnesota North Dakota Connecticut/Colorado/New York New Jersey/Vermont/New Hampshire Illinois/Maryland/Nebraska Virginia/Iowa Wisconsin/RI/SD/WA Pennsylvania/Kansas/Delaware Hawaii Utah/Montana Michigan/North Carolina/Georgia Ohio/MO/OR/WY/CA/FL/ME Indiana Idaho/South Carolina/Arizona Texas/Alabama/Tennessee/Alaska Oklahoma Kentucky/New Mexico Mississippi/Louisiana West Virginia/Arkansas Nevada Norway/Ireland/Belgium United States/ Australia/Spain/Sweden Denmark/France Finland Netherlands Iceland/Switzerland Greece Germany Mexico/Austria U.K. Luxembourg Poland Hungary/Portugal New Zealand
  • 7.
    52 50 4846 44 42 40 38 36 34 32 30 28 26 24 22 20 64 60 56 52 48 44 40 36 32 28 24 20 16 12 8 Hamilton Monroe Tippecanoe Marion/Hendricks/Warrick Boone Allen/St. Joseph/Hancock LaGrange/Crawford Scott Switzerland/Fayette Parke Pike/Owens/Jennings Starke/Noble/Clinton Indiana counties Canada Japan Korea Norway/Ireland/Belgium United States/ Australia/Spain/Sweden Denmark/France Finland Netherlands Iceland/Switzerland Greece Germany Mexico/Austria U.K. Luxembourg Poland Hungary/Portugal New Zealand Italy/Slovak Republic Czech Republic Turkey
  • 8.
    United States CanadaSweden Finland Norway Korea Ireland Spain Denmark Belgium Percentage of new entrants to the labor market that have completed higher education Source: OECD Education at a Glance 2007
  • 9.
    Composition of theU.S. population, 2000 to 2050 Source: United States Census Bureau White, non-Hispanic Hispanic Black Asian Other
  • 10.
    Reaching 60% attainmentby 2025 Graduates already in the workforce 31,000,000 New graduates from immigration 6,400,000 New graduates at current rates of production 41,000,000 New graduates needed 16,200,000 To reach a higher education attainment rate of 60% by 2025, the U.S. needs to increase the production of college graduates by 40%.
  • 11.
    Expenditures per student,2004 Instructional and non-instructional Source: OECD 2007