Good Stuff Happens in 1:1 Meetings: Why you need them and how to do them well
hhdhdhhhdhdhdhdhdhdhdhhdhdhdhdhdhdhhddhddh
1. CHAPTER 4
PRESENTATION, ANALYSIS AND INTERPRETATION OF DATA
This chapter presented and interpreted the results of the analysis of Banana
Peels as Alternative for the Production of Paper.
1. Below are the description of the experimental paper in terms of tensile
strength, folding endurance, effectiveness in writing, and its advantage as a material in
the production of paper.
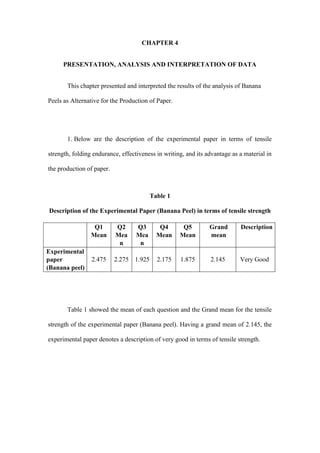
Table 1
Description of the Experimental Paper (Banana Peel) in terms of tensile strength
Table 1 showed the mean of each question and the Grand mean for the tensile
strength of the experimental paper (Banana peel). Having a grand mean of 2.145, the
experimental paper denotes a description of very good in terms of tensile strength.
Q1
Mean
Q2
Mea
n
Q3
Mea
n
Q4
Mean
Q5
Mean
Grand
mean
Description
Experimental
paper
(Banana peel)
2.475 2.275 1.925 2.175 1.875 2.145 Very Good
2. Table 2
Description of the Experimental Paper (Banana Peel) in terms of folding
endurance
Table 2 showed the mean of each question and the Grand mean for the folding
endurance of the experimental paper (Banana peel). Having a grand mean of 2.795,
the experimental paper denotes a description of good in terms of folding endurance
Table 3
Description of the Experimental Paper (Banana Peel) in terms of effectiveness in
writing
Table 3 showed the mean of each question and the Grand mean for the
effectiveness in writing of the experimental paper (Banana peel). Having a grand
mean of 2.855, the experimental paper denotes a description of very good in terms of
effectiveness in writing.
Q1
Mean
Q2
Mean
Q3
Mean
Q4
Mean
Q5
Mean
Grand
mean
Description
Experimental
paper (Banana
peel)
2 2.25 2.275 3.475 3.675 2.795 Good
Q1
Mean
Q2
Mean
Q3
Mean
Q4
Mean
Q5
Mean
Grand
mean
Description
Experimental
paper
(Banana peel)
2.875 2.625 3.075 2.7 3 2.855 Very Good
3. Table 4
Description of the Experimental Paper (Banana Peel) in terms of effectiveness in
writing
Table 4 showed the mean of each question and the Grand mean for the
effectiveness in writing of the experimental paper (Banana peel). Having a grand
mean of 2.855, the experimental paper denotes a description of very good in terms of
effectiveness in writing.
Table 5
Description of the Experimental Paper (Banana Peel) in terms of its advantage as
a material in the production of paper
Table 5 showed the mean of each question and the Grand mean for the
advantage of using banana peels of the experimental paper (Banana peel). Having a
grand mean of 3.31, the experimental paper denotes a description of outstanding in
terms of the advantage.
Q1
Mean
Q2
Mean
Q3
Mean
Q4
Mean
Q5
Mean
Grand
mean
Description
Experimental
paper
(Banana
peel)
2.875 2.625 3.075 2.7 3 2.855 Very Good
Q1
Mean
Q2
Mean
Q3
Mean
Q4
Mean
Q5
Mean
Grand
mean
Description
Experimental
paper
(Banana
peel)
3.35 3.35 3.375 3.225 3.25 3.31 Outstanding
4. 2. Below are the comparative description of the experimental and commercial
paper in terms of tensile strength, folding endurance, effectiveness in writing, and its
advantage as a material in the production of paper.
Table 6
Comparison of the Commercial Paper and the Experimental Paper (Banana peel)
in tensile strength
Q1
Mean
Q2
Mean
Q3
Mean
Q4
Mean
Q5
Mean
Grand
mean
Description
Experimental
paper
(Banana
peel)
2.475 2.275 1.925 2.175 1.875 2.145 Very Good
Commercial
Paper
3.225 3.225 3.3 3.275 3.2 3.425 Outstanding
Table 6 shows the means for the tensile strength of the commercial paper and
the experimental paper (Banana peel). The experimental paper has a grand mean of
2.145 and the commercial paper has a grand mean of 3.425. Having a higher mean of
3.425, the commercial paper is more acceptable in terms of tensile strength than the
experimental paper.
Table 7
Comparison of the Commercial Paper and the Experimental Paper (Banana peel)
in folding endurance
Q1
Mean
Q2
Mean
Q3
Mean
Q4
Mean
Q5
Mean
Grand
mean
Descriptio
n
Experimen
tal paper
(Banana
peel)
2 2.25 2.275 3.475 3.675 2.795 Good
Commercia
l Paper
1.475 1.475 1.55 1.55 1.55 1.52 Outstanding
5. Table 7 shows the means for the folding endurance of the commercial paper
and the experimental paper (Banana peel). The experimental paper has a grand mean
of 2.795 and the commercial paper has a grand mean of 1.52. Having a higher mean
of 2.795, the commercial paper is more acceptable in terms of folding endurance than
the experimental paper.
Table 8
Comparison of the Commercial Paper and the Experimental Paper (Banana peel)
in effectiveness in writing
Q1
Mean
Q2
Mean
Q3
Mean
Q4
Mean
Q5
Mean
Grand
mean
Descriptio
n
Experimen
tal paper
(Banana
peel)
2.875 2.625 3.075 2.7 3 2.855 Good
Commercia
l Paper
3.75 3.75 3.75 3.25 3.475 3.595 Outstanding
Table 8 shows the means for the folding endurance of the commercial paper
and the experimental paper (Banana peel). The experimental paper has a grand mean
of 2.855 and the commercial paper has a grand mean of 3.595. Having a higher mean
of 3.595, the commercial paper is more acceptable in terms of effectiveness in writing
than the experimental paper.
6. Table 9
t- Test Statistics for the Comparison between the Experimental and Commercial
Paper in terms of tensile strength
Compute
d T-test
value
Degree
of
freedom
T-critical
Value at alpha
= 0.05 level of
significance
Interpretation
Decision
Experimental
-5.48 78 1.9909
Without
significant
difference
Accept
Ho
Commercial
Table 9 shows 2-tailed t value. The computed value of t was -5.48 which is
lower than the critical value of 1.9909 at degree of freedom of 78 and 0.05 level of
significance. This means that the null hypothesis which stated that there is no
significant difference between the experimental and commercial paper in terms of
tensile strength is accepted.
Table 10
t- Test Statistics for the Comparison between the Experimental and Commercial
Paper in terms of folding endurance
Compute
d T-test
value
Degree
of
freedom
T-critical
Value at alpha
= 0.05 level of
significance
Interpretation
Decision
Experimental
5.34 78 1.9909
With significant
difference
Reject
Ho
Commercial
Table 10 shows 2-tailed t value. The computed value of t was 5.34 which is
higher than the critical value of 1.9909 at degree of freedom of 78 and 0.05 level of
significance. This means that the null hypothesis which stated that there is a
7. significant difference between the experimental and commercial paper in terms of
tensile strength is rejected.
Table 11
t- Test Statistics for the Comparison between the Experimental and Commercial
Paper in terms of effectiveness in writing
Compute
d T-test
value
Degree
of
freedom
T-critical
Value at alpha
= 0.05 level of
significance
Interpretation
Decision
Experimental
-4.68 78 1.9909
Without
significant
difference
Accept
Ho
Commercial
Table 11 shows 2-tailed t value. The computed value of t was -4.68 which is
lower than the critical value of 1.9909 at degree of freedom of 78 and 0.05 level of
significance. This means that the null hypothesis which stated that there is no
significant difference between the experimental and commercial paper in terms of
tensile strength is accepted.