The summary is:
1) NYC Health + Hospitals (H+H) relies heavily on public insurance payments like Medicaid which are projected to decline, threatening H+H's finances.
2) The city took two actions in the 2017 preliminary budget to assist H+H - forgiving $337M in payments from H+H and maintaining $204M in budgeted payments.
3) H+H still faces major budget challenges with projected deficits and low cash balances, and will require further cost reductions and revenue increases to stabilize its finances long-term.
Health Insurance Premium-Sharing by Employees and Retirees in the Public SectorLuis Taveras EMBA, MS
The cost of health insurance for New York City public employees and retirees has more than doubled in the last ten years, and its continued growth will be a major driver of projected budget gaps. While the total city budget is projected to grow 11 percent from fiscal years 2012 to 2016, health insurance costs will grow by almost 40 percent and comprise 70 percent of the projected budget gap in 2016.
The Southwest California Legislative Council assigned each of the 17 ballot propositions to one of our Directors / subject matter experts. Each prepared a report noting the title of the proposition, official verbiage, entities in support or opposition to the measure, where the funding came from and what a YES or NO vote means on the ballot. The Council discussed these details and adopted a position based on our Strategic Initiatives and the impact of the proposition on our business community.
SWCLC Directors researched each ballot measure that will appear on the November 2016 California ballot. Based on that research, the Council determined positions to adopt on each proposition based on the measure's impact on our business community in keeping with our Strategic Initiatives.
We encourage you to do your own research with data available at
https://ballotpedia.org/California_2016_ballot_propositions and
http://www.sos.ca.gov/elections/ballot-measures/qualified-ballot-measures/
Presentation by Heidi Golding and Elizabeth Bass, analysts in CBO's National Security Division, at the Annual Conference of the Western Economic Association International.
This article focuses on the
strategic steps taken by the
City of Baltimore to manage the
cost of benefit programs, to
bring the level of benefit offered
more in-line with the other comparable
public entities, and to
take advantage of the opportunities
brought by the evolving
healthcare law in order to satisfy
the City's short- and longterm
goals while maintaining
financial health.
HISIM2 is an updated version of the model CBO uses to generate estimates of health insurance coverage and premiums for people under age 65. The model is used along with other models to develop CBO’s baseline budget projections (which incorporate the assumption that current law generally remains the same). It is also used to estimate the effects of proposed changes in policies that affect health insurance coverage.
CBO’s work follows processes specified in the Congressional Budget and Impoundment Control Act of 1974 (which established the agency) or developed by the agency in concert with the House and Senate Budget Committees and the Congressional leadership.
CBO is strictly nonpartisan; conducts objective, impartial analysis; and hires its employees solely on the basis of professional competence, without regard to political affiliation. The agency does not make policy recommendations, and each report and cost estimate summarizes the methodology underlying the analysis.
Presentation by Keith Hall, CBO Director, at the 10th Annual Meeting of the OECD Network of Parliamentary Budget Officials and Independent Fiscal Institutions.
Spending on federal health care programs is growing rapidly, driven by rising enrollment and rising health care spending per enrollee. This presentation describes CBO’s analyses related to health care, explains how the agency uses its health insurance simulation model, and provides examples of how CBO documents its work.
Presentation by Robert Sunshine, Senior Advisor in CBO’s Office of the Director, at the 10th Annual Meeting of the OECD Network of Parliamentary Budget Officials and Independent Fiscal Institutions.
This presentation provides an overview of how CBO estimates the costs of federal student loans under the Federal Credit Reform Act of 1990.
Presentation by Justin Humphrey, an analyst in CBO’s Budget Analysis Division, at the Postsecondary National Policy Institute.
Paquete de 24 enmiendas de mejora de Unión Progreso y Democracia al Proyecto de Presupuesto General para el Ayuntamiento de Alcobendas en el ejercicio 2016
This is a training on the financial crisis facing Medicare in the next generation. Are Democratic of Republican proposals for Medicare reform able to address the crisis, or can only single payer save the Medicare entitlement for seniors?
Local Mental Health Authority
Medicaid Match Social Services Appropriations
Sub-Committee Legislative Report
September 2015
Prepared by: Utah Association of Counties
We are facing some very difficult budget choices and challenges for Massachusetts for Fiscal Year 2011 (July 2010 - July 2011). Governor Patrick and his administration are holding a series of hearings and forums around the state to get input and ideas from citizens where this presentation is included. To learn more about the hearings and forums, visit www.mass.gov/governor/forums
If you weren't able to make a hearing or forum or want to be prepared before you attend one, this presentation is about 9 minutes long and will give you a basic overview of the budget situation. Please review it, then visit our blog at www.mass.gov/blog/engage to comment and share your ideas.
Assessment 4 Study GuideCiting Shafritz, J. M., Russell, .docxdavezstarr61655
Assessment 4 Study Guide
Citing:
Shafritz, J. M., Russell, E. W., & Borick, C. P. (2013). Introducing public administration
(8th ed.). Upper Saddle River, NJ: Pearson.
Reading Assignment Chapter 13: Public Financial Management
Unit Lesson
Budgeting is an important area within public institutions. This allows the jurisdiction to reference these important documents when there are questions regarding expenditures, line item purchases, and overall capital budgets. Capital budgets normally are written and established in the year prior to the implementation, for example, budgets for 2013 would be asked for during 2012. These budgets can be used for formulating how much of a surplus will be made available for contractors that may be working for the institution, security measures such as cameras that may be needed for security at a public venue, and being able to budget for supplies that are required for everyday functioning capacity within the organization. Budget formatting can be intriguing for most public entities and the professionals working within those organizations.
The size of technological spreadsheets that cite policies and create a timeline for the expenditures being used have a section specially designated for program objectives, and have a section that normally is set aside to delineate the government’s total service effort. The flow of management funds is the backbone of any institution, government entity, or public service venue. Without the flow of monetary compensation and grant money distribution, there will be limited capabilities for the designated organization to perform the work necessary to manage the business. As with many changes over the past several decades, monetary systems and funds being made available are beginning to diminish from the Federal government. The monies that are received, for example, by a fire department can be used to purchase apparatus, new firefighting clothing and protective equipment, and other provisions to support the public organization.
While looking at the budget from the federal, state, local, or community governments, consideration must be given to whether the monies being used and given to local entities are going to be used for economic growth. There will be disagreements concerning the appropriation of funds and fund management for the communities, but also for the main distributor-the federal government. The budget is the key focal point for public administration to function and make decisions. Monies that are received by public entities create a huge sense of power for those who shape the methods of how the monies are going to be spent. The upper management or executives must learn the conceptual framework that is used for budgeting, financing, and the allocation of those funds that have been received. Thus an accountant will be necessary for any good executive team within the organization. There are several different types of budgets that can be issued for an organization:.
SB 476 Department of Legislative Services Maryland G.docxaryan532920
SB 476
Department of Legislative Services
Maryland General Assembly
2017 Session
FISCAL AND POLICY NOTE
Third Reader - Revised
Senate Bill 476 (Senator Guzzone, et al.)
Finance and Budget and Taxation Health and Government Operations
Behavioral Health Community Providers - Keep the Door Open Act
This bill requires the Governor’s proposed budget for fiscal 2019 and 2020 to include a
3.5% rate increase for community providers over the funding provided in the prior year’s
legislative appropriation for specified services; for fiscal 2021 and each year thereafter,
until a required payment system is implemented, a 3.0% rate increase must be included in
the Governor’s proposed budget. The Department of Health and Mental Hygiene (DHMH)
must conduct a rate-setting study, submit an associated report, and implement a payment
system based on the results of the study. DHMH must notify the Department of Legislative
Services (DLS) within five days after the payment system is implemented. The bill also
institutes an annual reporting requirement for DHMH beginning December 1, 2019.
The bill takes effect June 1, 2017. However, the bill terminates on June 30, 2023, if DLS
does not receive the required notice regarding payment system implementation by that date.
Fiscal Summary
State Effect: No effect in FY 2017 or 2018. DHMH general fund expenditures increase
by $18.2 million in FY 2019 to provide a 3.5% rate increase for behavioral health
community providers and ensure completion of the required report and study. Federal fund
revenues and expenditures increase by $18.6 million in FY 2019 due to the Medicaid
match. Future year expenditures reflect a 3.5% rate increase in FY 2020 and a 3.0% rate
increase annually thereafter, the compounding effect of the rate increase, a lower federal
matching rate, and $100,000 in annual contractual data analysis services. This bill
establishes a mandated appropriation beginning in FY 2019.
($ in millions) FY 2018 FY 2019 FY 2020 FY 2021 FY 2022
FF Revenue $0 $18.6 $36.9 $52.8 $69.7
GF Expenditure $0 $18.2 $37.8 $55.4 $73.2
FF Expenditure $0 $18.6 $36.9 $52.8 $69.7
Net Effect $0.0 ($18.2) ($37.8) ($55.4) ($73.2)
Note:() = decrease; GF = general funds; FF = federal funds; SF = special funds; - = indeterminate increase; (-) = indeterminate decrease
SB 476/ Page 2
Local Effect: None.
Small Business Effect: Meaningful for small business community providers that receive
annual rate increases under the bill. Providers must also submit required information to
DHMH, which may be burdensome for smaller providers with limited resources.
Analysis
Bill Summary: “Community provider” means a community-based agency or program
funded by the Behavioral Health Administration or the Medical Care Programs
Administration to serve individuals with mental disorders, substance-related disorders, or
a combination of these di ...
The 2021 Healthcare Financial Forecast: What to Expect, How to PrepareHealth Catalyst
As healthcare financial leaders plan for 2021, they can expect COVID-19 to shape their strategies. Pandemic response and recovery will continue to dominate the industry, inform new perspectives on existing issues (e.g., the shift to value-based care and health equity), and shape priorities. Meanwhile, the Biden administration will start to puts its stamp on U.S. healthcare, further making 2021 a pivotal year for the industry.
Healthcare finance teams can best navigate 2021 by monitoring and preparing to take action in five prominent areas:
Election impact.
Price transparency.
Financial forecasting.
Value-based care.
Health equity.
C:\Documents And Settings\Hannah Powell\Desktop\New Government Policy
HHC March Report EK
1. FiscalBriefNew York City Independent Budget Office
March 2016
Stopgap Measures Aid NYC Health + Hospitals
The city’s public hospital system—newly rebranded as
NYC Health + Hospitals—has long relied on public health
insurance payments (Medicaid and Medicare) and other
government funding streams, with relatively little revenue
from private insurance. H+H revenue from public sources
is projected to decline because of changes in the health
care system, government policy shifts, and reductions in
patient visits.
In response to these shifts, H+H and the de Blasio
Administration have promised a new plan, scheduled to
accompany the release of the executive budget, to improve
H+H’s finances, which presumably will include initiatives
to increase revenue, decrease expenses, or both. In the
meantime, the 2017 preliminary budget included two
immediate actions to assist H+H’s finances: forgiveness
of $337 million in payments H+H had been scheduled
to make the city for 2016 and maintaining its budgeted
payments to H+H, even though the potential to use some
of these payments to trigger federal matching funds for
supplemental Medicaid payments ($204 million anually)
is anticipated to decline. Although the city could have
withdrawn its share of these payments, it will now instead
use these funds to increase the general subsidy to H+H.
History of City Subsidy to H+H. NYC Health + Hospitals
operates 11 hospitals, over 30 clinics, and 5 long-term care
facilities that provide care for a disproportionate share of
patients who are publicly insured or without insurance. In
2014, 24 percent of New York City adults were enrolled in
Medicaid and 14 percent were uninsured, but Medicaid
beneficiaries made up 45 percent of outpatient visits at
H+H facilities with the uninsured accounting for another 28
percent. H+H revenues often fall short of its expenses in
part because Medicaid reimbursement rates are the lowest
of any health insurance and uninsured patients often
provide little—if any—payment for their care. Supplemental
Medicaid payments (detailed below) aim to address these
gaps for providers like H+H that treat many Medicaid
and uninsured patients, but the compensation may be
insufficient to cover the full cost of providing care.
H+H’s on-going state of financial distress has prompted
a number of city actions over the years, some of them
stopgap, to avoid further damage to the system. As a result,
H+H has become increasingly dependent on the city’s
fiscal support. The city gives H+H an annual unrestricted
subsidy that has varied from almost nothing to over $250
million, depending on the city’s fiscal condition and the
other aid streams it provides. The city also subsidizes
health insurance for H+H employees and legal services and
settlement payments for H+H medical malpractice suits.
Prior to 2003, H+H did not reimburse the city for its
medical malpractice costs, but it did pay debt service on
its city-issued bonds ($154 million in 2002). In 2003, the
city and H+H decided to swap these payments, expecting
that if H+H was responsible for its malpractice claims, the
corporation would have greater incentive to reduce them.
This strategy was effective; H+H medical malpractice
claims dropped from $172 million in 2003 to $127 million
in 2014. Since 2007, the city has given H+H back a small
amount of this payment ($17.3 million a year since 2011)
for keeping the number of suits low. Most recently the city
has taken on some of the increased personnel costs from
H+H’s collective bargaining agreements. The city also pays
H+H for providing specific free and low-cost services to
city schools, clinics, and jails, as well as health services for
some city agencies, which are not included in the subsidy.1
In 2006, the city substantially increased its supplemental
Medicaid payments to H+H and the hospital system
began once again to reimburse the city for its debt service
expenses and its employees’ health insurance premiums,
while continuing to pay for its medical malpractice claims
Focus On:
The Preliminary Budget
IBO
New York City
Independent Budget Office
Ronnie Lowenstein, Director
110 William St., 14th floor
New York, NY 10038
Tel. (212) 442-0632
Fax (212) 442-0350
iboenews@ibo.nyc.ny.us
www.ibo.nyc.ny.us
2. NEW YORK CITY INDEPENDENT BUDGET OFFICE2
(note that H+H often delays making these payments to the
city and the city forgave the payments entirely in 2010). The
city moved to subsidize H+H mainly through supplemental
Medicaid because the federal government matches these
payments, doubling the fiscal boost for H+H. The federal
Medicaid program allows states to make supplemental
Medicaid payments to health care facilities that provide
care to substantial numbers of Medicaid and uninsured
patients to make up for the low payments from these
patients. They consist largely of Upper Payment Limit (UPL)
and Disproportionate Share Hospital (DSH) payments.
Both DSH and UPL payments leverage federal funds for
safety net hospitals with city funds, but through different
processes involving the city, state, and federal government.
The federal government funds half of DSH and UPL
payments and the local government (the city in the case
of H+H) provides almost the entire other half, with a small
state contribution for DSH payments.
Disproportionate Share Hospital payments are block
subsidies for hospitals that see high rates of uninsured
and Medicaid patients; the state determines the value
of these subsidies for each hospital based on a complex
methodology. UPL payments are increases in the Medicaid
reimbursement rates for providers who see a lot of
Medicaid patients. The city or state can decide to provide
UPL payments to almost any provider (as long as they pay
for half of this increase) and then must negotiate with the
federal government to determine the higher rates.
In the case of H+H, New York State determines the value
of its DSH payments and the city determines its UPL
payments through the rates it is willing to pay and able to
negotiate with the federal government. The city’s annual
combined DSH and UPL payments to H+H increased from
an average of $75 million in 2003 through 2006, to $370
million in 2007 through 2010, and $594 million in 2011
through 2014, all matched by federal payments.2
Total DSH
and UPL payments increased from 3 percent of H+H’s total
Medicaid revenue in 2003 to 33 percent in 2015.
Actions in the 2017 Preliminary Budget. While this
strategy of boosting federal payments by increasing the
city’s contribution has been benefiting H+H for the last
decade, both major sources of supplemental Medicaid are
poised to decline. Federal policy requires UPL payments
to be determined only by fee for service Medicaid
receipts, which are declining for H+H because the New
York State Medicaid program has been shifting from a
fee for service system to a predominately managed care
system over the last two decades. This shift is designed
to increase coordination of and access to care, along
with predictability of costs for the state, but it also limits
the opportunity to claim UPL payments.3
The Mayor’s
preliminary budget estimates that beginning in 2016,
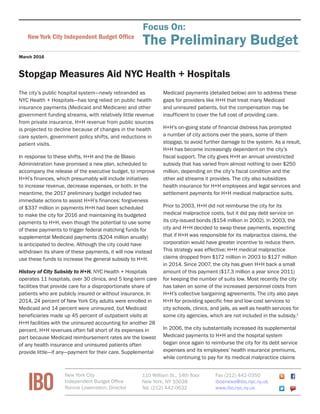
Net City Subsidy to Health + Hospitals, 2009-2016
Dollars in millions
2009 2010 2011 2012 2013 2014 2015 2016†
NYC Payments to H+H $580 $986 $886 $1,057 $1,293 $1,149 $1,458 1,426
Unrestricted City Subsidy 130.6 2.6 60.0 83.4 81.6 130.8 100.9 267.2
Employee Health Insurance 13.1 24.9 17.7 18.3 19.3 20.9 21.1 24.9
Debt Service 126.7 181.2 167.4 210.3 219.0 217.0 212.5 225.9
Supplemental Medicaid (DSH + UPL)* 136.7 587.1 480.6 608.6 651.0 636.5 898.0 612.5‡
Medical Malpractice Claims 137.5 189.9 142.6 118.7 121.6 126.9 123.4 140.0
Medical Malpractice Repayment 35.7 0 17.3 17.3 17.3 17.3 17.3 17.3
Collective Bargaining $0.0 0 0.0 0.0 183.0 0.0 85.0 138.0
H+H Payments to NYC** ($222) $0 ($279) ($292) ($304) ($309) ($301***) 0
Debt Service (71.1) 0 (118.5) (154.7) (162.9) (161.6) (156.4) 0
Medical Malpractice Claims (137.5) 0 (142.6) (118.7) (121.6) (126.9) (123.4) 0
Employee Health Insurance (13.1) 0 (17.7) (18.3) (19.3) (20.9) (21.1) 0
Net H+H Subsidy $359 $986 $607 $765 $989 $840 $1,157 $1,426
SOURCES: NYC Health + Hospitals, Mayor’s Office of Management and Budget
NOTES: *City share of supplemental Medicaid is an approximation; calculation assumes the state contributes $50 million annually to the nonfederal share
of Disproportionate Share Hospital payments and that the city funds the remainder; the nonfederal share is 50 percent of total receipts, except for the
Upper Payment Limit receipts in 2009-11, when the federal share was increased to 61.6 percent (American Recovery Act). **H+H’s payments to New York
City reimburse the city for some of its subsidy to H+H so they are shown as negatives as they decrease the net subsidy. ***H+H has not yet made these
payments; the city often allows H+H to delay payments to the city to accommodate delayed payments to H+H from federal or state sources. †
2016 reflects
budgeted values. ‡
This value reflects H+H’s receipts through February 2016 and may increase.
New York City Independent Budget Office
3. 3NEW YORK CITY INDEPENDENT BUDGET OFFICE
annual federal supplemental Medicaid payments will be
$204 million lower than previously budgeted. The de Blasio
Administration chose to apply the $204 million it would
have used to trigger federal matching payments in 2016
and future years towards the city’s unrestricted subsidy
instead. This shift is budget neutral for the city.
By repurposing the $204 million from supplemental
Medicaid payments to an increase in the city’s direct
subsidy payment, the fiscal impact on H+H from the
federal changes is held to $204 million, rather than
what could have potentially been a $408 million cut. In
addition, the Affordable Care Act is set to decrease federal
DSH payments in line with the projected decrease in the
uninsured population beginning in 2018. These reductions
are not included in the budget because the magnitude of
these cuts for H+H is unknown.
The preliminary budget also forgives H+H’s 2016 payments
to the city for medical malpractice claim expenses, debt
service on city bonds, and employee health insurance,
totaling $337 million in forgone city revenue. This
forgiveness aims to mitigate H+H’s immediate financial
stress while the city and H+H develop a longer-term plan to
put the health system on a more stable fiscal path.
Major Budgetary Challenges Remain. Prior year cash
balances (unlike the city, H+H uses cash-based accounting)
are expected to leave H+H with $104.1 million cash
on hand to end 2016—less than needed for a week of
operation. Cash balances in 2017 and 2019 are projected
to be even smaller.
The most recent H+H budget projects declining revenue
and increasing expenses, driven by the declines in
Medicaid payments, declines in overall patient visits, and
persistently high operating expenses.4
The budget assumes
that these losses will be partially offset by corrective
actions including a $519 million net benefit over four years
from the state’s Delivery System Reform Incentive Payment
program, $309 million annually in H+H internal cost
containment initiatives and, starting in 2017, $700 million
annually in unspecified revenue from state and federal
actions. Even with these measures, the budget projects
that H+H revenue will fall short of its expenses by $669
million in 2016 and by $395 million, $204 million, and
$499 million, respectively, in 2017 through 2019.
Over the last year H+H’s strategies to steady the
corporation’s finances have included efforts to increase
patient volume by improving patient satisfaction and
decreasing wait times and to increase the number of
enrollees in the system’s own insurance plan, Metro Plus.
H+H’s internal cost-containment strategies include efforts to
reduce supply costs with better procurement arrangements,
expand primary care services, and reduce workforce
expenses.5
H+H believes it can achieve workforce spending
reductions of $100 million annually with less overtime
expenses, not filling all positions that become vacant, and
other efforts. H+H reports modest progress in those efforts
but so far this year, total disbursements have yet to decline.
Reducing workforce expenses on a larger scale could require
reducing the services H+H provides or eliminating facilities,
strategies that are politically fraught and that H+H has
typically avoided.
Report prepared by Erin Kelly
Endnotes
1
Prior to 2003, H+H provided all health care services to people involved with
the criminal justice system, but in 2003 the city opted to contract out most
of these services. (H+H still provided hospital-based care and some mental
health care). In June 2015, the city announced that H+H would be taking over
all correctional health services, increasing payments to H+H by roughly $150
million annually.
2
Four year averages are used because payments are often delayed and
received in bulk in later years, making some single year payments misleading.
There is also a small state contribution to DSH payments.
3
Since payments are routinely delayed (for example, some payments received
in 2015 are for services performed in 2011), the impact of the shift to
managed care will be seen in future years.
4
Published in August 2015 as a supplement to the city’s 2016 adopted budget.
5
The city has an initiative (Caring Neighborhoods) to increase the number of
primary care centers in New York City and H+H is projecting revenue gains
from taking part in this project.
NYC Health + Hospitals Financial Plan
Dollars in millions
Adopted Budget:
Projected 2016 2017 2018 2019
Operating Revenues $8,743 $8,646 $8,807 $8,511
Operating Expenses 9,728 10,086 10,220 10,344
Interest (122) (122) (123) (123)
Total Before
Corrective Actions ($1,106) ($1,562) ($1,536) ($1,956)
Corrective Actions $437 $1,167 $1,332 $1,458
Total After
Corrective Actions ($669) ($395) ($204) ($499)
Accrual to Cash
Adjustment $221 $311 $401 $314
Prior Year Cash
Balance 552 104 20 217
Closing Cash
Balance $104 $20 $217 $32
SOURCE: NYC Health + Hospitals
New York City Independent Budget Office