Download as PDF, PPTX
![Master on Software Engineering :: Human-Computer Interaction
Dr. Sabin-Corneliu Buraga – www.purl.org/net/busaco
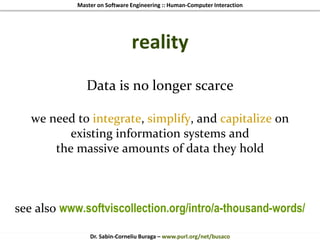
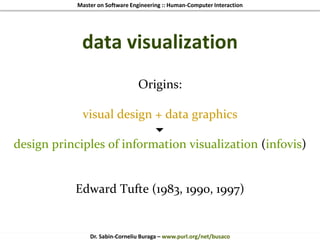
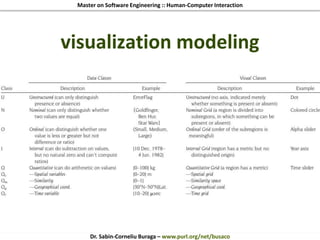
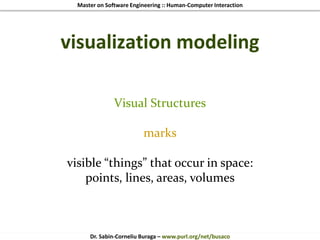
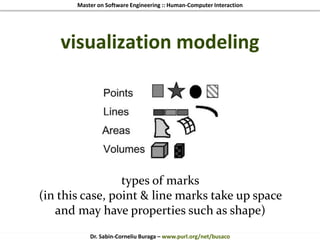
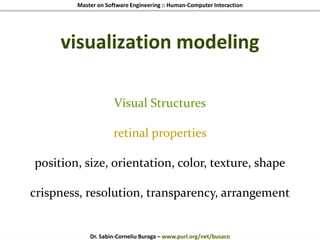
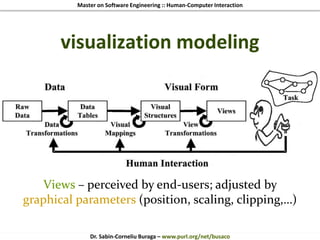
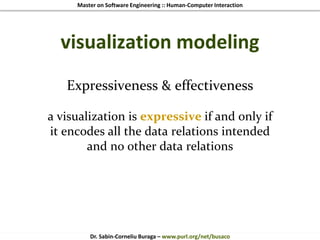
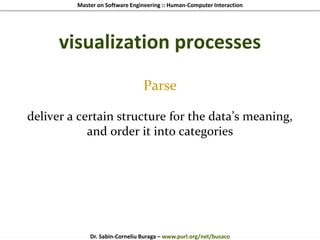
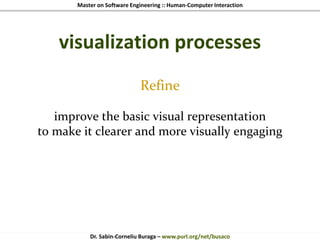
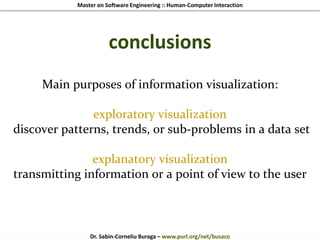
visualization modeling
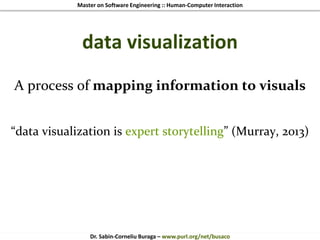
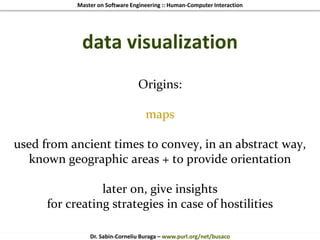
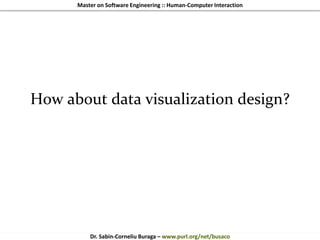
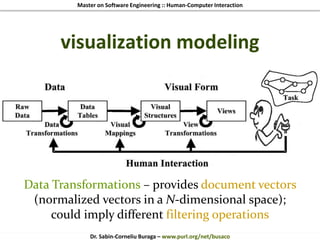
Data Tables
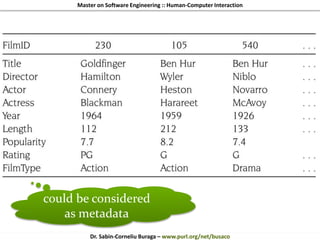
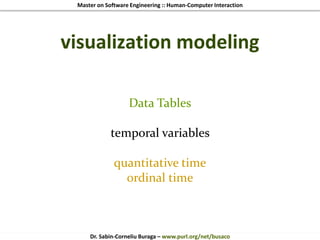
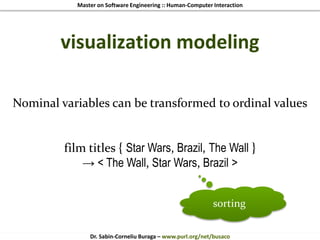
variables implies a scale of measurement
a quantitative variable Q is a numeric range
example: film length [0, 400]
arithmetic operators could be performed on them](https://image.slidesharecdn.com/fcamyqlcqbsxdyrwtb4s-140527090053-phpapp02/85/HCI-2014-8-of-10-Data-Visualization-47-320.jpg)
![Master on Software Engineering :: Human-Computer Interaction
Dr. Sabin-Corneliu Buraga – www.purl.org/net/busaco
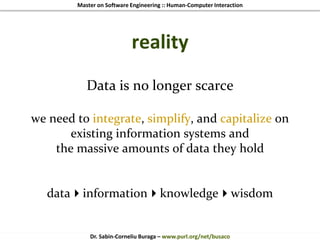
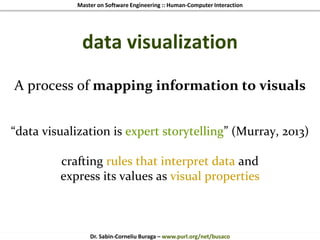
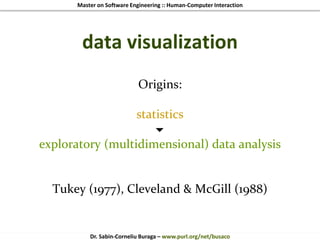
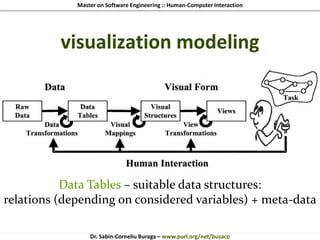
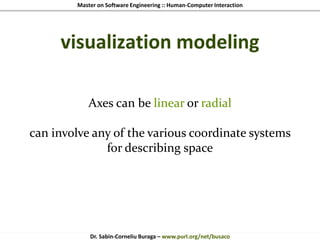
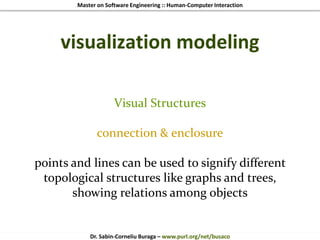
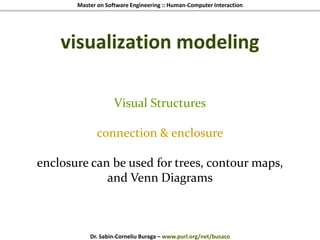
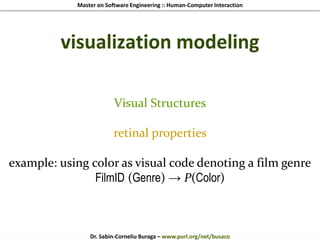
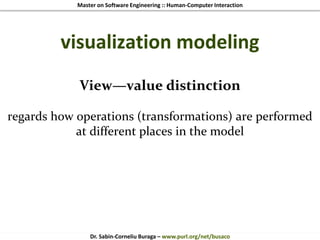
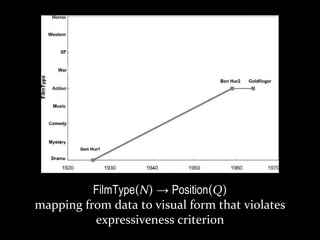
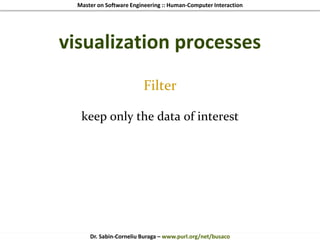
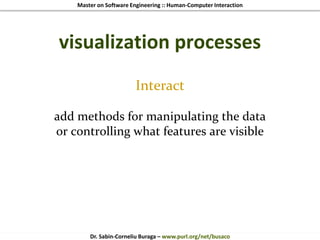
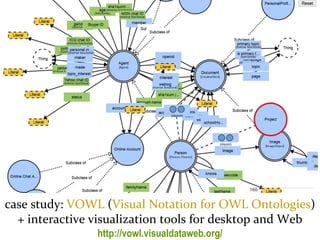
visualization modeling
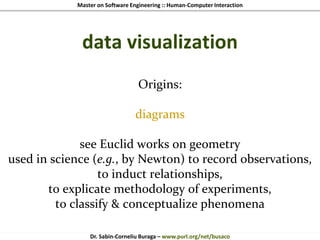
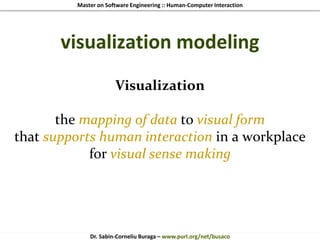
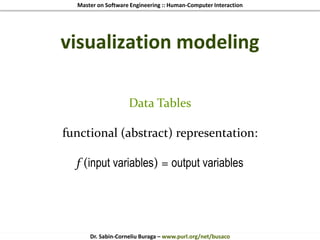
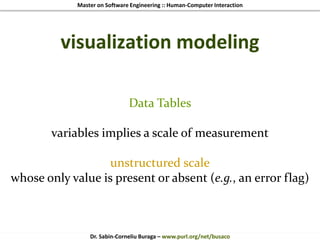
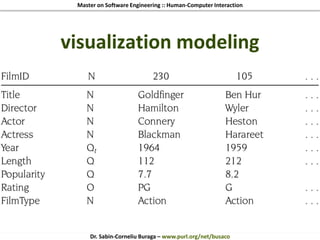
Quantitative variables can be mapped
by data transformations into ordinal variables
film length [0, 400] min. → <SHORT, MEDIUM, LONG>
classes of
values](https://image.slidesharecdn.com/fcamyqlcqbsxdyrwtb4s-140527090053-phpapp02/85/HCI-2014-8-of-10-Data-Visualization-54-320.jpg)
![Master on Software Engineering :: Human-Computer Interaction
Dr. Sabin-Corneliu Buraga – www.purl.org/net/busaco
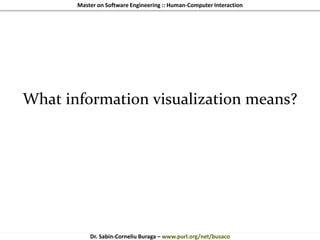
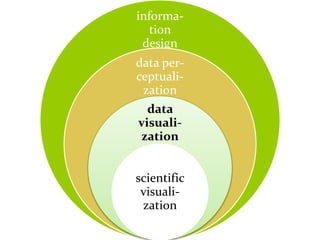
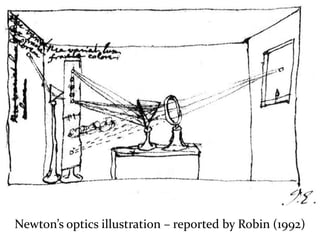
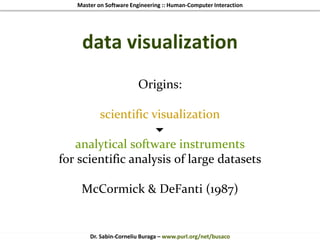
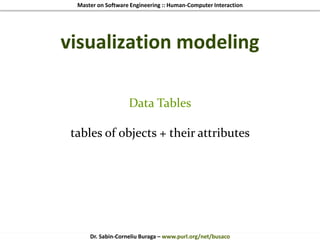
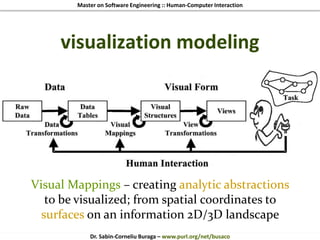
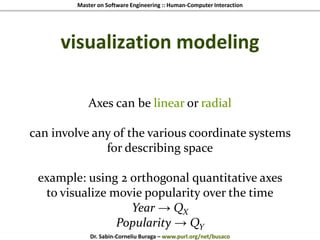
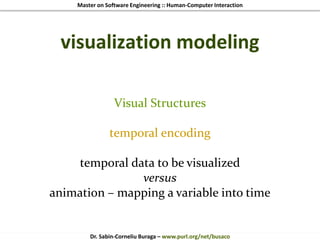
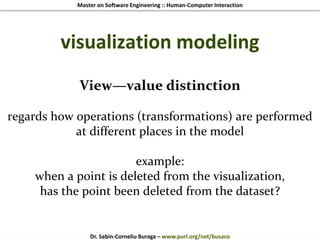
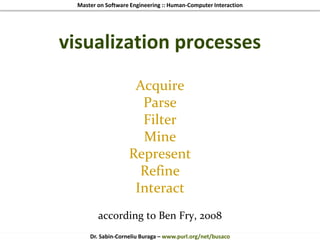
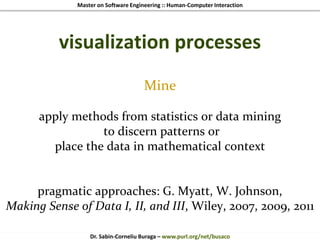
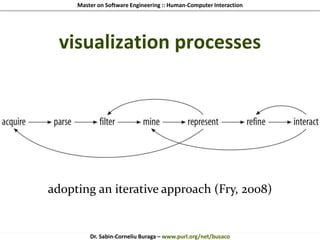
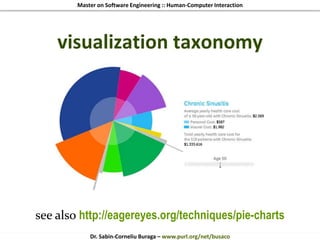
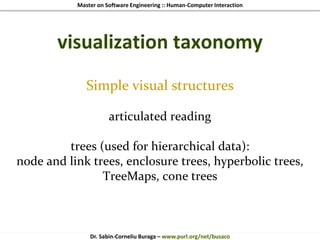
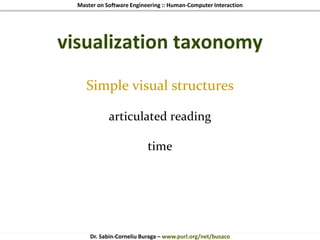
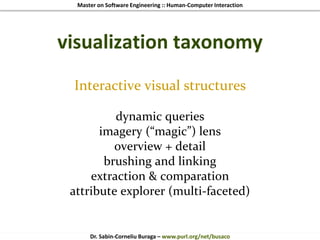
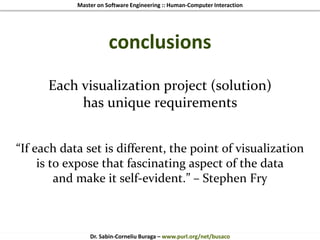
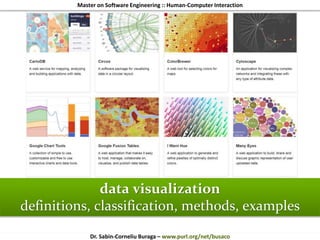
visualization taxonomy
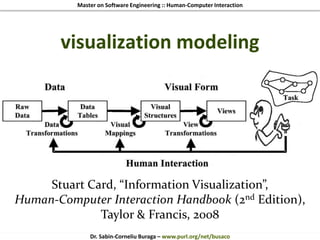
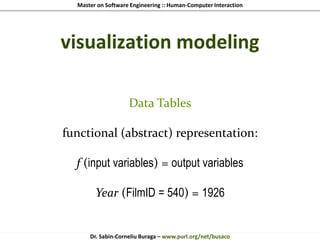
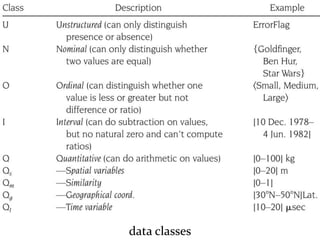
Simple visual structures
direct reading
1-variable [X]:
lists, 1D scatterplots, pie charts, distributions, box plots,…](https://image.slidesharecdn.com/fcamyqlcqbsxdyrwtb4s-140527090053-phpapp02/85/HCI-2014-8-of-10-Data-Visualization-91-320.jpg)
![Master on Software Engineering :: Human-Computer Interaction
Dr. Sabin-Corneliu Buraga – www.purl.org/net/busaco
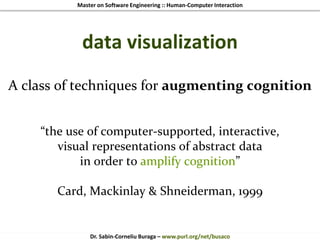
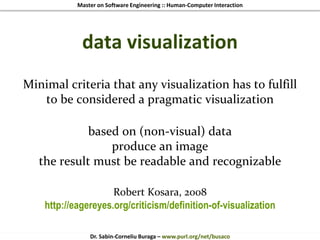
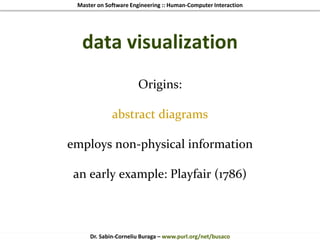
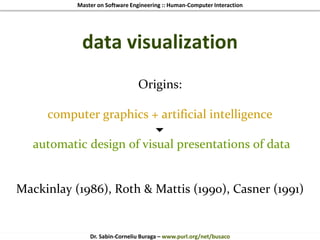
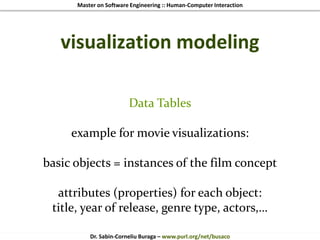
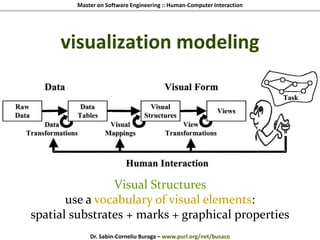
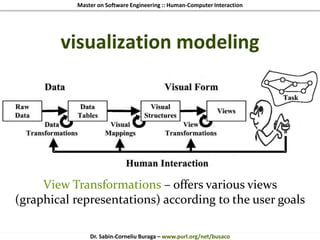
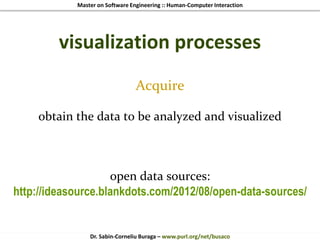
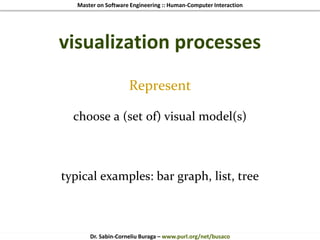
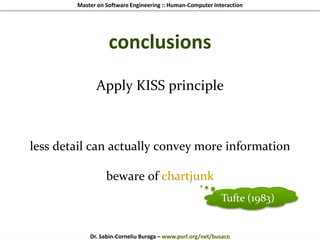
visualization taxonomy
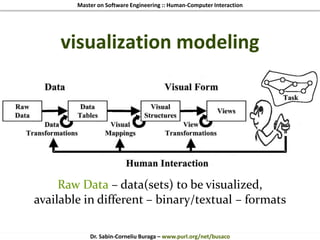
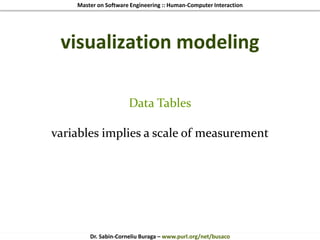
Simple visual structures
direct reading
2-variable [XY]:
2D object charts (histograms), 2D scatterplots](https://image.slidesharecdn.com/fcamyqlcqbsxdyrwtb4s-140527090053-phpapp02/85/HCI-2014-8-of-10-Data-Visualization-93-320.jpg)
![Master on Software Engineering :: Human-Computer Interaction
Dr. Sabin-Corneliu Buraga – www.purl.org/net/busaco
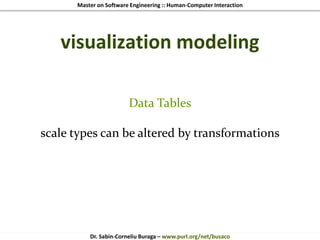
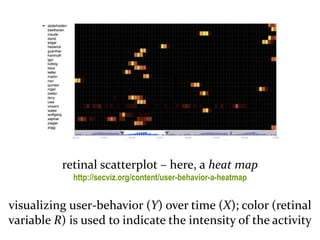
visualization taxonomy
Simple visual structures
direct reading
3-variable
[XYR]: retinal scatterplots, Kohonen diagrams
[(XY)Z]: information landscapes, information surfaces
[XYZ]: 3D scatterplots](https://image.slidesharecdn.com/fcamyqlcqbsxdyrwtb4s-140527090053-phpapp02/85/HCI-2014-8-of-10-Data-Visualization-94-320.jpg)
![Master on Software Engineering :: Human-Computer Interaction
Dr. Sabin-Corneliu Buraga – www.purl.org/net/busaco
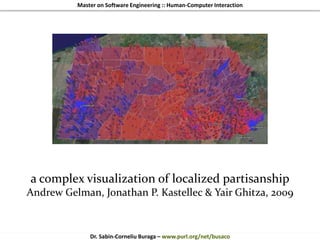
visualization taxonomy
Simple visual structures
direct reading
4-variable [XYZR]:
3D retinal scatterplots, 3D topographies](https://image.slidesharecdn.com/fcamyqlcqbsxdyrwtb4s-140527090053-phpapp02/85/HCI-2014-8-of-10-Data-Visualization-96-320.jpg)
![Master on Software Engineering :: Human-Computer Interaction
Dr. Sabin-Corneliu Buraga – www.purl.org/net/busaco
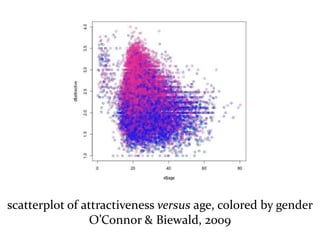
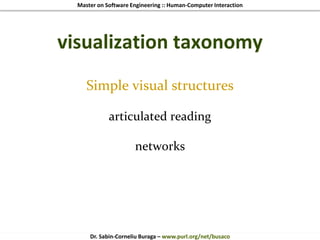
visualization taxonomy
Simple visual structures
articulated reading
n-variable
[XYRn-2]: 2D retinal scatterplots
[XYZRn-1]: 3D retinal scatterplots
may present
a barrier of
perception](https://image.slidesharecdn.com/fcamyqlcqbsxdyrwtb4s-140527090053-phpapp02/85/HCI-2014-8-of-10-Data-Visualization-98-320.jpg)
![Master on Software Engineering :: Human-Computer Interaction
Dr. Sabin-Corneliu Buraga – www.purl.org/net/busaco
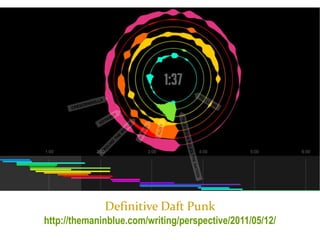
visualization taxonomy
Composed visual structures
single-axis composition [XYn]:
permutation matrices, parallel coordinates](https://image.slidesharecdn.com/fcamyqlcqbsxdyrwtb4s-140527090053-phpapp02/85/HCI-2014-8-of-10-Data-Visualization-106-320.jpg)
![Master on Software Engineering :: Human-Computer Interaction
Dr. Sabin-Corneliu Buraga – www.purl.org/net/busaco
visualization taxonomy
Composed visual structures
double-axis composition [XY]:
graphs](https://image.slidesharecdn.com/fcamyqlcqbsxdyrwtb4s-140527090053-phpapp02/85/HCI-2014-8-of-10-Data-Visualization-108-320.jpg)
![Master on Software Engineering :: Human-Computer Interaction
Dr. Sabin-Corneliu Buraga – www.purl.org/net/busaco
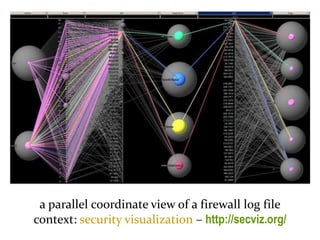
visualization taxonomy
Composed visual structures
recursive composition
2D in 2D [(XY)XY]:
scatterplot matrices, hierarchical axes,…](https://image.slidesharecdn.com/fcamyqlcqbsxdyrwtb4s-140527090053-phpapp02/85/HCI-2014-8-of-10-Data-Visualization-109-320.jpg)
![Master on Software Engineering :: Human-Computer Interaction
Dr. Sabin-Corneliu Buraga – www.purl.org/net/busaco
visualization taxonomy
Composed visual structures
recursive composition
marks in 2D [(XY)R]:
stick figures, color icons, shape coding, Keim spirals,…](https://image.slidesharecdn.com/fcamyqlcqbsxdyrwtb4s-140527090053-phpapp02/85/HCI-2014-8-of-10-Data-Visualization-111-320.jpg)
![Master on Software Engineering :: Human-Computer Interaction
Dr. Sabin-Corneliu Buraga – www.purl.org/net/busaco
visualization taxonomy
Composed visual structures
recursive composition
3D in 3D [(XYZ)XYZ]:
worlds within worlds](https://image.slidesharecdn.com/fcamyqlcqbsxdyrwtb4s-140527090053-phpapp02/85/HCI-2014-8-of-10-Data-Visualization-113-320.jpg)

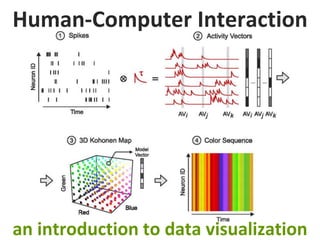
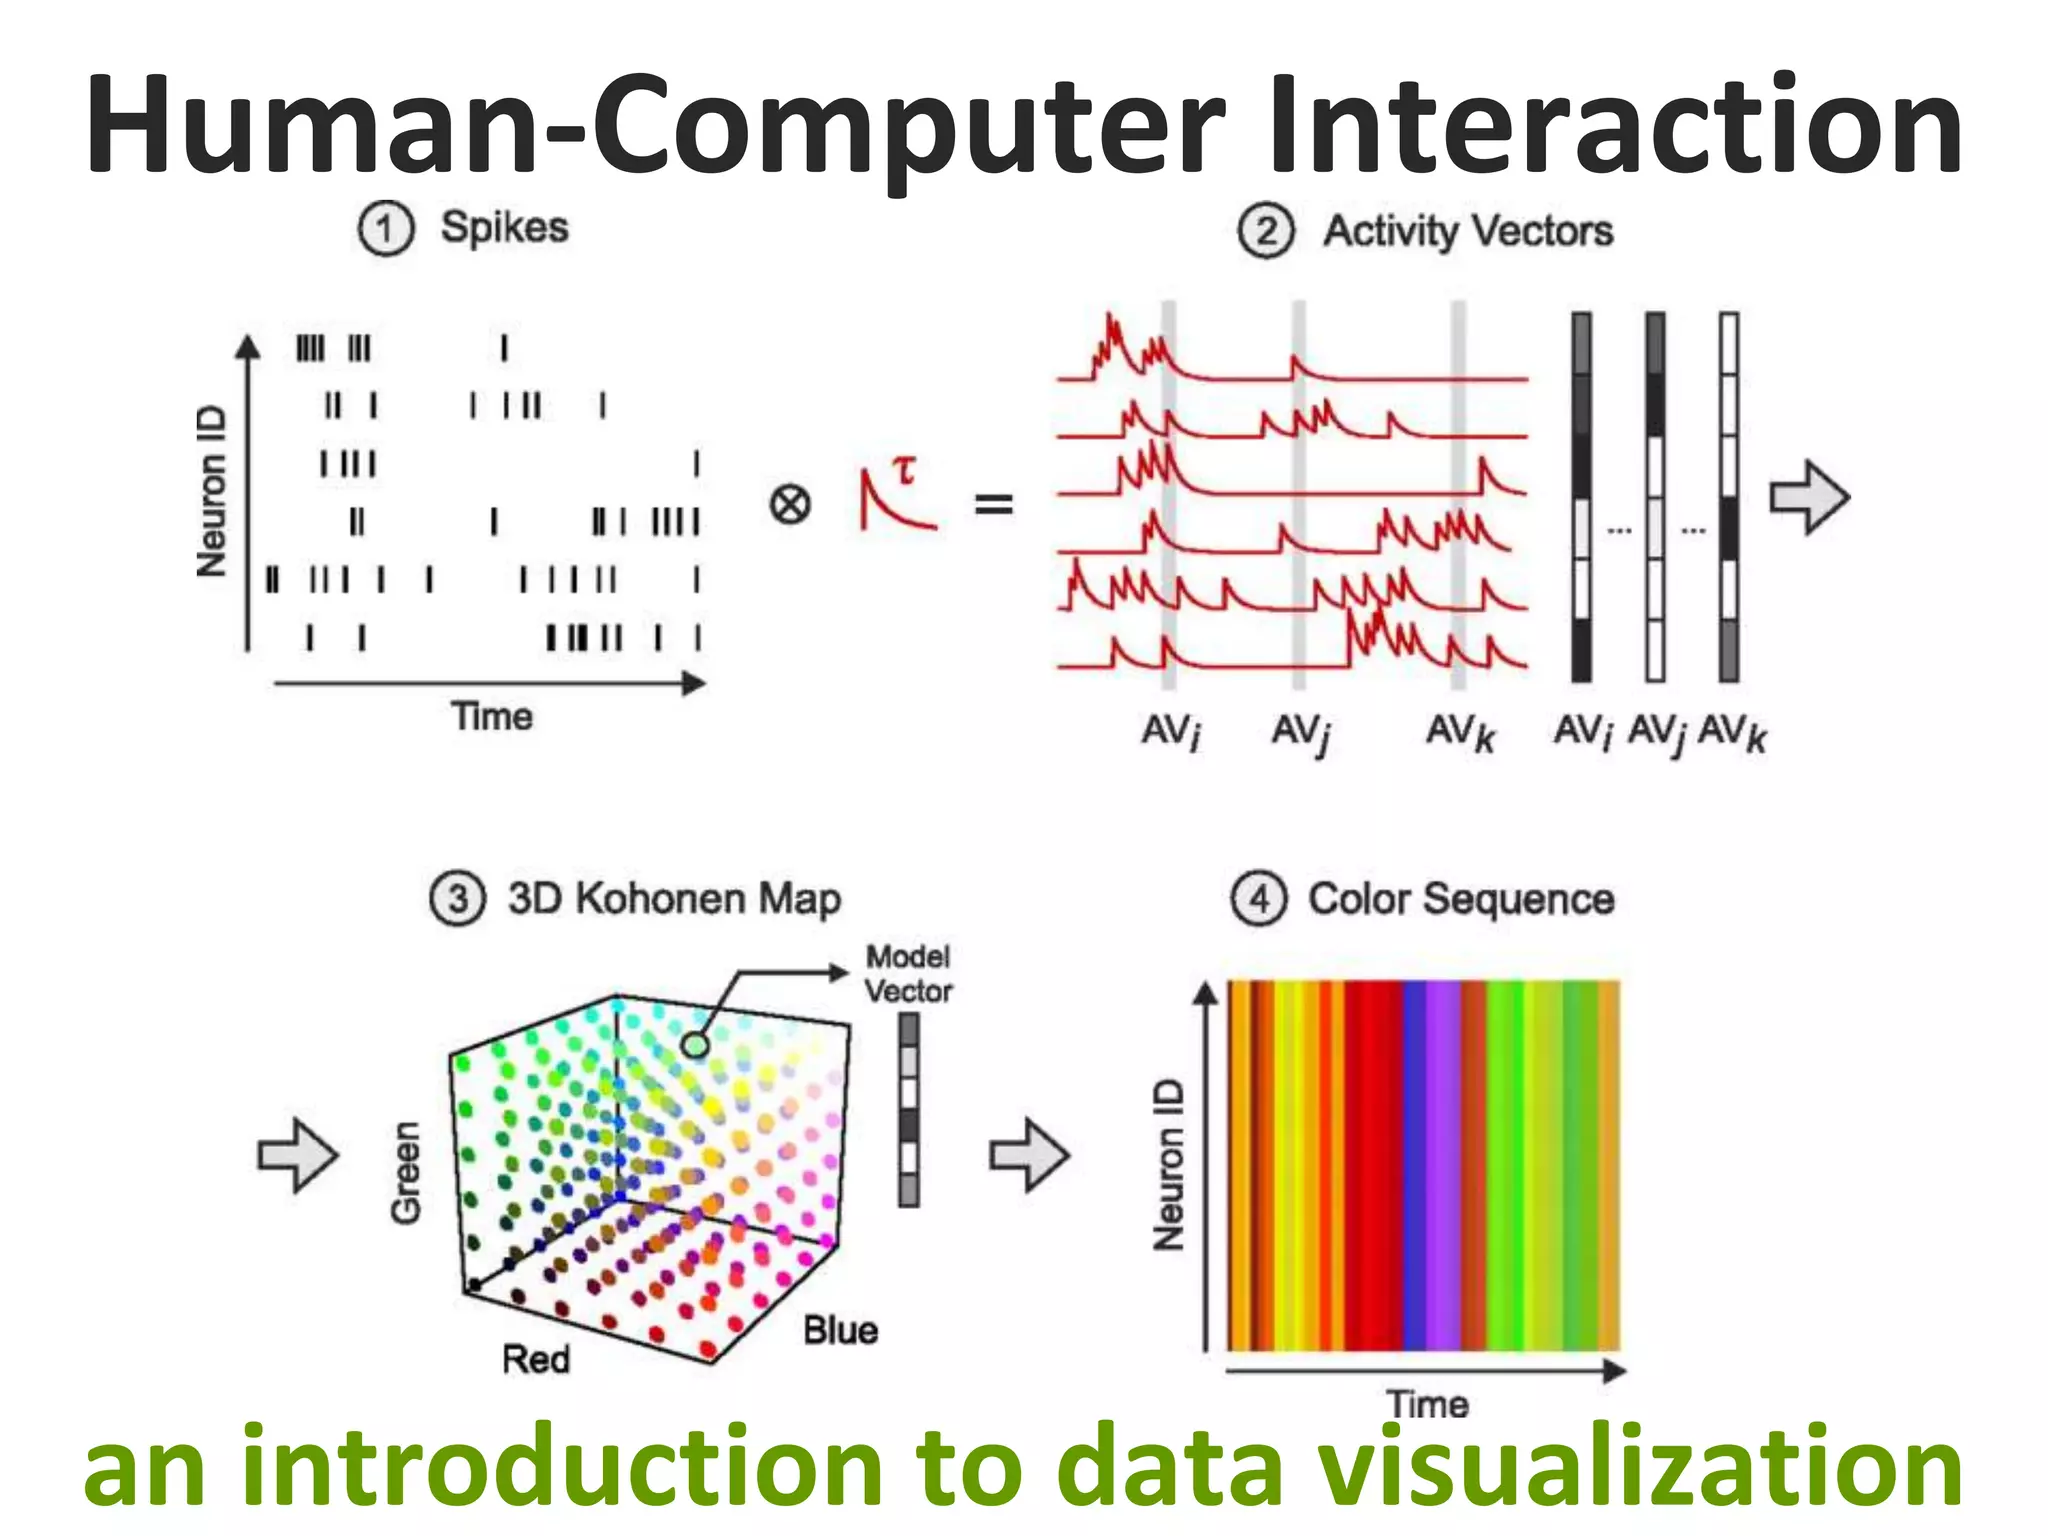
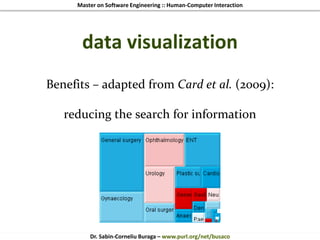
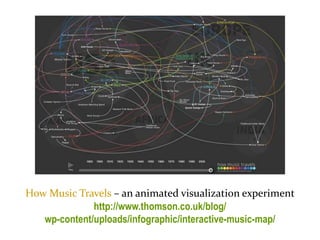
This document provides an in-depth exploration of data visualization within the context of human-computer interaction, highlighting its significance in augmenting cognition and facilitating the understanding of vast amounts of data. It covers the historical origins, key benefits, and the theoretical framework for effectively visualizing data, including modeling and visual structures. Additionally, distinctions between data visualization and infographics are made, emphasizing their different approaches to representing information.