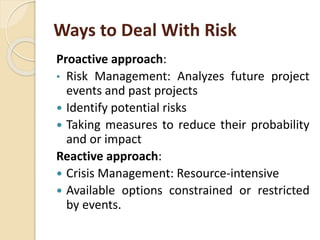
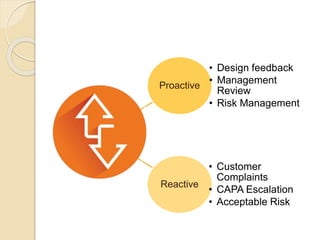
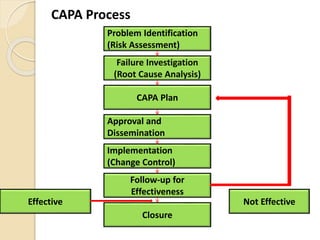
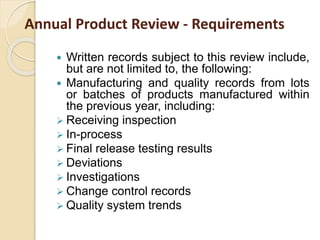
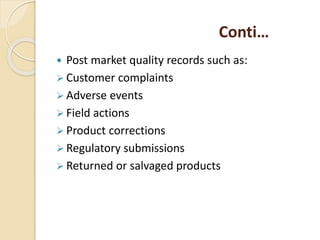
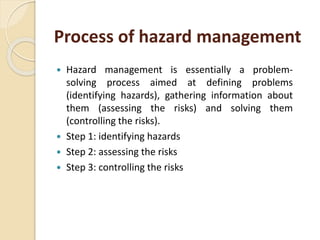
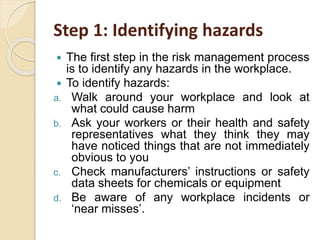
Hazard and risk
management
Prepared by : Shruti Korat
MPH SEM II (QA)
Saurashtra university,
Rajkot
Self-protective measures against workplace
hazards
 Techniques are examined for influencing individual worker
behaviors, actions, and attitudes in ways that could offer
greater self-protection against workplace hazards.
 Training and reinforcement are first described as directive
type means for targeting and strengthening specific worker
actions of this nature.
 Critical considerations here are use of training and
reinforcement approaches that stress the learning of safe or
healthful behaviors as opposed to the unlearning of unsafe or
harmful acts, conditions of practice that insure the transfer of
these learned behaviors to the real situation, setting
performance goals for these actions with frequent feedback
to mark progress, and establishing meaningful rewards with
an adequate reinforcement schedule and delivery system.
Conti…
 Presented next are nondirective approaches which are
designed to create attitude change, a state of heightened
awareness, or other predispositions favorable to self-
protective actions.
 Emphasis here is given to communication, incentives, and
management style factors.
 Company incentives aimed at enlivening general interest in
job health and safety are discussed.
 Increased self-protection is mentioned as a possible by-
product of top management's commitment and lead in job
health and safety matters accompanied by close interactions
with workers.
Critical training for risk
management
 Risk may be defined as the possibility of
suffering damage or loss.
 The possibility is characterized by three
factors:
1. Probability, or likelihood, that loss or
damage will occur.
2. The expected time of occurrence.
3. The magnitude of the negative impact
that can result from its occurrence.
1. Probability of occurrence is high and the
potential impact is very low.
2. Probability of occurrence is low and the
potential impact is very high.
3. Probability of occurrence is low and the
potential impact is very low.
4. Probability of occurrence is high and the
potential impact is very high
Ways to Deal With Risk
Proactive approach:
• Risk Management: Analyzes future project
events and past projects
 Identify potential risks
 Taking measures to reduce their probability
and or impact
Reactive approach:
 Crisis Management: Resource-intensive
 Available options constrained or restricted
by events.
Proactive
• Design feedback
• Management
Review
• Risk Management
Reactive
• Customer
Complaints
• CAPA Escalation
• Acceptable Risk
CAPA Process
Problem Identification
(Risk Assessment)
Failure Investigation
(Root Cause Analysis)
CAPA Plan
Approval and
Dissemination
Implementation
(Change Control)
Follow-up for
Effectiveness
Closure
Effective Not Effective
Annual Product Review - Requirements
 Written records subject to this review include,
but are not limited to, the following:
 Manufacturing and quality records from lots
or batches of products manufactured within
the previous year, including:
 Receiving inspection
 In-process
 Final release testing results
 Deviations
 Investigations
 Change control records
 Quality system trends
Conti…
 Post market quality records such as:
 Customer complaints
 Adverse events
 Field actions
 Product corrections
 Regulatory submissions
 Returned or salvaged products
Process of hazard management
 Hazard management is essentially a problem-
solving process aimed at defining problems
(identifying hazards), gathering information about
them (assessing the risks) and solving them
(controlling the risks).
 Step 1: identifying hazards
 Step 2: assessing the risks
 Step 3: controlling the risks
Step 1: Identifying hazards
 The first step in the risk management process
is to identify any hazards in the workplace.
 To identify hazards:
a. Walk around your workplace and look at
what could cause harm
b. Ask your workers or their health and safety
representatives what they think they may
have noticed things that are not immediately
obvious to you
c. Check manufacturers’ instructions or safety
data sheets for chemicals or equipment
d. Be aware of any workplace incidents or
‘near misses’.
Step 2: Assessing the risks
 The second step is to assess the level of risk
associated with each hazard. This includes
considering:
The severity of any injury or illness that could
occur for example, establish whether it is a small
isolated hazard that could result in a very minor
injury, or if it is a significant hazard that could
have wide ranging and severe effects.
The likelihood or chance that someone will suffer
an illness or injury for example, consider the
number of people who could be exposed to the
hazard.
 A risk assessment will assist in determining
the control measure that should be
implemented by:
Identifying which workers are at risk of
exposure to a hazard.
Determining what sources and processes are
causing that risk.
Identifying if and what kind of control
measures should be implemented.
Checking the effectiveness of existing control
measures.
Step 3: Controlling the risks
 The third step is to control any hazards.
Some control measures are more
effective than others. Control measures
can be ranked from the highest level of
protection and reliability to the lowest.
This ranking is known as the hierarchy of
control.
Risk Management Methods and
Tools
 The references are included as an aid to
gain more knowledge and detail about
the particular tool.
 This is not an exhaustive list.
 It is important to note that no one tool or
set of tools is applicable to every situation
in which a quality risk management
procedure is used.
Conti…
1) Basic Risk Management Facilitation Methods
2) Failure Mode Effects Analysis (FMEA)
3) Failure Mode, Effects and Criticality Analysis
(FMECA)
4) Fault Tree Analysis (FTA)
5) Hazard Analysis and Critical Control Points
(HACCP)
6) Hazard Operability Analysis (HAZOP)
7) Preliminary Hazard Analysis (PHA)
8) Risk Ranking and Filtering
9) Supporting Statistical Tools
1. Basic Risk Management Facilitation
Methods
 Some of the simple techniques that are
commonly used to structure risk
management by organizing data and
facilitating decision-making are:
 Flowcharts,
 Check Sheets,
 Process Mapping,
 Cause and Effect Diagrams (also called an
Ishikawa diagram or fish bone diagram).
2.Failure Mode Effects Analysis (FMEA)
 FMEA provides for an evaluation of potential failure
modes for processes and their likely effect on
outcomes and/or product performance.
 Once failure modes are established, risk reduction
can be used to eliminate, contain, reduce or control
the potential failures.
 It is a powerful tool for summarizing the important
modes of failure, factors causing these failures and
the likely effects of these failures.
Potential Areas of Use
 FMEA can be used to prioritize risks and monitor the
effectiveness of risk control activities.
3. Failure Mode, Effects and Criticality
Analysis (FMECA)
 FMEA might be extended to incorporate an investigation of
the degree of severity of the consequences, their
respective probabilities of occurrence, and their
detectability, thereby becoming a Failure Mode Effect and
Criticality Analysis (FMECA; see IEC 60812).
 In order for such an analysis to be performed, the product
or process specifications should be established.
 FMECA can identify places where additional preventive
actions might be appropriate to minimize risks.
Potential Areas of Use
 FMECA application in the pharmaceutical industry should
mostly be utilized for failures and risks associated with
manufacturing processes; however, it is not limited to this
application.
4.Fault Tree Analysis (FTA)
 The FTA tool is an approach that assumes
failure of the functionality of a product or
process.
 This tool evaluates system failures one at a time
but can combine multiple causes of failure by
identifying causal chains.
 The results are represented pictorially in the
form of a tree of fault modes.
 FTA relies on the experts’ process
understanding to identify causal factors.
Potential Areas of Use(s)
 FTA can be used to establish the pathway to the root
cause of the failure.
 FTA can be used to investigate complaints or
deviations in order to fully understand their root
cause and to ensure that intended improvements will
fully resolve the issue and not lead to other issues
(i.e. solve one problem yet cause a different
problem).
 Fault Tree Analysis is an effective tool for evaluating
how multiple factors affect a given issue.
 The output of an FTA includes a visual representation
of failure modes. It is useful both for risk assessment
and in developing monitoring programs.
5.Hazard Analysis and Critical Control
Points (HACCP)
 HACCP is a systematic, proactive, and
preventive tool for assuring product
quality, reliability, and safety.
 It is a structured approach that applies
technical and scientific principles to
analyze, evaluate, prevent, and control
the risk or adverse consequence of hazard
due to the design, development,
production, and use of products.
HACCP consists of the following
seven steps:
1. conduct a hazard analysis and identify preventive
measures for each step of the process.
2. determine the critical control points.
3. establish critical limits.
4. establish a system to monitor the critical control
points.
5. establish the corrective action to be taken when
monitoring indicates that the critical control points
are not in a state of control.
6. establish system to verify that the HACCP system is
working effectively.
7. establish a record-keeping system.
Potential Areas of Use
 HACCP might be used to identify and manage
risks associated with physical, chemical and
biological hazards (including microbiological
contamination).
 HACCP is most useful when product and process
understanding is sufficiently comprehensive to
support identification of critical control points.
 The output of a HACCP analysis is risk
management information that facilitates
monitoring of critical points not only in the
manufacturing process but also in other life cycle
phases.
6.Hazard Operability Analysis (HAZOP)
 HAZOP is based on a theory that assumes that risk events
are caused by deviations from the design or operating
intentions.
 It is a systematic brainstorming technique for identifying
hazards using so-called “guide- words”.
 “Guide-words” (e.g., No, More, Other Than, Part of, etc.)
are applied to relevant parameters (e.g., contamination,
temperature) to help identify potential deviations from
normal use or design intentions.
 Potential Areas of Use(s)
 HAZOP can be applied to manufacturing processes,
including outsourced production and formulation as well
as the upstream suppliers, equipment and facilities for
drug substances and drug (medicinal) products.
Conti..
 It has also been used primarily in the pharmaceutical
industry for evaluating process safety hazards.
 As is the case with HACCP, the output of a HAZOP
analysis is a list of critical operations for risk
management.
 This facilitates regular monitoring of critical points in
the manufacturing process.
7.Preliminary Hazard Analysis (PHA)
 PHA is a tool of analysis based on applying prior
experience or knowledge of a hazard or failure to
identify future hazards, hazardous situations and
events that might cause harm, as well as to estimate
their probability of occurrence for a given activity,
facility, product or system.
 The tool consists of:
1. The identification of the possibilities that the risk
event happens,
2. The qualitative evaluation of the extent of possible
injury or damage to health that could result and
3. A relative ranking of the hazard using a combination
of severity and likelihood of occurrence, and
4. The identification of possible remedial measures.
Conti…
 Potential Areas of Use
 PHA might be useful when analyzing existing systems or
prioritizing hazards where circumstances prevent a more
extensive technique from being used.
 It can be used for product, process and facility design as
well as to evaluate the types of hazards for the general
product type, then the product class, and finally the specific
product.
 PHA is most commonly used early in the development of a
project when there is little information on design details or
operating procedures thus, it will often be a precursor to
further studies.
 Typically, hazards identified in the PHA are further assessed
with other risk management tools such as those in this
section.
8.Risk Ranking and Filtering
 Risk ranking and filtering is a tool for comparing
and ranking risks.
 Risk ranking of complex systems typically requires
evaluation of multiple diverse quantitative and
qualitative factors for each risk.
 The tool involves breaking down a basic risk
question into as many components as needed to
capture factors involved in the risk.
 These factors are combined into a single relative
risk score that can then be used for ranking risks.
Potential Areas of Use
 Risk ranking and filtering can be used to prioritize
manufacturing sites for inspection/audit by
regulators or industry.
 Risk ranking methods are particularly helpful in
situations in which the portfolio of risks and the
underlying consequences to be managed are
diverse and difficult to compare using a single
tool.
 Risk ranking is useful when management needs to
evaluate both quantitatively-assessed and
qualitatively-assessed risks within the same
organizational framework.
9.Supporting Statistical Tools
 Statistical tools can support and facilitate quality risk
management. They can enable effective data
assessment, aid in determining the significance of the
data set(s), and facilitate more reliable decision making.
A listing of some of the principal statistical tools
commonly used in the pharmaceutical industry is
provided:
 Control Charts, for example:
◦ Acceptance Control Charts (see ISO 7966),
◦ Control Charts with Arithmetic Average and Warning
Limits (see ISO 7873),
◦ Cumulative Sum Charts (see ISO 7871),
◦ Shewhart Control Charts (see ISO 8258),
◦ Weighted Moving Average.
 Design of Experiments (DOE),
 Histograms,
 Pareto Charts,
 Process Capability Analysis.
Hazards and risk management

Hazards and risk management

  • 1.
    Hazard and risk management Preparedby : Shruti Korat MPH SEM II (QA) Saurashtra university, Rajkot
  • 2.
    Self-protective measures againstworkplace hazards  Techniques are examined for influencing individual worker behaviors, actions, and attitudes in ways that could offer greater self-protection against workplace hazards.  Training and reinforcement are first described as directive type means for targeting and strengthening specific worker actions of this nature.  Critical considerations here are use of training and reinforcement approaches that stress the learning of safe or healthful behaviors as opposed to the unlearning of unsafe or harmful acts, conditions of practice that insure the transfer of these learned behaviors to the real situation, setting performance goals for these actions with frequent feedback to mark progress, and establishing meaningful rewards with an adequate reinforcement schedule and delivery system.
  • 3.
    Conti…  Presented nextare nondirective approaches which are designed to create attitude change, a state of heightened awareness, or other predispositions favorable to self- protective actions.  Emphasis here is given to communication, incentives, and management style factors.  Company incentives aimed at enlivening general interest in job health and safety are discussed.  Increased self-protection is mentioned as a possible by- product of top management's commitment and lead in job health and safety matters accompanied by close interactions with workers.
  • 4.
    Critical training forrisk management  Risk may be defined as the possibility of suffering damage or loss.  The possibility is characterized by three factors: 1. Probability, or likelihood, that loss or damage will occur. 2. The expected time of occurrence. 3. The magnitude of the negative impact that can result from its occurrence.
  • 5.
    1. Probability ofoccurrence is high and the potential impact is very low. 2. Probability of occurrence is low and the potential impact is very high. 3. Probability of occurrence is low and the potential impact is very low. 4. Probability of occurrence is high and the potential impact is very high
  • 6.
    Ways to DealWith Risk Proactive approach: • Risk Management: Analyzes future project events and past projects  Identify potential risks  Taking measures to reduce their probability and or impact Reactive approach:  Crisis Management: Resource-intensive  Available options constrained or restricted by events.
  • 7.
    Proactive • Design feedback •Management Review • Risk Management Reactive • Customer Complaints • CAPA Escalation • Acceptable Risk
  • 8.
    CAPA Process Problem Identification (RiskAssessment) Failure Investigation (Root Cause Analysis) CAPA Plan Approval and Dissemination Implementation (Change Control) Follow-up for Effectiveness Closure Effective Not Effective
  • 9.
    Annual Product Review- Requirements  Written records subject to this review include, but are not limited to, the following:  Manufacturing and quality records from lots or batches of products manufactured within the previous year, including:  Receiving inspection  In-process  Final release testing results  Deviations  Investigations  Change control records  Quality system trends
  • 10.
    Conti…  Post marketquality records such as:  Customer complaints  Adverse events  Field actions  Product corrections  Regulatory submissions  Returned or salvaged products
  • 11.
    Process of hazardmanagement  Hazard management is essentially a problem- solving process aimed at defining problems (identifying hazards), gathering information about them (assessing the risks) and solving them (controlling the risks).  Step 1: identifying hazards  Step 2: assessing the risks  Step 3: controlling the risks
  • 12.
    Step 1: Identifyinghazards  The first step in the risk management process is to identify any hazards in the workplace.  To identify hazards: a. Walk around your workplace and look at what could cause harm b. Ask your workers or their health and safety representatives what they think they may have noticed things that are not immediately obvious to you c. Check manufacturers’ instructions or safety data sheets for chemicals or equipment d. Be aware of any workplace incidents or ‘near misses’.
  • 13.
    Step 2: Assessingthe risks  The second step is to assess the level of risk associated with each hazard. This includes considering: The severity of any injury or illness that could occur for example, establish whether it is a small isolated hazard that could result in a very minor injury, or if it is a significant hazard that could have wide ranging and severe effects. The likelihood or chance that someone will suffer an illness or injury for example, consider the number of people who could be exposed to the hazard.
  • 14.
     A riskassessment will assist in determining the control measure that should be implemented by: Identifying which workers are at risk of exposure to a hazard. Determining what sources and processes are causing that risk. Identifying if and what kind of control measures should be implemented. Checking the effectiveness of existing control measures.
  • 15.
    Step 3: Controllingthe risks  The third step is to control any hazards. Some control measures are more effective than others. Control measures can be ranked from the highest level of protection and reliability to the lowest. This ranking is known as the hierarchy of control.
  • 16.
    Risk Management Methodsand Tools  The references are included as an aid to gain more knowledge and detail about the particular tool.  This is not an exhaustive list.  It is important to note that no one tool or set of tools is applicable to every situation in which a quality risk management procedure is used.
  • 17.
    Conti… 1) Basic RiskManagement Facilitation Methods 2) Failure Mode Effects Analysis (FMEA) 3) Failure Mode, Effects and Criticality Analysis (FMECA) 4) Fault Tree Analysis (FTA) 5) Hazard Analysis and Critical Control Points (HACCP) 6) Hazard Operability Analysis (HAZOP) 7) Preliminary Hazard Analysis (PHA) 8) Risk Ranking and Filtering 9) Supporting Statistical Tools
  • 18.
    1. Basic RiskManagement Facilitation Methods  Some of the simple techniques that are commonly used to structure risk management by organizing data and facilitating decision-making are:  Flowcharts,  Check Sheets,  Process Mapping,  Cause and Effect Diagrams (also called an Ishikawa diagram or fish bone diagram).
  • 19.
    2.Failure Mode EffectsAnalysis (FMEA)  FMEA provides for an evaluation of potential failure modes for processes and their likely effect on outcomes and/or product performance.  Once failure modes are established, risk reduction can be used to eliminate, contain, reduce or control the potential failures.  It is a powerful tool for summarizing the important modes of failure, factors causing these failures and the likely effects of these failures. Potential Areas of Use  FMEA can be used to prioritize risks and monitor the effectiveness of risk control activities.
  • 20.
    3. Failure Mode,Effects and Criticality Analysis (FMECA)  FMEA might be extended to incorporate an investigation of the degree of severity of the consequences, their respective probabilities of occurrence, and their detectability, thereby becoming a Failure Mode Effect and Criticality Analysis (FMECA; see IEC 60812).  In order for such an analysis to be performed, the product or process specifications should be established.  FMECA can identify places where additional preventive actions might be appropriate to minimize risks. Potential Areas of Use  FMECA application in the pharmaceutical industry should mostly be utilized for failures and risks associated with manufacturing processes; however, it is not limited to this application.
  • 21.
    4.Fault Tree Analysis(FTA)  The FTA tool is an approach that assumes failure of the functionality of a product or process.  This tool evaluates system failures one at a time but can combine multiple causes of failure by identifying causal chains.  The results are represented pictorially in the form of a tree of fault modes.  FTA relies on the experts’ process understanding to identify causal factors.
  • 22.
    Potential Areas ofUse(s)  FTA can be used to establish the pathway to the root cause of the failure.  FTA can be used to investigate complaints or deviations in order to fully understand their root cause and to ensure that intended improvements will fully resolve the issue and not lead to other issues (i.e. solve one problem yet cause a different problem).  Fault Tree Analysis is an effective tool for evaluating how multiple factors affect a given issue.  The output of an FTA includes a visual representation of failure modes. It is useful both for risk assessment and in developing monitoring programs.
  • 23.
    5.Hazard Analysis andCritical Control Points (HACCP)  HACCP is a systematic, proactive, and preventive tool for assuring product quality, reliability, and safety.  It is a structured approach that applies technical and scientific principles to analyze, evaluate, prevent, and control the risk or adverse consequence of hazard due to the design, development, production, and use of products.
  • 24.
    HACCP consists ofthe following seven steps: 1. conduct a hazard analysis and identify preventive measures for each step of the process. 2. determine the critical control points. 3. establish critical limits. 4. establish a system to monitor the critical control points. 5. establish the corrective action to be taken when monitoring indicates that the critical control points are not in a state of control. 6. establish system to verify that the HACCP system is working effectively. 7. establish a record-keeping system.
  • 25.
    Potential Areas ofUse  HACCP might be used to identify and manage risks associated with physical, chemical and biological hazards (including microbiological contamination).  HACCP is most useful when product and process understanding is sufficiently comprehensive to support identification of critical control points.  The output of a HACCP analysis is risk management information that facilitates monitoring of critical points not only in the manufacturing process but also in other life cycle phases.
  • 26.
    6.Hazard Operability Analysis(HAZOP)  HAZOP is based on a theory that assumes that risk events are caused by deviations from the design or operating intentions.  It is a systematic brainstorming technique for identifying hazards using so-called “guide- words”.  “Guide-words” (e.g., No, More, Other Than, Part of, etc.) are applied to relevant parameters (e.g., contamination, temperature) to help identify potential deviations from normal use or design intentions.  Potential Areas of Use(s)  HAZOP can be applied to manufacturing processes, including outsourced production and formulation as well as the upstream suppliers, equipment and facilities for drug substances and drug (medicinal) products.
  • 27.
    Conti..  It hasalso been used primarily in the pharmaceutical industry for evaluating process safety hazards.  As is the case with HACCP, the output of a HAZOP analysis is a list of critical operations for risk management.  This facilitates regular monitoring of critical points in the manufacturing process.
  • 28.
    7.Preliminary Hazard Analysis(PHA)  PHA is a tool of analysis based on applying prior experience or knowledge of a hazard or failure to identify future hazards, hazardous situations and events that might cause harm, as well as to estimate their probability of occurrence for a given activity, facility, product or system.  The tool consists of: 1. The identification of the possibilities that the risk event happens, 2. The qualitative evaluation of the extent of possible injury or damage to health that could result and 3. A relative ranking of the hazard using a combination of severity and likelihood of occurrence, and 4. The identification of possible remedial measures.
  • 29.
    Conti…  Potential Areasof Use  PHA might be useful when analyzing existing systems or prioritizing hazards where circumstances prevent a more extensive technique from being used.  It can be used for product, process and facility design as well as to evaluate the types of hazards for the general product type, then the product class, and finally the specific product.  PHA is most commonly used early in the development of a project when there is little information on design details or operating procedures thus, it will often be a precursor to further studies.  Typically, hazards identified in the PHA are further assessed with other risk management tools such as those in this section.
  • 30.
    8.Risk Ranking andFiltering  Risk ranking and filtering is a tool for comparing and ranking risks.  Risk ranking of complex systems typically requires evaluation of multiple diverse quantitative and qualitative factors for each risk.  The tool involves breaking down a basic risk question into as many components as needed to capture factors involved in the risk.  These factors are combined into a single relative risk score that can then be used for ranking risks.
  • 31.
    Potential Areas ofUse  Risk ranking and filtering can be used to prioritize manufacturing sites for inspection/audit by regulators or industry.  Risk ranking methods are particularly helpful in situations in which the portfolio of risks and the underlying consequences to be managed are diverse and difficult to compare using a single tool.  Risk ranking is useful when management needs to evaluate both quantitatively-assessed and qualitatively-assessed risks within the same organizational framework.
  • 32.
    9.Supporting Statistical Tools Statistical tools can support and facilitate quality risk management. They can enable effective data assessment, aid in determining the significance of the data set(s), and facilitate more reliable decision making. A listing of some of the principal statistical tools commonly used in the pharmaceutical industry is provided:  Control Charts, for example: ◦ Acceptance Control Charts (see ISO 7966), ◦ Control Charts with Arithmetic Average and Warning Limits (see ISO 7873), ◦ Cumulative Sum Charts (see ISO 7871), ◦ Shewhart Control Charts (see ISO 8258), ◦ Weighted Moving Average.
  • 33.
     Design ofExperiments (DOE),  Histograms,  Pareto Charts,  Process Capability Analysis.