ICT role in 21st century education and it's challenges.pdf
Harvard Policython Deliverable
1. Policy for the People:
Pandemic Policython
In partnership with
Kayla Altman
kaltman1@binghamton.edu
(917) 579-0211
Alexander Lai
alai5@binghamton.edu
(718) 962-4212
Benice Mach
bmach1@binghamton.edu
(917) 422-1299
Michael Totaro
mtotaro1@binghamton.edu
(716) 955-9735
The BadaBING BadaBROOME Policy
An Economic Equity Proposal for Binghamton, New York
1
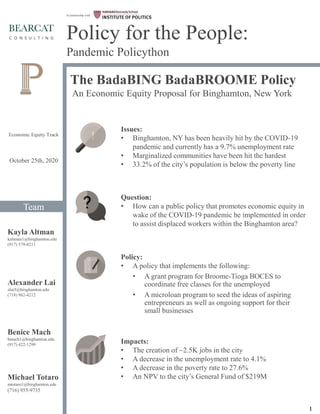
Issues:
• Binghamton, NY has been heavily hit by the COVID-19
pandemic and currently has a 9.7% unemployment rate
• Marginalized communities have been hit the hardest
• 33.2% of the city’s population is below the poverty line
Impacts:
• The creation of ~2.5K jobs in the city
• A decrease in the unemployment rate to 4.1%
• A decrease in the poverty rate to 27.6%
• An NPV to the city’s General Fund of $219M
Question:
• How can a public policy that promotes economic equity in
wake of the COVID-19 pandemic be implemented in order
to assist displaced workers within the Binghamton area?
Policy:
• A policy that implements the following:
• A grant program for Broome-Tioga BOCES to
coordinate free classes for the unemployed
• A microloan program to seed the ideas of aspiring
entrepreneurs as well as ongoing support for their
small businesses
Team
Economic Equity Track
October 25th, 2020
2. I. Background……………………………….…………………….3
II. Research Findings………………………………………………4
III. Current Policies in Place………………………………………..5
IV. Our Policy………………………………………………………6
V. Conclusion…………………………………………………….10
2
Table of Contents
The BadaBING BadaBROOME Policy
An Economic Equity Proposal for Binghamton, New York
3. According to the U.S. Small Business Administration Office of Advocacy, small
businesses are “the lifeblood of the U.S. economy,” driving innovation and competitiveness
and creating two-thirds of net new jobs in the country. Walking through the dilapidated and
sparsely-populated business hub of the city of Binghamton, it is evident that more small
businesses are needed to bring economic prosperity and success back into the region. The
COVID-19 pandemic has added undue pressure on those already struggling in the area,
ushering in a 9.7% unemployment rate that points to immediate relief being needed. In a city
where 33.3% of the population, as of 2017, already falls below the state poverty line,
Binghamton’s city council should take advantage of the $20 million they have at their
disposal in the city’s General Fund to invest in new small business and educational upskilling
of the Binghamton unemployed population.
Cultivating a policy that creates economic opportunity for Binghamton’s most
vulnerable and marginalized communities, as well as those especially afflicted by the
COVID-19 pandemic, is needed to provide an equitable footing for Binghamton residents that
need it most. More specifically, economic stimulus through monetary and educational
investment and small business development should be offered to help marginalized groups
compete with wealthier residents and large companies, who have more of the capital and
business acumen needed to start and refine entrepreneurial pursuits. Personalized support for
participants and their individual needs and business goals will create better rates of long-term
success and increase the standard of living for parties participating under the policy.
3
I. Background
The BadaBING BadaBROOME Policy
An Economic Equity Proposal for Binghamton, New York
4. The city of Binghamton recognizes the steady decline in population and available
workforce in the local area. Local administrators have found it difficult to replace the current
workforce due to aging, out migration, and training of the workforce. An interview with 21
major employers in Broome County by The Agency demonstrates the most common trend is
due to the shortage of technical skills in the current population. In effect, this leads to other
issues such as competition for skilled workers, demand for higher salaries, and inability to
retain these workers. Employers conduct their own training within the company and applaud
the training programs that Broome-Tioga BOCES offers to participants. However, employers
also believe that the programs can be more accessible in regards to tuition assistance.
Another main concern is that local individuals and younger generations are not aware
of other opportunities besides pursuing a college degree. These opportunities include
vocational education and training (VET). VET is teaching knowledge and skills needed
related to a specific trade, occupation or vocation. This type of education takes less time to
complete compared to a four-year college and on average costs roughly $4,000 for the entire
program in the Binghamton area. The main educational platform for VET in the Binghamton
area is Broome-Tioga BOCES.
Small businesses are a driving force of the economy and Binghamton members could
benefit in creating their own opportunities with skills learned from VET during such
unprecedented times. Unfortunately, entrepreneurial studies mainly focus on large urban
cities. Philip T. Roundy, an Assistant Professor of Entrepreneurship at the University of
Tennessee at Chattanooga, recently conducted a study based on a small city, analyzing the
intersectionality of economic and community dynamics that come into play in entrepreneurial
ecosystems. Entrepreneurial ecosystems is an embodiment of all forces that promote and
sustain entrepreneurship in the area. This views entrepreneurship as socially-embedded and
dependent on stakeholders, cultural values, institutions, and infrastructure. The population of
small towns anywhere between 5K-250K individuals, proves that these locations can exhibit
entrepreneurship. The context of entrepreneurship in small cities demonstrates that networks
of entrepreneurs, community members and organizations play a big role in developing
community logic and ecosystem coherence which positively impact entrepreneurial
ecosystems.
4
II. Research Findings
The BadaBING BadaBROOME Policy
An Economic Equity Proposal for Binghamton, New York
5. The policy proposal aims to work with VET programs and promote entrepreneurial
ecosystems. Important policies to research include funding for VET programs, policies in
place to help with COVID-19 relief, and entrepreneurial opportunities currently in the
Binghamton area. This will give a holistic view of the policies in place and how to improve it
to benefit the local community.
Funding for vocational education and training is categorized into needs-based
scholarship, merit-based scholarship, grant programs, scholarships, and loans. There are
various different types of opportunities for funding but many of these options work on rigid
timelines. If an individual missed a deadline, you would have to wait for the next cycle to
apply. Furthermore, for individuals that are not literate in this realm, it is hard to navigate
these different resources and apply in a timely manner. The federal government only provides
funding for accredited institutions. Only the nursing program at Broome-Tioga BOCES is
accredited according to the US Department of Education. This leads to further obstacles for
individuals that are looking for funding for vocational education and training. With the
COVID-19 pandemic affecting employment rates, an annual timeline is unrealistic for these
displaced workers.
In terms of policies in place based on COVID-19, the Coronavirus Aid, Relief and
Economic Security Act is a federal policy signed into place that provides funding for
individuals, small businesses, corporations, education, hospitals, and local health. This comes
in the form of a $1,200 stimulus check for individuals depending on income level and
household number. Small businesses will also receive administration payroll relief to help
minimize layoff. Funding is also provided for healthcare institutions for protective equipment
and expansion efforts due to the increased influx of patients.
There are three main incubators in Binghamton that assist startup companies: Koffmann
Southern Tier Incubator, Start-Up Suite, and B-Innovative. The Koffman Southern Tier
Incubator is a collaboration between SUNY Broome, Binghamton University, the Southern
Tier High Technology Incubator, and the regional economic development community aiming
to increase the entrepreneurial ecosystem in the area. Start-Up Suite provides office and lab
space for these ventures while B-Innovative is a student incubator on SUNY Binghamton
campus.
5
III. Current Policies in Place
The BadaBING BadaBROOME Policy
An Economic Equity Proposal for Binghamton, New York
6. These initiatives are geared more towards college students rather than the general
Binghamton community. The funding received for the Koffman Southern Tier Incubator is
part of the NYSUNY 2020 Challenge Grant Program. A majority of their program ventures
have been focused on technology, research, and laboratories. There is little to no signs of
similar programs for general small businesses in the area for community members.
6
The BadaBING BadaBROOME Policy
An Economic Equity Proposal for Binghamton, New York
IV. Our Policy
Current policies in place do not account for trade school funding for non-accredited
schools and local efforts in aiding the success of new entrepreneurial pursuits focus primarily
on projects intended for university students. The lack of options afforded to local residents is
the opposite of flexibility and personalization that is needed for participants to be successful
and for the community to be benefited as a whole. Our policy strives to capitalize on these
glaring holes in public policy by providing such flexibility and personalization to promote a
more supportive and hands-on approach to upskilling Binghamton residents. Regardless of
what path participants intend to pursue, whether it be entrepreneurial endeavors, educational
pursuits, or a combination of the two, our policy is designed to strengthen the community and
alleviate the effects of unemployment and the pandemic.
A major provision of our proposal is a grant with an option of an extended microloan
that will be distributed to affected individuals seeking an entrepreneurial project within the
City of Binghamton. A committee from the City of Binghamton will determine eligibility for
the $5K grant after applications are submitted. The intended audience of the grant would be
single mothers and other marginalized and minority groups that have been misplaced by the
pandemic and misrepresented in Binghamton’s economy. After applicants are approved for
the initial grant, recipients will be assigned a personal mentor from the local Binghamton area
that aligns with their industry and specific needs. This support system is designed to
positively impact vulnerable or marginalized groups that might need additional assistance as
they begin their entrepreneurial journey.
Along with assigned mentors, program participants will also have access to bimonthly
guest speakers relating their experiences with financial management, entrepreneurial skills,
and the process of building a successful business. These speakers are intended to be standout
role models that program participants can look up to and have the opportunity to network
with, with the aim being to bring in local talent to speak upon their own experiences building
and owning a small-business within Broome County.
7. The speaker series is open to bringing other guest speakers in from additional areas, should
there be interest in particular entrepreneurs outside of Broome County. Overall costs for 6 bi-
monthly speakers are estimated to be no more than $10K per speaker, for a total of $60K.
Speakers could also elect to waive their membership fees to the Chamber of Commerce as
part of their payment. Bi-weekly workshops will also take place for the first three months
during the initial development of the projects and will transition into a monthly meeting
period to ensure that new businesses have the appropriate resources available to ask questions
and receive insight for how to deal with common startup problems. There will be one-on-one
mentoring and feedback, instructional videos, and hands-on development on real world
applications to owning and running a small-business. The workshop series will be open to
those participating in the BOCES educational program, as well as through operating solely
entrepreneurial businesses.
As entrepreneurs establish themselves in the Binghamton market and scale their
businesses, two members from the Chamber of Commerce will be tasked with overseeing the
ongoing progress of the businesses throughout their implementation. Costing an estimated
$45k-$50k a year, the local project team from the Chamber of Commerce will oversee the
project from its incubation and through it’s opening. This is to ensure progress for the project
and allow for open communication between the entrepreneur and the committee. After a 6-
month probationary period, there will be a report generated by the two members overseeing
the project on a closer level. If approved for additional funds, an amount will be issued as a
micro loan to the receiver after a thorough evaluation on the potential continued success of
the business. Microloan offered to eligible participants would be in the amount of $14,735,
the average microloan given to current small business owners in the United States. With an
interest rate of 7.5%, the repayment of the microloan will be collected in two ways--either
paid upfront with a lump sum, or a prearranged three-year payment plan.
In addition to support given to those interested in starting their own business, the other
major consideration of our policy is allocating funds to defray costs for participants interested
in learning a trade at Broome-Tioga BOCES. The grant award given to the unemployed varies
in amount, dependent on the course and trade they are interested in pursuing, but the goal is
to provide a cost-free solution that brings marginalized groups especially into a trade program
to learn new skills.
7
The BadaBING BadaBROOME Policy
An Economic Equity Proposal for Binghamton, New York
8. To align these individuals with the best possible opportunity, spots for each program were
allocated according to the expected job replacement demand over the next ten years in
Broome County. This prevents crowding in programs that might not result in employment
after finishing at BOCES and promotes diversity in skill, which helps the Binghamton
community in the long run.
8
The BadaBING BadaBROOME Policy
An Economic Equity Proposal for Binghamton, New York
An important consideration to note is that those participating in the BOCES
educational initiative under our policy would also be eligible for grants to start their own
businesses fitting their newly earned trade, as applicable, should they want to self-start a
business instead of pursuing employment with an established employer.
With both programs, an emphasis is placed on providing equitable solutions that help
lift up those that have historically been subject to unfair business practices and lack of
opportunities. A central way that we aim to include underrepresented and marginalized
groups in our policy pursuit to reskill and support the unemployed and those afflicted by the
pandemic is in our marketing and outreach efforts for grant and loan opportunities. In
addition to promotion through local news channels, radio stations, and Chamber of
Commerce, special attention will be taken to partner with community organizations and
groups that can further disseminate information specifically to those targeted by the policy.
Organizations included in this initiative include, but are not limited to the YWCA, United
Way of Broome County, Broome-Tioga NAACP, American Civic Association, and the
Binghamton Pride Coalition.
9. With both the entrepreneurship program initiative and the grant program initiative, a
projected ~2.5K new jobs can be created for the city of Binghamton. Based on the programs
that Broome-Tioga BOCES offers, these newly employed people will have an average salary
of $32,492. In effect, this will reduce the unemployed population to ~1.8K, giving
Binghamton a new unemployment rate of 4.1%. In addition, since an average salary of
$39,492 is above the poverty line level salary of $26,200, ~2.5K people are expected to be
lifted above the poverty line, resulting in a new poverty rate of 27.6% for Binghamton.
Determining the effects of our proposal is important in deciding upon the success of
the initiative. Tracking various metrics throughout the course of the proposal implementation
and the monitoring of businesses in the years after entrepreneurs have utilized our services is
key to figuring out the long-term viability and impact on the Binghamton community.
9
The BadaBING BadaBROOME Policy
An Economic Equity Proposal for Binghamton, New York
In order to pay for the initiatives in our policy, we plan for a total of ~$13.5M being
drawn from an already existing General Fund allocated in the City’s budget, with an
additional $150K drawn each year to support it. The initial outlay of capital will be steep and
result in a negative cash flow in 2020, but we project (assuming a weighted average cost of
capital of 2.82% and a conservative flat terminal growth rate of 0%) that this policy has a
potential net present value of $219M to the fund. This is significant in that the proposal is a
lot more realistic because the funding is already able to be used and could be implemented
quicker than if money had to be fundraised before use. This ties in well with the need coming
from the Binghamton community, as many of the unemployed and those recently impacted by
COVID-19 have run out of funds and federal programs such as the CARES Act assisting
these individuals has tapered off.
10. 10
The BadaBING BadaBROOME Policy
An Economic Equity Proposal for Binghamton, New York
Pulling marginalized and underprivileged individuals and families out of poverty is a central
objective to our proposal, and an actual impact on lives changed through the implementation
of our policy should be reflected in a lower percentage of Binghamton residents under the
poverty line. Binghamton officials will follow policy participants' outcomes as they trek
through the BOCES and entrepreneurship tracks outlined under the policy. Another key
metric we’ll be focusing on is the change in unemployed numbers in Binghamton and how
upskilling through entrepreneurship and education betters that eligible workforce.
Gauging the impact on the community through hard economic data, such as the
percentage of the population under the poverty line and unemployment figures is not the only
focus of our policymakers; community health can also be derived and analyzed through soft
data and resident sentiment. To gauge the long-term health of the community, a community
viability system will be designed and implemented to determine Binghamton residents'
happiness and satisfaction with their lives, similar to the Wellbeing project pioneered at Santa
Monica. Rather than utilizing outside consultant services to collect data, an in-house
alternative will be created that builds upon data collected through the Broome Task Force
Report and City of Binghamton produced data collection and surveys. Binghamton’s local
government would be in charge of sending out surveys and collecting data on an annual basis
to give them the ability to compare satisfaction and happiness with prior years and look at any
corresponding trends in the population. This analysis of the population could point to
underlying successes or problems not as easily found through conventional means and better
position authorities to improve living conditions in Binghamton.
V. Conclusion
Binghamton is known for its high levels of unemployment and poverty, and with the
COVID-19 pandemic, these figures have only been amplified. The objective of the policy is
to promote economic equity in the area to create opportunities for the unemployed, and it
presents an opportunity for the local government to issue grants for VET at Broome-Tioga
BOCES as well as implement a microloan program to provide seed capital and resources to
aspiring entrepreneurs, solving both unemployment and poverty. Our models project that this
policy can create ~2.5K jobs, decrease the unemployment rate to 4.1%, decrease the poverty
rate to 27.6%, and result in an NPV of $219M to the city’s General Fund. Not only will the
policy be able to address the continuing lack of skilled workers in the Binghamton area, but
it’s also the perfect time to invest in local human capital during this downturn.
11. I. Discounted Cash Flow Analysis……………………………….12
II. Net Present Value Sensitivity Analyses………………………..12
III. City of Binghamton Debt Obligations…………….…………..13
IV. Entrepreneurship Program Cost Analysis……………………..13
V. Grant Program Cost Analysis…………….…………………....14
VI. Average Entry Level Wages………….………….…………….14
VII. Tax Revenue Analysis………….………….…………………..14
VIII. Binghamton Labor Force Data………….……………………..15
IX. Binghamton Historical Unemployment Rate………………….15
X. Binghamton Historical Population………….………………....16
XI. New Jobs Analysis………….………….………….…………..16
XII. Binghamton Income Breakdown………….………….……......17
XIII. Average U.S. Income Spend Breakdown………….…………..17
XIV. Binghamton Historical Gross Domestic Product…………..….17
XV. Works Cited……………………………………………………18
11
Appendix Table of Contents
The BadaBING BadaBROOME Policy
An Economic Equity Proposal for Binghamton, New York
12. 12
I. Discounted Cash Flow Analysis
The BadaBING BadaBROOME Policy
An Economic Equity Proposal for Binghamton, New York
II. Net Present Value Sensitivity Analyses
Net Present Value of All Future Fund Flows (Numbers in thousands of $USD)
Weighted Average Cost of Capital
2.80% 2.81% 2.82% 2.83% 2.84%
(0.02%) 198,345.0 197,596.5 196,853.2 196,115.1 195,382.2
(0.01%) 199,019.8 198,266.2 197,517.9 196,775.0 196,037.2
0.00% 199,699.4 198,940.7 198,187.4 197,439.5 196,696.8
0.01% 200,383.9 199,620.1 198,861.7 198,108.7 197,361.0
0.02% 201,073.3 200,304.3 199,540.8 198,782.7 198,030.0
Terminal
Growth
Rate
Net Present Value of General Fund (Numbers in thousands of $USD)
Weighted Average Cost of Capital
2.80% 2.81% 2.82% 2.83% 2.84%
(0.02%) 219,647.9 218,899.3 218,156.0 217,418.0 216,685.1
(0.01%) 220,322.7 219,569.1 218,820.8 218,077.8 217,340.0
0.00% 221,002.3 220,243.6 219,490.3 218,742.3 217,999.6
0.01% 221,686.8 220,922.9 220,164.5 219,411.5 218,663.9
0.02% 222,376.2 221,607.1 220,843.6 220,085.5 219,332.8
Terminal
Growth
Rate
(Numbers in thousands of $USD) Historical (Fiscal Year Ending December 31st) Projected (Fiscal Year Ending December 31st)
General Fund Income Statement 2016 2017 2018 2019 2020 2021 2022 2023 2024
Real Property Taxes 36,678.283 36,621.6 35,928.3 36,409.4 36,319.8 36,219.1 36,316.1 36,285.0 36,273.4
Real Property Tax Items 727.545 787.7 993.9 836.4 872.7 901.0 870.0 881.2 884.1
Nonproperty Tax Items 11,257.741 12,163.2 12,948.2 12,123.1 10,352.9 14,319.4 14,707.2 15,105.5 15,514.6
Departmental Income 1,505.204 1,778.2 1,600.4 1,627.9 1,668.8 1,632.4 1,643.0 1,648.1 1,641.2
Intergovernmental Charges 600.910 262.4 557.6 473.6 431.2 487.5 464.1 460.9 470.8
Use Of Money And Property 114.477 141.3 1,529.7 595.2 755.4 960.1 770.2 828.6 853.0
Licenses And Permits 268.903 325.6 274.6 289.7 296.7 287.0 291.1 291.6 289.9
Fines And Forfeitures 603.087 613.4 401.0 539.2 517.8 486.0 514.3 506.1 502.1
Sale Of Property And Compensation For Loss 288.433 134.0 542.1 321.5 332.6 398.7 351.0 360.8 370.2
Miscellaneous Local Sources 222.575 1,131.3 108.0 487.3 575.5 390.3 484.4 483.4 452.7
Interfund Revenues 1,555.180 1,591.4 509.1 1,218.5 1,106.3 944.6 1,089.8 1,046.9 1,027.1
State Sources 10,280.479 10,018.4 10,013.6 10,104.1 10,045.3 10,054.3 10,067.9 10,055.9 10,059.4
Federal Sources 560.734 52.8 176.0 263.2 164.0 201.1 209.4 191.5 200.7
Total Revenue 64,663.6 65,621.2 65,582.6 65,289.1 63,439.1 67,281.6 67,778.7 68,145.4 68,539.1
General Governmental Support 6,562.8 6,661.6 7,378.8 6,867.7 6,969.4 7,072.0 6,969.7 7,003.7 7,015.1
Public Safety 22,108.3 22,031.2 22,978.9 22,372.8 22,461.0 22,604.3 22,479.4 22,514.9 22,532.8
Public Health 43.8 47.3 47.9 46.3 47.1 47.1 46.8 47.0 47.0
Transportation 1,877.9 1,845.4 2,084.6 1,936.0 1,955.3 1,992.0 1,961.1 1,969.5 1,974.2
Economic Assistance And Opportunity 272.9 296.1 0.0 189.7 13,752.0 350.0 350.0 350.0 350.0
Culture And Recreation 2,901.9 2,922.2 2,978.3 2,934.1 0.0 1,970.8 1,635.0 1,201.9 1,602.6
Home And Community Services 1,989.2 943.1 1,300.8 1,411.0 0.0 903.9 771.7 558.5 744.7
Employee Benefits 17,661.0 17,099.9 17,263.1 17,341.3 17,234.8 17,279.7 17,285.3 17,266.6 17,277.2
Debt Service: Principal 4,047.0 5,402.6 4,851.5 4,767.0 5,007.0 4,875.2 4,883.1 4,921.8 4,893.3
Debt Service: Interest 1,622.3 1,496.1 1,765.3 1,627.9 1,629.8 1,674.3 1,644.0 (3,605.0) 1,649.4
Total Expenditures 59,087.1 58,745.5 60,649.1 59,493.9 69,056.4 58,769.3 58,026.0 52,228.8 58,086.3
Gross Profit 5,576.5 6,875.7 4,933.5 5,795.2 (5,617.3) 8,512.4 9,752.7 15,916.7 10,452.8
Other Expenses 3,592.8 4,456.6 7,226.8 4,500.0 4,500.0 4,500.0 4,500.0 4,500.0 4,500.0
Net Income / Change in Fund Balances 1,983.6 2,419.1 (2,293.3) 1,295.2 (10,117.3) 4,012.4 5,252.7 11,416.7 5,952.8
Beginning Fund Balance 17,898.3 19,881.9 22,301.0 20,007.6 21,302.9 11,185.6 15,198.0 20,450.7 31,867.4
Ending Fund Balance 19,881.9 22,301.0 20,007.6 21,302.9 11,185.6 15,198.0 20,450.7 31,867.4 37,820.2
Weighted Average Cost of Capital 2.82%
Terminal Growth Rate 0.00%
Terminal Value of Free Cash Flows 211,407.8
Free Cash Flows to the Fund (10,117.3) 4,012.4 5,252.7 11,416.7 5,952.8
Present Value of Terminal Value 184,001.5
Present Value of Future Fund Flows 14,185.9
Net Present Value of All Future Fund Flows 198,187.4
Net Present Value of General Fund 219,490.3
Nonproperty Tax Items Growth Rate - 8.0% 6.5% (6.4%) (14.6%) 38.3% 2.7% 2.7% 2.7%
Economic Assistance And Opportunity Growth Rate - 8.5% (100.0%) - 7151.1% (97.5%) 0.0% 0.0% 0.0%
13. 13
III. City of Binghamton Debt Obligations
The BadaBING BadaBROOME Policy
An Economic Equity Proposal for Binghamton, New York
(Numbers in thousands of $USD)
Description Date of Issue Interest Maturity Date Outstanding Contribution Weighted Interest Rate
Water Projects 2000 4.6% 2022 3,115.0 2.5% 0.11%
Combined Sewer Overflow 2003 4.5% 2031 3,040.0 2.4% 0.11%
Wastewater Projects 2005 3.0% 2034 11,825.0 9.4% 0.28%
Wastewater Projects 2010 4.1% 2039 3,905.0 3.1% 0.13%
Refunding Bonds 2012 3.0% 2026 8,130.0 6.5% 0.19%
Various Projects 2012 2.0% 2029 6,818.7 5.4% 0.11%
Various Projects 2012 2.0% 2029 2,486.3 2.0% 0.04%
General Capital Improvements 2014 3.8% 2034 3,827.2 3.1% 0.12%
Water and Sewer Improvements 2014 3.8% 2034 4,622.8 3.7% 0.14%
Refunding Bonds 2014 2.6% 2029 14,625.0 11.7% 0.30%
Refunding Bonds 2014 3.9% 2029 825.0 0.7% 0.03%
Various Projects 2015 3.0% 2040 11,145.0 8.9% 0.27%
EFC Financing 2016 2.1% 2046 27,500.0 21.9% 0.46%
Public Improvement 2016 2.5% 2036 9,095.0 7.2% 0.18%
Public Improvement 2018 3.0% 2043 14,510.7 11.6% 0.35%
Total 125,470.7 2.82%
IV. Entrepreneurship Program Cost Analysis
(Numbers in $USD)
Microloan Amount 14,735
Percent of Adults who are Entrepreneurs 15.6%
Expected Entrepreneurship Program Adoption 50.0%
Number of Microloans Issued 332
Total Microloan Amount 4,887,837
Interest Rate (3-Year Payback Period) 7.50%
Total Interest 366,588
Total Payback 5,254,425
Cost of Speakers 10,000
Number of Speakers 6
Total Annual Cost of Speakers 60,000
Cost of Small Business Consultants 45,000
Number of Consultants 2
Total Annual Cost of Consultants 90,000
Total Annual Costs 150,000
14. 14
The BadaBING BadaBROOME Policy
An Economic Equity Proposal for Binghamton, New York
VII. Tax Revenue Analysis
Binghamton Population 43,843
Unemployment Rate 9.7%
Unemployed Population 4,253
Trade School Program Adoption 50.0%
Unemployed Population Utilizing Trade Schools 2,126
Average Entry Level Wage from Trade Schools 34,417
Total New Salary Gained in Binghamton 73,183,590
Average Percentage of Salary Used 75.0%
Average Amount of Salary Spent 54,909,647
Effective Tax Rate 4.0%
Taxes Contributed to City 2,196,386
(Numbers in $USD except employment figures)
Program NewYork State Occupation Equivalent Entry Level Wage
Building Maintenance Building and Grounds Cleaning and Maintenance Occupations 26,500
Certified Sterile Processing Technician Surgical Technologists 42,130
Certified Nurse Aide Home Health & Personal Care Aides 25,620
Cosmetology Hairdressers, Hairstylists, and Cosmetologists 25,160
OSHA Healthcare Support Workers, All Other 29,090
Phlebotomy Phlebotomists 32,760
Practical Nursing Licensed Practical and Licensed Vocational Nurses 40,270
Residential Electricity Electricians 46,050
Teacher Aide 101 Teaching Assistants, Postsecondary 26,940
Welding Welding, Soldering, and Brazing Machine Setters, Operators, and Tenders 30,400
VI. Average Entry Level Wages
V. Grant Program Cost Analysis
(Numbers in $USD)
Program Tuition 10-Year Replacement Demand Demand Contribution Weighted Distribution
Building Maintenance 2,660 33 3.52% 299,901.3
Certified Sterile Processing Technician 1,349 21 2.24% 190,846.3
Certified Nurse Aide 2,275 268 28.57% 2,435,562.0
Cosmetology 8,980 146 15.57% 1,326,836.0
OSHA 100 24 2.56% 218,110.0
Phlebotomy 980 11 1.17% 99,967.1
Practical Nursing 18,105 131 13.97% 1,190,517.2
Residential Electricity 2,750 56 5.97% 508,923.4
Teacher Aide 101 0 220 23.45% 1,999,341.9
Welding 2,890 28 2.99% 254,461.7
Total 40,089 938 100.00% 8,524,466.8
Unemployed Population 2,126
Number of Programs 10
Approximate Number of People Per Program 213
15. 15
VIII. Binghamton Labor Force Data
The BadaBING BadaBROOME Policy
An Economic Equity Proposal for Binghamton, New York
(Numbers in thousands) Historical (Period Ending April 30th)
2016 2017 2018 2019 2020
Mining, Logging, and Construction 3.8 3.9 3.7 4.0 2.3
Manufacturing 11.5 11.2 11.3 11.2 10.2
Trade, Transportation, and Utilities 19.1 18.6 18.8 18.6 16.4
Information 1.6 1.5 1.5 1.5 1.3
Financial Activities 3.5 3.6 3.5 3.7 3.5
Professional and Business Services 9.2 9.1 9.0 9.0 7.8
Education and Health Services 16.8 17.2 17.2 17.4 16.0
Leisure and Hospitality 10.4 10.1 10.9 10.7 5.6
Other Services 5.3 5.4 5.4 5.4 4.4
Government 22.4 22.6 22.6 22.6 21.4
Total Nonfarm Jobs 103.6 103.2 103.9 104.1 88.9
Percent Change Year over Year - (0.39%) 0.68% 0.19% (14.60%)
Contribution to Total Jobs Breakdown
Mining, Logging, and Construction 3.67% 3.78% 3.56% 3.84% 2.59%
Manufacturing 11.10% 10.85% 10.88% 10.76% 11.47%
Trade, Transportation, and Utilities 18.44% 18.02% 18.09% 17.87% 18.45%
Information 1.54% 1.45% 1.44% 1.44% 1.46%
Financial Activities 3.38% 3.49% 3.37% 3.55% 3.94%
Professional and Business Services 8.88% 8.82% 8.66% 8.65% 8.77%
Education and Health Services 16.22% 16.67% 16.55% 16.71% 18.00%
Leisure and Hospitality 10.04% 9.79% 10.49% 10.28% 6.30%
Other Services 5.12% 5.23% 5.20% 5.19% 4.95%
Government 21.62% 21.90% 21.75% 21.71% 24.07%
Total 100.00% 100.00% 100.00% 100.00% 100.00%
IX. Binghamton Historical Unemployment Rate
Date
Unemployment
Rate
Date
Unemployment
Rate
Date
Unemployment
Rate
Date
Unemployment
Rate
Date
Unemployment
Rate
Date
Unemployment
Rate
01/10 8.7% 01/11 8.4% 01/12 8.5% 01/13 8.1% 01/14 6.9% 01/15 6.1%
02/10 8.7% 02/11 8.4% 02/12 8.5% 02/13 8.0% 02/14 6.8% 02/15 6.1%
03/10 8.7% 03/11 8.3% 03/12 8.5% 03/13 7.9% 03/14 6.7% 03/15 6.1%
04/10 8.6% 04/11 8.2% 04/12 8.6% 04/13 7.8% 04/14 6.6% 04/15 6.1%
05/10 8.5% 05/11 8.2% 05/12 8.7% 05/13 7.7% 05/14 6.6% 05/15 6.1%
06/10 8.5% 06/11 8.3% 06/12 8.7% 06/13 7.7% 06/14 6.6% 06/15 6.0%
07/10 8.4% 07/11 8.4% 07/12 8.7% 07/13 7.6% 07/14 6.5% 07/15 6.0%
08/10 8.4% 08/11 8.5% 08/12 8.7% 08/13 7.6% 08/14 6.5% 08/15 5.8%
09/10 8.4% 09/11 8.6% 09/12 8.6% 09/13 7.5% 09/14 6.4% 09/15 5.7%
10/10 8.5% 10/11 8.6% 10/12 8.4% 10/13 7.4% 10/14 6.3% 10/15 5.6%
11/10 8.5% 11/11 8.6% 11/12 8.3% 11/13 7.2% 11/14 6.2% 11/15 5.5%
12/10 8.5% 12/11 8.6% 12/12 8.2% 12/13 7.1% 12/14 6.1% 12/15 5.4%
Date
Unemployment
Rate
Date
Unemployment
Rate
Date
Unemployment
Rate
Date
Unemployment
Rate
Date
Unemployment
Rate
01/16 5.3% 01/17 5.4% 01/18 5.4% 01/19 4.4% 01/20 4.7%
02/16 5.3% 02/17 5.4% 02/18 5.3% 02/19 4.4% 02/20 4.6%
03/16 5.2% 03/17 5.4% 03/18 5.2% 03/19 4.4% 03/20 5.0%
04/16 5.3% 04/17 5.5% 04/18 5.0% 04/19 4.5% 04/20 15.5%
05/16 5.3% 05/17 5.5% 05/18 4.9% 05/19 4.5% 05/20 11.1%
06/16 5.4% 06/17 5.5% 06/18 4.7% 06/19 4.6% 06/20 11.3%
07/16 5.4% 07/17 5.5% 07/18 4.6% 07/19 4.7% 07/20 12.5%
08/16 5.5% 08/17 5.5% 08/18 4.5% 08/19 4.7% 08/20 9.7%
09/16 5.5% 09/17 5.5% 09/18 4.4% 09/19 4.8%
10/16 5.5% 10/17 5.4% 10/18 4.4% 10/19 4.8%
11/16 5.5% 11/17 5.4% 11/18 4.4% 11/19 4.8%
12/16 5.4% 12/17 5.4% 12/18 4.4% 12/19 4.8%
16. 16
The BadaBING BadaBROOME Policy
An Economic Equity Proposal for Binghamton, New York
XI. New Jobs Analysis
(Numbers in $USD)
Binghamton Population 43,843
Unemployment Rate 9.7%
Unemployed Population 4,253
New Jobs Created 2,458
New Unemployed Population 1,795
New Unemployment Rate 4.1%
Binghamton Population 43,843
Poverty Rate 33.2%
Impoverished Population 14,569
Poverty Line 26,200
Average Salary of New Jobs 32,492
Average Amount Over Poverty Line 6,292
New People Earning Above Poverty Line 2,458
New Impoverished Population 12,111
New Poverty Rate 27.6%
X. Binghamton Historical Population
Year Population Growth Growth Rate
2010 47,349 (31) (0.0%)
2011 46,986 (363) (0.8%)
2012 46,754 (232) (0.5%)
2013 46,508 (246) (0.5%)
2014 46,279 (229) (0.5%)
2015 45,907 (372) (0.8%)
2016 45,491 (416) (0.9%)
2017 45,020 (471) (1.0%)
2018 44,785 (235) (0.5%)
2019 44,314 (471) (1.1%)
2020 43,843 (471) (1.1%)
17. 17
XII. Binghamton Income Breakdown
The BadaBING BadaBROOME Policy
An Economic Equity Proposal for Binghamton, New York
(Numbers in $USD) Households Families Married-couple Families Nonfamily Households
Estimate Margin of Error Estimate Margin of Error Estimate Margin of Error Estimate Margin of Error
Less than $10,000 13.6% 1.4% 10.1% 2.1% 3.5% 1.5% 17.7% 2.5%
$10,000 to $14,999 10.4% 1.4% 6.5% 1.6% 3.8% 1.8% 14.5% 2.0%
$15,000 to $24,999 17.2% 1.7% 14.4% 2.5% 7.2% 2.7% 21.1% 2.9%
$25,000 to $34,999 11.2% 1.3% 10.0% 2.1% 8.0% 2.2% 11.9% 2.1%
$35,000 to $49,999 12.5% 1.5% 14.1% 2.5% 12.5% 3.1% 10.9% 1.8%
$50,000 to $74,999 15.5% 1.5% 15.8% 2.7% 20.1% 4.0% 13.9% 2.0%
$75,000 to $99,999 8.9% 1.3% 12.7% 2.5% 18.8% 4.1% 4.9% 1.4%
$100,000 to $149,999 7.2% 1.0% 11.0% 1.9% 17.7% 3.3% 3.6% 1.0%
$150,000 to $199,999 1.6% 0.5% 3.1% 1.2% 4.4% 1.5% 0.4% 0.4%
$200,000 or more 2.0% 0.6% 2.5% 1.1% 4.2% 1.9% 1.1% 0.6%
Median Income 31,905.0 2,131.0 44,787.0 4,374.0 69,825.0 5,840.0 22,670.0 2,063.0
Mean Income 49,798.0 2,692.0 60,797.0 4,486.0 82,284.0 7,209.0 38,064.0 3,776.0
XIII. Average U.S. Income Spend Breakdown
(Numbers in $USD) Percent of Income Spent
Food 10.5%
Housing 27.0%
Transportation 13.0%
Healthcare 6.7%
Personal Insurance 9.2%
Retirement 8.6%
Total 75.0%
XIII. Binghamton Historical Gross Domestic Product
(Numbers in thousands of $USD)
Year Total GDP Growth Rate
2001 7,172.1 -
2002 7,183.2 0.15%
2003 7,168.8 (0.20%)
2004 7,315.3 2.04%
2005 7,623.5 4.21%
2006 8,356.3 9.61%
2007 8,875.2 6.21%
2008 9,374.3 5.62%
2009 9,711.5 3.60%
2010 10,200.2 5.03%
2011 10,286.1 0.84%
2012 10,714.0 4.16%
2013 10,722.4 0.08%
2014 10,800.7 0.73%
2015 11,107.7 2.84%
2016 11,255.5 1.33%
2017 11,622.6 3.26%
2018 11,951.1 2.83%
2019 12,213.9 2.20%
3-Year Average 2.76%
18. 18
XV. Works Cited
The BadaBING BadaBROOME Policy
An Economic Equity Proposal for Binghamton, New York
• (n.d.). Retrieved October 25, 2020, from https://ope.ed.gov/dapip/
• (n.d.). Retrieved October 25, 2020, from https://www.dcmoboces.com/CareerTechnical Education.aspx
• Adult Catalog & Application 2020-2021.pdf. (n.d.). Retrieved October 25, 2020, from
https://drive.google.com/file/d/103PvBorSqWfDKPHrqP-wlpHHRKAjxtVc/view
• Advocacy, O. (n.d.). Small Businesses Generate 44 Percent of U.S. Economic Activity. Retrieved October 25, 2020,
from https://advocacy.sba.gov/2019/01/30/small-businesses-generate -44-percent-of-u-s-economic-activity/
• Binghamton, New York (NY) Poverty Rate DataInformation about poor and low-income residents (n.d.). Retrieved
October 25, 2020, from http://www.city-data.com/poverty/ poverty-Binghamton-New-York.html
• Binghamton, New York Population 2020. (n.d.). Retrieved October 25, 2020, from
https://worldpopulationreview.com/us-cities/binghamton-ny-population
• BingTech Ventures: Koffman Southern Tier Incubator: Binghamton, NY. (2019, September 24). Retrieved October 25,
2020, from https://southerntierincubator.com/bingtech-ventures/
• BROOME COUNTY WORKFORCE DEVELOPMENT PLAN 2017-2020. Susan M Payne. Retrieved from
https://www.theagency-ny.com/
• Broome Tioga Boces. (n.d.). Retrieved October 25, 2020, from https://www.btboces.org/AdultEducation.aspx
?fbclid=IwAR2TQutfvdtAuSvovrgEyyOQdz3UOykQ7RmF1l9hdSOBry IOk6GWbgHG4
• CARES ACT DELIVERS OVER $112B TO NY. (2020, April 11). Retrieved October 25, 2020, from
https://meng.house.gov/media-center/in-the-news/cares-act-delivers-over -112b-to-ny
• City of Binghamton, New York. (2016). Retrieved 25 October 2020, from http://www.binghamton-
ny.gov/sites/default/files/documents/files/2016%2012.31%20Financial%20Report%20City%20of%20Binghamton.pdf
• City Of Binghamton, New York. (2018). 2018 Annual Report. http://www.binghamton-ny.gov/
• Clark, D. (2020, October 24). How Much Should You Charge for a Speech? Retrieved October 25, 2020, from
https://hbr.org/2018/05/how-much-should-you-charge-for-a-speech
• College, B. (2019, December 06). More Than 31 Million People in the United States (15.6% of
• the Adult Population Ages 18-64) Are Engaged in Early Stage Entrepreneurial Activity, According to the 2018/2019
United States GEM Report Produced by Babson College. Retrieved October 25, 2020, from
https://www.prnewswire.com/news-releases/more-than-31-million-people-in-the-united-states-15-6-of-the-adult-
population-ages-18-64-are-engaged-in-early-stage-entrepreneurial-activity-according-to-the-20182019-united-states-
gem-report-produced-by-babson-college-300970674.html
• Department of Labor. (n.d.). Retrieved October 25, 2020, from https://labor.ny.gov/stats/lswage2
.asp?fbclid=IwAR0N5CciU5mYudoVWNnVrYJbwaQdEd9VRbvBs-N67IlZzbVnt2 cwI7U-9U0
• Membership: Expand your professional network. Join a community of 800+ members. (2020, March 05). Retrieved
October 25, 2020, from https://greaterbinghamtonchamber.com/ membership/
• Office of The New York State Comptroller [PDF File]. Coronavirus Aid, Relief and Economic Security (CARES) Act
Information. Retrieved from Other Financial Business; Corporate Bonds Held by COVID-19 Corporate Credit
Facilities (CCF); Asset, Level. (2020, September 29). Retrieved October 25, 2020, from
https://fred.stlouisfed.org/series/BOGZ1FL503063015Q
• Payne, S. (2017). Broome County Workforce Development Plan 2017-2020. Retrieved 25 October 2020, from
https://www.theagency-ny.com/documents/BROOME-TASKFORCE-REPORT.pdf
• Poverty Guidelines. (2020, March 05). Retrieved October 25, 2020, from https://aspe.hhs.gov/poverty-guidelines
• Small Business Administration Microloan Program [PDF File]. Congressional Research Service. Retrieved from
https://crsreports.congress.gov
• Suny. (n.d.). NYSUNY 2020 Challenge Grants. Retrieved October 25, 2020, from
https://www.suny.edu/impact/business/nysuny-2020/
• Total Gross Domestic Product for Binghamton, NY (MSA). (2019, December 12). Retrieved October 25, 2020, from
https://fred.stlouisfed.org/series/NGMP13780
• Trade School Student Loans. (n.d.). Retrieved October 25, 2020, from
http://www.collegescholarships.org/loans/trade.htm
• Unemployment Rate in Binghamton, NY (MSA). (2020, September 30). Retrieved October 25, 2020, from
https://fred.stlouisfed.org/series/BING736UR
• U.S. Census Bureau QuickFacts: Binghamton city, New York. (n.d.). Retrieved October 25, 2020, from
https://www.census.gov/quickfacts/binghamtoncitynewyork
• Why You Should Consider Trade School Instead of College. (2019, January 24). Retrieved October 25, 2020, from
https://www.thesimpledollar.com/investing/college/why-you-should-consider-trade-school-instead-of-college/
• Writers, S. (2020, April 29). The Value of Trade Schools: BestColleges. Retrieved October 25, 2020, from
https://www.bestcolleges.com/blog/the-value-of-trade-schools/?fbclid=
IwAR0jxcAPNAVnv6nFe7gzSyljQtG4SEde8nCWut_sr3uvq4PM71f5WS0QvSg