SlideShare a Scribd company logo
1 of 15
Download to read offline
Alexander Lai
Equity Research Extern
(718) 962-4212
alai5@binghamton.edu
Jefferies LLC
USA | Consumer | Cosmetics, Household & Personal Care
Equity Analysis
COMPANY NOTE
May 4, 2020
The Estée Lauder Companies Inc. (EL)
Beauty is in the Eye of the BeBUYer; Valuation,
Analyses, and Survey Data Inform Our View
Key Takeaway
We place a Buy rating on EL with a $192 PT. EL is an industry
leader in the beauty space with a portfolio of 25+ well-known
brands selling skin care, makeup, fragrance, and hair care products
across the Americas, Europe, the Middle East, Africa, and the
Asia/Pacific Region. Our valuation, survey, and analyses of
company initiatives reflect a positive outlook for EL. At a potential
11% upside despite an ongoing pandemic, we’d add EL to our
portfolio.
Equity Valuation: Our $192 PT is based on two discounted cash flow
analyses and a residual earnings analysis. Implied prices of $176.98 (DCF
IS/BS), $179.48 (DCF CF), and $219.76 (RE) were calculated and were all
weighted equally to one another for a final price target.
Strategic Catalysts: Sales growth in the Asia/Pacific Region, EL’s focus
on digital channels and its outpacing of global e-commerce growth, and
the success of EL’s skin care product category.
Gen Z Beauty Survey Takeaways:
(i) EL may be able to improve its reach with a Gen Z audience
(ii) Skin care was the most popular product category for this sample size
(iii) Gen Z customers purchase beauty products based on quality and
brand name above all, but are open to sampling new products
(iv) Due to the effects of the COVID-19 pandemic, Gen Z consumers
are spending less on beauty products
Key Risks: COVID-19’s effect on traditional retail sales, loss of EL’s
signature High-Touch factor, and Macy’s planned store closures.
BUY
Price Target: $192.00
Current Price: $172.54
Price Performance
Financial Summary 0.7
Book Value (MM): $4,386
Net Debt (MM): $4,514
Net Debt/Capital: 38.0%
Long-Term Debt (MM) $2,896
Dividend Yield: 1.11%
Cash & ST Invest. (MM) $2,987
Market Data
52 Week Range: $137.01 - $220.42
Total Entprs. Value (MM): $66,628.2
Market Cap. (MM): $62,114.2
Inside Ownership: 0.21%
Institutional Ownership: 34.49%
Shares Out. (MM): 360.0
Float (MM): 218.4
Avg. Daily Vol.: 2,563,992
(in MM except Per Share) FY2015 FY2016 FY2017 FY2018 FY2019
Revenue 10,780$ 11,262$ 11,824$ 13,683$ 14,863$
Revenue Growth -1.72% 4.47% 4.99% 15.72% 8.62%
Earnings per Share 2.87$ 3.01$ 3.40$ 3.01$ 4.91$
EPS Growth -8.01% 4.88% 12.96% -11.47% 63.12%
EL
May 4, 2020
Equity Analysis
Alexander Lai, Equity Research Extern, (718) 962-4212, alai5@binghamton.eduPage 2 of 15
Table of Contents
COMPANY BACKGROUND.................................................................. 3
Business Description............................................................................ 3
INDUSTRY ANALYSIS............................................................................ 4
Beauty Market........................................................................................ 4
Market Trends........................................................................................ 4
VALUATION METHODOLOGY......................................................... 5
Valuation Summary............................................................................... 5
Weighted Average Cost of Capital..................................................... 5
Discounted Cash Flow Analysis......................................................... 6
Residual Earnings Analysis.................................................................. 7
SUPPORTING CATALYSTS................................................................... 8
Asia/Pacific Region Growth............................................................... 8
Digital Focus.......................................................................................... 8
Perseverance of Skin Care................................................................... 8
GEN Z BEAUTY SURVEY...................................................................... 9
Survey Results........................................................................................ 9
BUSINESS RISKS....................................................................................... 10
COVID-19 Slowing Retail Sales......................................................... 10
Losing the High-Touch Factor........................................................... 10
Macy’s Store Closures.......................................................................... 10
BOARD OF DIRECTORS....................................................................... 11
Board Composition.............................................................................. 11
CORPORATE GOVERNANCE............................................................ 12
ISS Governance Quality Score Analysis.............................................12
CONCLUDING THOUGHTS............................................................... 12
APPENDICES..................................................................................................
3
3
4
4
4
5
5
5
6
7
8
8
8
8
9
9
10
10
10
10
11
11
12
12
12
13
EL
May 4, 2020
Equity Analysis
Alexander Lai, Equity Research Extern, (718) 962-4212, alai5@binghamton.eduPage 3 of 15
Company Background
Business Description:
The Estée Lauder Companies Inc. is one of the world’s leading
manufacturers and marketers of quality skin care, makeup, fragrance,
and hair care products – see Chart 1. The company’s products are sold
in approximately 150 countries and territories under a number of
brand names including Estée Lauder, Clinique, Origins, M.A.C., Bobbi
Brown, Jo Malone London, and Too Faced – see Charts 2 and 3. They
are also the global licensee for fragrances, cosmetics, and/or related
products sold under various designer brand names, such as Tommy
Hilfiger, Donna Karan, Michael Kors, Tom Ford, and Coach.
The company sells their prestige products principally through limited
distribution channels to complement the images associated with their
brands. These channels consist primarily of department stores,
specialty-multi retailers, upscale perfumeries and pharmacies and
prestige salons and spas. In addition, these products are sold in the
Company’s own and authorized freestanding stores, their own and
authorized retailer websites, third-party online malls, stores in airports
and on cruise ships, in-flight, and duty-free shops.
Chart 3: Brand Map
Classic
Premium
Progressive
Entry Price Point
Source: Company Reports
Chart 2: Net Sales by
Region
Source: Company Reports
Chart 1: Net Sales by
Product Category
Source: Company Reports
Table 1: Key Information
Source: Company Reports
Year Founded 1946
Headquarters New York, NY
Employee Count 48,000
EL
May 4, 2020
Equity Analysis
Alexander Lai, Equity Research Extern, (718) 962-4212, alai5@binghamton.eduPage 4 of 15
Industry Analysis
Beauty Market:
Beauty is currently a $500B+ industry and in the next five years is
expected to grow at a 5-7% CAGR to exceed $800B by 2025. The
beauty industry falls within the consumer staples sector, which is less
sensitive to economic cycles. Macroeconomics factors that drive the
consumer staples industry are employment, consumer confidence,
inflation rates, and commodity costs, however, the sensitivity of this
industry to these factors is relatively low compared to other industries.
The main products sold by companies in this space relate to hair care,
skin care, cosmetics, fragrance, personal products, and ancillary
products. Hair care and skin care alone make up over half of the
revenue in the industry at 61% market share while other categories take
less than 20% each of overall market share. – see Chart 4.
Industry peers include players such as Coty, Johnson & Johnson, Nu
Skin, P&G, Revlon, Sally Beauty, and Ultra, among others - see Chart 5.
Market Trends:
There is a growing trend in recent years of beauty companies shifting
away from wholesale selling to more direct-to-consumer channels. This
allows companies to own the entire customer experience and cut out
the middle man, allowing them to understand their target audience
more deeply as well as reap high profit margins. Influencer marketing is
also becoming more prevalent, with companies choosing to employ
brand ambassadors instead of utilizing traditional advertising.
Modern consumers are educating themselves on products and demand
quality and transparency from companies. Recent initiatives such as the
Personal Care Products Safety Act of 2019 work to regulate ingredients
in beauty products, causing companies to be more conscious of
consumer health while conducting research and development efforts.
Chart 5: Industry Peers
Source: Statista
Chart 4: Market Share by
Product Category
Comparable Companies
(as of 6/30/19)
Company Ticker
Market
Cap (BN)
Net Debt
(BN)
Enterprise
Value (BN)
Share
Price
Revenue
(MN)
EBITDA
(MN)
Net Income
(MN) EPS
Stockholder's
Equity (MN)
Outstanding
Shares (MN)
Book
Value
Coty Inc. COTY 10$ 7$ 2$ 12.95$ 8,649$ (2,736)$ (3,784)$ 0.65 4,587$ 751 6.11$
Johnson & Johnson JNJ 361$ 28$ 333$ 136.42$ 82,059$ 25,012$ 15,119$ 5.72 59,471$ 2,645 22.48$
Nu Skin Enterprises Inc. NUS 3$ 0$ 2$ 47.69$ 2,420$ 344$ 174$ 3.13 875$ 56 15.77$
Procter & Gamble Co. PG 269$ 46$ 223$ 107.61$ 67,684$ 8,311$ 3,897$ 1.45 47,479$ 2,504 18.96$
Revlon Inc. REV 1$ 4$ (3)$ 19.33$ 2,420$ 147$ (171)$ -3.11 (1,221)$ 53 (23.01)$
Sally Beauty Holdings Inc. SBH 2$ 2$ (0)$ 13.34$ 3,876$ 566$ 272$ 2.27 (60,323)$ 120 (504.22)$
Ulta Beauty Inc. ULTA 20$ 1$ 19$ 346.89$ 7,398$ 1,134$ 706$ 12.21 1,902$ 58 32.89$
Source: Company Reports
EL
May 4, 2020
Equity Analysis
Alexander Lai, Equity Research Extern, (718) 962-4212, alai5@binghamton.eduPage 5 of 15
Valuation Methodology
Valuation Summary:
Our price target of $192 is based off of three valuation models; a
discounted cash flow analysis based on the income statement and the
balance sheet, a discounted cash flow based on the cash flow
statement, and a residual earnings analysis. All three methods were
weighted equally to come to a price target – see Charts 6 and 7.
Chart 8: Weighted Average Cost of Capital Breakdown
Weighted Average Cost of Capital:
To arrive at a discount rate for the analyses, a weighted average coast of
capital (WACC) had to be found. The cost of equity was calculated
using the Capital Asset Pricing Model using both an industry beta and a
regression analysis on the market. The cost of debt was calculated
based on current borrowings, the yield to maturity method, the actual
rating, and a synthetic rating. 7.88% was arrived at for the cost of
equity, 4.06% was arrived at for the cost of debt, and based on these
inputs, a WACC rate of 7.56% was arrived at – see Chart 8.
Chart 6: Valuation Ranges Chart 7: Valuation Ranges Breakdown
Current Price: $172.54 Price Target: $192.00
Source: Company Reports, Jefferies Source: Company Reports, Jefferies
Debt
Market Value of Debt (MM) $2,896
Weight of Debt 6.72%
Cost of Debt 4.06%
Equity
Market Value of Equity (MM) $40,220
Weight of Equity 93.28%
Cost of Equity 7.88%
Weighted Average Cost of Capital
Beta 0.76
Risk-Free Rate of Return 4.88%
Market Risk Premium 4.83%
Tax Rate 22.24%
WACC 7.56%
Source: Company Reports, Jefferies
Low Q1 Median Q3 High
Residual
Earnings
$174.75 $194.35 $220.33 $254.01 $302.76
Discounted
Cash Flow
(IS/BS)
$121.80 $144.84 $176.98 $224.95 $304.27
Discounted
Cash Flow
(CF)
$123.58 $146.91 $179.48 $228.08 $308.44
52 Week Range $137.01 $175.62 $188.12 $197.42 $220.42
EL
May 4, 2020
Equity Analysis
Alexander Lai, Equity Research Extern, (718) 962-4212, alai5@binghamton.eduPage 6 of 15
Discounted Cash Flow Analysis:
The discounted cash flow (DCF) analysis was chosen because EL has
relatively stable cash flows that have had an upward trend over the last
decade. Two methods were used to determine EL’s free cash flows; one
drawing from the income statement and the balance sheet and the
other drawing from the cash flow statement. A WACC of 7.56% was
used as a discount rate. A perpetual growth rate of 2.5% was used as a
conservative estimate of the company’s growth, mirroring the growth
of U.S. GDP in recent years. Values of $176.95 and $179.45 were
obtained using the income statement/balance sheet method and the
cash flow statement method, respectively – see Charts 9 and 11.
Chart 11: DCF (CF) Breakdown Chart 12: DCF (CF) Sensitivity Analysis
Source: Company Reports, Jefferies
Cash Flow Statement Method
(in MM except Per Share) FY2017 FY2018 FY2019
Reported Cash Flow From Operations 1,790$ 2,562$ 2,517$
After Tax Net Interest Payment 49$ 41$ 57$
Cash Flow From Operations 1,839$ 2,603$ 2,574$
Capital Expenditures (504)$ (629)$ (744)$
Payments for Acquired Businesses (1,671)$ -$ -$
Proceeds from Sales of Investments 1,226$ 749$ 1,229$
Purchase of Investments (1,267)$ (478)$ (14)$
Cash Investment in Operations (2,216)$ (358)$ 471$
Free Cash Flow 4,055$ 2,961$ 2,103$
WACC= 7.56%
g= 2.50%
Total Firm Value 42,596$
Net Debt 2,896$
Intrinsic Value of Equity 39,700$
Shares Outstanding 221.22
Implied Share Price 179.48$
Source: Company Reports, Jefferies
6.56% 7.06% 7.56% 8.06% 8.56%
1.50% $177.60 $160.45 $146.13 $133.99 $123.58
2.00% $199.55 $178.54 $161.30 $146.91 $134.72
2.50% $226.91 $200.59 $179.48 $162.16 $147.70
3.00% $261.95 $228.08 $201.63 $180.42 $163.01
3.50% $308.44 $263.28 $229.25 $202.68 $181.35
PerpetualGrowth
Weighted Average Cost of Capital
Source: Company Reports, Jefferies
Chart 9: DCF (IS/BS) Breakdown
Income Statement & Balance Sheet Method
(in MM except Per Share) FY2017 FY2018 FY2019
EBIT 1,704$ 2,055$ 2,313$
Marginal Tax Rate 27.90% 43.60% 22.20%
NOPAT 1,229$ 1,159$ 1,800$
Deprecation and Amortization 464$ 531$ 557$
Capital Expenditure (2,216)$ (358)$ 471$
Net Working Capital 96$ (263)$ (190)$
Free Cash Flow 3,813$ 2,311$ 2,076$
WACC = 7.56%
g= 2.50%
Total Firm Value 42,044$
Net Debt 2,896$
Intrinsic Value of Equity 39,148$
Shares Outstanding 221.22
Implied Share Price 176.98$
Chart 10: DCF (IS/BS) Sensitivity Analysis
Source: Company Reports, Jefferies
6.56% 7.06% 7.56% 8.06% 8.56%
1.50% $175.12 $158.20 $144.06 $132.09 $121.80
2.00% $196.79 $176.05 $159.04 $144.84 $132.80
2.50% $223.79 $197.82 $176.98 $159.89 $145.61
3.00% $258.38 $224.95 $198.85 $177.91 $160.73
3.50% $304.27 $259.70 $226.10 $199.88 $178.83
PerpetualGrowth
Weighted Average Cost of Capital
EL
May 4, 2020
Equity Analysis
Alexander Lai, Equity Research Extern, (718) 962-4212, alai5@binghamton.eduPage 7 of 15
Residual Earnings Analysis:
The residual earnings analysis was chosen because EL is projected to
consistently produce excess cash in future years. A 7.88% cost of
equity was used as the discount rate. A earnings per share growth rate
of 8.66% was used based off analyst estimates. A perpetual growth rate
of residual earnings was predicted to be 6.54%. A value of $219.76 was
obtained using this analysis – see Chart 13.
Chart 13: Residual Earnings Analysis Breakdown
Source: Company Reports, Jefferies
Residual Earnings Analysis
FY2019 FY2020 FY2021 FY2022 FY2023 FY2024 FY2025 FY2026 FY2027 FY2028
Earnings per Share 4.91$ 4.61$ 5.43$ 5.90$ 6.41$ 6.97$ 7.57$ 8.23$ 8.94$ 9.71$
EPS Growth - -6.11% 17.79% 8.66% 8.66% 8.66% 8.66% 8.66% 8.66% 8.66%
Dividends per Share 1.67$ 1.85$ 2.04$ 2.26$ 2.50$ 2.77$ 3.07$ 3.39$ 3.75$ 4.15$
DPS Growth - 10.65% 10.65% 10.65% 10.65% 10.65% 10.65% 10.65% 10.65% 10.65%
Book Value per Share 19.94$ 22.70$ 26.09$ 29.72$ 33.63$ 37.83$ 42.33$ 47.17$ 52.35$ 57.91$
BPS Growth - 13.85% 14.91% 13.94% 13.15% 12.48% 11.91% 11.42% 10.99% 10.62%
Cost of Equity 7.88%
Book Value of Equity (MM) 4,411
Shares Outstanding (MM) 221
Required Earnings - 1.57$ 1.79$ 2.06$ 2.34$ 2.65$ 2.98$ 3.34$ 3.72$ 4.12$
Residual Earnings 4.91$ 3.04$ 3.64$ 3.85$ 4.07$ 4.32$ 4.59$ 4.89$ 5.22$ 5.59$
RE Growth - -38.10% 19.82% 5.59% 5.84% 6.08% 6.32% 6.55% 6.78% 7.00%
RE Growth after 2028 6.54%
Terminal Value 344.97$
PV of Residual Earnings $200.76
Implied Share Price $219.76
Chart 14: Residual Earnings Sensitivity Analysis
Source: Company Reports, Jefferies
7.68% 7.78% 7.88% 7.98% 8.08%
6.34% $225.74 $210.35 $196.95 $185.18 $174.75
6.44% $240.34 $222.73 $207.56 $194.35 $182.75
6.54% $257.50 $237.11 $219.76 $204.80 $191.78
6.64% $277.95 $254.01 $233.91 $216.81 $202.07
6.74% $302.76 $274.15 $250.56 $230.76 $213.90
ResidualEarningsGrowth
Cost of Equity
EL
May 4, 2020
Equity Analysis
Alexander Lai, Equity Research Extern, (718) 962-4212, alai5@binghamton.eduPage 8 of 15
Supporting Catalysts
Asia/Pacific Region Growth:
From Q1 to Q2, EL saw growth of 29% in the Asia/Pacific region
jumping from $1,020MM to $1,319MM. The greater China area had
double-digit net sales growth in part due to events such as Singles’ Day,
an unofficial holiday where consumers go on a shopping spree to
celebrate, similar to Black Friday in the U.S.
Tall is the world’s third most visited website and is a popular online
retailer in Asia. EL’s online sales on this platform saw a dramatic 135%
increase from March 2019 to March 2020 of 129MM RMB, beating out
other retailers, such as Lancôme, on the platform – see Chart 15.
Upcoming events such as Mother’s Day, Children’s Day, Father’s Day,
Youth Day, and Mall's Mid Year Sale in the coming months are
expected to generate spikes in sales.
Although historically this region produces less net sales than the
Americas, Europe, the Middle East, and Africa, changing consumer
habits in the region are contributing to this category’s growth.
Digital Focus:
EL noted that their online sales accelerated during February and March
as the effects of the COVID-19 virus spread across Europe and the
Americas. E-commerce represents ~30% of EL’s sales in top markets,
and EL’s CAGR for online sales is nearly 30% over the past 5 years,
outpacing the global e-commerce market CAGR of 21% in that same
time frame. EL expects to continue double-digit growth in e-commerce
and aims to double its online sales profit by 2023.
In FY2019, EL shifted its advertising budget so that 75% of it went
towards digital media, whereas beforehand, EL only spent 22% of its
spend on digital channels.
Perseverance of Skin Care:
EL’s skin care products generate the most revenue out of all it’s
product categories and, with the effects of the coronavirus pandemic,
skin care sales across the entire industry have been increasing.
According to NPD, skin care sales jumped 13% from January 2020 to
February 2020, and Nielsen states that skin care sales are up 2% from
March 2019 to March 2020. Historically, this category typically grows
faster than the overall cosmetics market as well – see Chart 16.
CEO Fabrizio Freda noted that “[c]consumers may cut back on buying
cosmetics and perfumes as they are quarantined at home, but they
continue to buy products that address their health and wellness while
locked inside”, and it seems the effects of the pandemic cause
consumers to purchase more than they usually would.
Chart 15: Tall Flagship
Sales (MM RMB)
Source: Alltech
Chart 16: Skin Care and
Cosmetics Market Growth
Source: L’Oréal
EL
May 4, 2020
Equity Analysis
Alexander Lai, Equity Research Extern, (718) 962-4212, alai5@binghamton.eduPage 9 of 15
Gen Z Beauty Survey
Survey Methodology: We surveyed 40 college students within the
United States from a public university in the upstate New York area
to gauge their shopping and usage patterns in regards to beauty
products as well as their brand preferences.
By age, 100% of them fell within the Generation Z category,
indicating that their ages were between 7-22 years old. By gender,
47.5% of responders noted they were male and 52.5% noted they
were female.
Survey Results
Our survey indicated that those in our sample size preferred EL over
popular companies such as Avon or Coty – see Chart 17. This may
indicate opportunities for EL to expand their core demographic. The
typical EL customer is aged 35-55, falling in the Millennial or Gen X
buckets, but developing products and marketing campaigns that appeal
to a younger Gen Z audience could improve EL’s market share.
Skin care was found to be the category with the top spend in our
sample size, showing that perhaps skin care’s growth as an overall
category is true for Gen Z as well and not just with EL’s target
consumers – see Chart 18.
The most important purchasing factor for our sample size was quality,
with brand being a close second – See Chart 19. This supports the
notion that Gen Z is highly knowledgeable when it comes to what they
buy and that they understand what goes into an item and support only
the brands they resonate with. However, 45% of our sample size noted
they were open to trying new brands or products they were unfamiliar
with – see Chart 20.
It seems that during the COVID-19 pandemic, our sample size spent
less on overall beauty products, most likely due to decrease in usage of
cosmetics – see Chart 21.
Chart 19: Beauty Product
Purchasing Factors
Chart 20: Willingness to Try
New Beauty Products
Chart 21: COVID-19 Pandemic
Beauty Purchasing Habits
Chart 17: Gen Z Beauty
Company Preferences
Source: Jefferies
Chart 18: Beauty Product
Spend by Category
Source: Jefferies
Source: Jefferies Source: Jefferies Source: Jefferies
EL
May 4, 2020
Equity Analysis
Alexander Lai, Equity Research Extern, (718) 962-4212, alai5@binghamton.eduPage 10 of 15
Business Risks
COVID-19 Slowing Retail Sales:
The effects of COVID-19 have slowed in-person retail sales
worldwide, and most physical stores across the world have been
temporarily shut down. With the ongoing pandemic, many major cities
with EL stores or third-party retailers in them have experienced a
decrease in foot traffic as a result – see Chart 22. Traditional retail sales
make up a large portion of the company’s revenue, and long-term
closures of stores could severely impact their top line.
EL’s retail stores remain shuttered in the Americas, Europe, the Middle
East, and Africa at the moment, however, EL has begun to reopen
stores in the Asia/Pacific region and are assessing when they can
reopen the remaining locations in accordance with the authorities.
Losing the High-Touch Factor:
EL is known for their signature High-Touch approach, where they aim
to create strong emotional bonds with their consumers through
personalized experiences. This concept was founded over 60 years ago
by the company’s founder, Estée Lauder, and manifests itself in stores
through expert advice given by beauty consultants on the sales floor.
Due to the pandemic, EL has lost its ability to connect with their target
audience in person and this may result in them losing sales from loyal
customers, but EL is attempting to change this through digital means.
EL continues to innovate digitally and aims to interact with their
consumers during this pandemic through online channels. Gary Chu,
an online general manager for EL mentioned that “[l]livestreaming was
something brand new [that they] tried” and that it “boomed during the
pandemic”. They are also heavily promoting products featured on their
e-commerce store through their social media accounts to help bolster
online sales.
Macy’s Store Closures:
One of EL’s largest retail partners is Macy’s, which in the past has
accounted for nearly 10% of the company’s overall revenue. Recently,
Macy’s has been struggling to stay afloat, and as a cost-cutting measure,
from now until 2023, Macy’s plans to shutter 125 stores, which is nearly
a fifth of its locations.
This plan by Macy’s may significantly impact EL’s revenues stemming
from department stores over the next three years. Macy’s locations are
currently closed due to the COVID-19 pandemic, so sales during this
period may look similar to 2023 sales when Macy’s completes this
initiative. However, in the next six to eight weeks, Macy’s plans to open
all 775 of its stores, which may help recoup some sales for EL.
Chart 22: Average Change
in Major City Foot Traffic
(5/4/20 – 5/11/20)
Source: The Economist
EL
May 4, 2020
Equity Analysis
Alexander Lai, Equity Research Extern, (718) 962-4212, alai5@binghamton.eduPage 11 of 15
Board of Directors
Chart 23: Board of Directors Breakdown
Source: Estée Lauder
Name Current Position Previous Roles Education Stock Ownership
Charlene
Barshefsky
Senior International
Partner at Wilmer
Hale
U.S. Trade Representative
Director at Intel and Starwood Hotels
University of Wisconsin-Madison:
Bachelor’s in English and Political
Science
The Catholic University of America: JD
61,411 shares
(.03%)
Rose Marie
Bravo, CBE
Retail and Marketing
Consultant
CEO at Burberry
President at Saks Fifth Avenue
Fordham University: Bachelor’s in
English
8,000 shares
Wei Sun
Christianson
MD & Co-CEO of
Asia Pacific and CEO
of China at Morgan
Stanley
Chairman of China at Citigroup
Amherst College: BA in Political Science
Columbia University: JD in International
Law
4,104 shares
Fabrizio
Freda
President and Chief
Executive Officer at
Estée Lauder
President at Proctor and Gamble
Strategic Planning at Gucci
University of Naples Federico II:
Economics and Business Administration
68,174 shares
(.03%)
Paul J.
Fribourg
Chairman and Chief
Executive Officer at
Continental Grain
Company
Director at Apollo Global Management,
Loews, and Restaurant Brands International
Amherst College: Bachelor’s in Business
Administration and Economics
4,000 shares
Irvine O.
Hockaday Jr.
CEO at Hallmark
CEO at Kansas City Southern Industries
Princeton University: AB in English
University of Michigan: JD
11,740 shares
(.01%)
Jennifer
Hyman
Co-Founder and
Chief Executive
Officer at Rent the
Runway
Director at IMG
Senior Manager at Starwood Hotels
Harvard University: BA in Social Studies
and MBA
2,000 shares
Leonard A.
Lauder
Chairman Emeritus at
Estée Lauder
Chief Executive Officer at Estée Lauder
Officer at U.S. Navy
University of Pennsylvania: Bachelor’s
Columbia University: Master’s
Jane Lauder
Global Brand
President at Clinique
Global President and General Manager of
Origins, Joon, and Dauphin Brands
Stanford University: Bachelor’s
Ronald S.
Lauder
Chairman at Clinique
Laboratories LLC
Deputy Assistant Secretary of Defense at
the U.S. Department of Defense
University of Pennsylvania: Bachelor’s in
International Business
6,364 Class A shares
9,409,895 Class B
Shares (6.86%)
William P.
Lauder
Executive Chairman
at Estée Lauder
CEO and COO at Estée Lauder
Marketing Director at Clinique
University of Pennsylvania: BS in
Economics and International Marketing
10,468 Class A shares
8,515,960 Class B
shares (6.21%)
Richard D.
Parsons
Senior Advisor at
Providence Equity
Partners LLC
Director and Chairman at Citigroup Albany Law School: JD 4,442 shares
Lynn
Forester de
Rothschild
Chair at E.L.
Rothschild LLC
Co-Chair of Field Fresh Foods
Pomona College
Columbia University
4,000 shares
Barry S.
Sternlicht
Chairman and Chief
Executive Officer at
Starwood Capital
Group
Director at Baccarat, Restoration Hardware,
Riviera Holdings, and TRI Pointe
Brown University
Harvard University: MBA
66,932 shares
(.03%)
Jennifer
Tejada
Chief Executive
Officer at PagerDuty
Inc.
President and CEO at Keynote Systems
EVP and CSO at Mincom
University of Michigan: BA in Business
Management and Organizational
Behavior
2,000 shares
Richard F.
Annino
Managing Director at
CCMP Capital
Advisors LLC
CEO at Dow Jones
EVP at Liz Claiborne
Bentley College: BS in Finance and
Economics
Pace University: MBA in Finance
EL
May 4, 2020
Equity Analysis
Alexander Lai, Equity Research Extern, (718) 962-4212, alai5@binghamton.eduPage 12 of 15
Board Composition:
EL’s Board of Directors has 16 members, five of which serve as
executives at EL – see Chart 23. Many of the board members come
from financial backgrounds, hailing from firms such as Morgan Stanley,
Providence Equity Partners, E.L. Rothschild, Starwood Capital Group,
and CCMP Capital Advisors. Most members of the Board of Directors
own a stake in the company, giving them incentive to help EL grow.
Corporate Governance
ISS Governance Quality Score Analysis:
EL has an overall ISS Governance Quality Score of 10, scoring a 10 for
both Shareholder Rights and Board, a 6 for Compensation, and a 1 for
Audit – see Table 2. This overall score is the highest score possible and
indicates that EL may have a high level of governance risk.
The Audit component earning the lowest score of 1 indicates a low risk
regarding the company’s audit policies.
The Board component earned the highest score of 10, indicating a
potential high risk in the board’s composition, practices, and policies.
One potential reason why a 10 was earned could be due the Board of
Directors having 16 members, when “[g]enterally, boards should not
have . . . more than 15 members” (Institutional Shareholder Services).
Another reason may be that the Board of Directors does not entirely
consist of members independent of the company, and five of the 16
members of the board hold leadership roles within the company.
The Shareholder Rights component earning the highest score of 10
indicates a potential high risk regarding shareholder voting practices.
One potential reason why a 10 was earned could be due to most of the
voting power stemming from Lauder-owned organizations.
The Compensation component earning a mid-to-high score of 6,
indicating a potential mid-to-high risk in the board’s compensation
practices. This may be due the overly high compensation for the CEO,
Fabrizio Freda. In 2019, Fabrizio’s compensation was ~$19M including
base salary, bonuses, and performance share units (PSUs) when it was
expected to be around 33% lower at around ~$14M based on
performance objectives including corporate goals and objectives.
Concluding Thoughts
EL is prepared to handle the effects of COVID-19 and maintain a
competitive advantage over is peers in the beauty industry going
forward. We will have to closely monitor the company’s actions over
the coming months. Our analyses, valuation, and catalysts imply a
positive outlook for the firm’s performance and justify our Buy rating.
Table 2: ISS Governance
Quality Score Breakdown
Source: Institutional
Shareholder Services
Audit 1
Board 10
Shareholder Rights 10
Compensation 6
EL
May 4, 2020
Equity Analysis
Alexander Lai, Equity Research Extern, (718) 962-4212, alai5@binghamton.eduPage 13 of 15
Appendices
EL
May 4, 2020
Equity Analysis
Alexander Lai, Equity Research Extern, (718) 962-4212, alai5@binghamton.eduPage 14 of 15
Source: Company Reports
1Q17 2Q17 3Q17 4Q17 FY 1Q18 2Q18 3Q18 4Q18 FY 1Q19 Q219 Q319 Q419 FY
Sep-16 Dec-16 Mar-17 Jun-17 2017 Sep-17 Dec-17 Mar-18 Jun-18 2018 Sep-18 Dec-18 Mar-19 Jun-19 2019
Cash & equivalents 1,189 1,675 1,840 1,741 1,741 1,825 2,499 2,524 2,715 2,715 1,993 2,401 2,902 2,987 2,987
Accounts receivable 1,624 1,508 1,528 1,395 1,395 1,799 1,699 1,761 1,487 1,487 2,214 2,000 2,036 1,831 1,831
Inventories (incl. promotional merchandise) 1,296 1,278 1,310 1,479 1,479 1,518 1,445 1,533 1,618 1,618 1,681 1,651 1,814 2,006 2,006
Prepaid expenses & other current assets 292 328 294 349 349 365 332 351 348 348 361 388 408 388 388
0 0 0 0 0 0 0 0 0 0 0 0 0 0 0
Total current assets 4,401 4,789 4,972 4,964 $4,964 5,507 5,975 6,169 6,168 $6,168 6,249 6,440 7,160 7,212 $7,212
Property, plant and equipment 1,569 1,563 1,576 1,671 1,671 1,695 1,728 1,726 1,823 1,823 1,838 1,859 1,891 2,068 2,068
Operating lease right-of-use assets 0 0 0 0 0 0 0 0 0 0 0 0 0 0 0
Other assets 3,378 4,860 4,897 4,933 4,933 5,000 4,901 4,877 4,576 4,576 4,456 4,377 3,880 3,876 3,876
TOTAL ASSETS 9,348 11,212 11,445 11,568 $11,568 12,202 12,604 12,772 12,567 $12,567 12,543 12,676 12,931 13,156 $13,156
Short-term debt 592 2,143 519 189 189 552 413 296 183 183 183 18 516 516 516
Accounts payable 546 617 597 835 835 679 738 884 1,182 1,182 913 995 1,068 1,490 1,490
Accrued income taxes 0 0 0 0 0 0 0 0 0 0 0 0 0
Operating lease liabilities 0 0 0 0 0 0 0 0 0 0 0 0 0 0 0
Other current liabilities 1,574 1,698 1,744 1,799 1,799 1,911 2,252 2,208 1,945 1,945 2,467 2,763 2,647 2,599 2,599
Total current liabilities 2,712 4,458 2,860 2,823 $2,823 3,142 3,403 3,388 3,310 $3,310 3,563 3,776 4,231 4,605 $4,605
Long-term debt 1,908 1,890 3,377 3,383 3,383 3,383 3,374 3,363 3,361 3,361 3,361 3,373 2,883 2,896 2,896
Other non-current liabilities 1,053 1,056 1,073 960 1,046 924 1,238 1,284 1,186 1,046 1,189 1,194 1,200 1,244 1,046
Minority interest 0 0 0 0 0 0 0 0 0 0 0 0 0 0 0
Long-term operating lease liabilities 0 0 0 0 0 0 0 0 0 0 0 0 0 0 0
Total liabilities 5,673 7,404 7,310 7,166 $7,166 7,449 8,015 8,035 7,857 $7,857 8,113 8,343 8,314 8,745 $8,745
Total stockholders equity 3,675 3,808 4,135 4,402 4,402 4,753 4,589 4,737 4,710 4,710 4,430 4,333 4,617 4,411 4,411
Chart 25: Historical Balance Sheet
Chart 24: Historical Income Statement
1Q17 2Q17 3Q17 4Q17 FY 1Q18 2Q18 3Q18 4Q18 FY 1Q19 Q219 Q319 Q419 FY
Sep-16 Dec-16 Mar-17 Jun-17 2017 Sep-17 Dec-17 Mar-18 Jun-18 2018 Sep-18 Dec-18 Mar-19 Jun-19 2019
Net sales $2,865 $3,208 $2,857 $2,894 $11,824 $3,274 $3,744 $3,370 $3,295 $13,683 $3,524 $4,005 $3,744 $3,590 $14,863
% Change 1.1% 2.7% 7.5% 9.4% 5.0% 14.3% 16.7% 18.0% 13.9% 15.7% 7.6% 7.0% 11.1% 9.0% 8.6%
Cost of sales 596 637 591 613 2,437 711 751 683 697 2,842 823 910 819 835 3,387
Gross profit $2,269 $2,571 $2,266 $2,281 $9,387 $2,563 $2,993 $2,687 $2,598 $10,841 $2,701 $3,095 $2,925 $2,755 $11,476
% Gross margin 79.2% 80.1% 79.3% 78.8% 79.4% 78.3% 79.9% 79.7% 78.8% 79.2% 76.6% 77.3% 78.1% 76.7% 77.2%
SG&A 1,825 1,917 1,780 1,947 7,469 1,961 2,214 2,093 2,288 8,556 2,008 2,257 2,170 2,422 8,857
Operating income $418 $617 $427 $230 $1,692 568 712 497 277 $2,054 652 771 674 216 $2,313
% Operating margin 14.6% 19.2% 14.9% 7.9% 14.3% 17.3% 19.0% 14.7% 8.4% 15.0% 18.5% 19.3% 18.0% 6.0% 15.6%
Interest expense, net 15 17 20 23 75 19 20 17 16 72 19 23 17 16 75
Other Expense (Income) (70) 1 (69)
EBT $403 $600 $407 207 $1,617 549 692 480 261 $1,982 633 748 727 199 $2,307
D&A 106 112 107 139 464 127 129 133 142 531 132 137 135 149 553
EBITDA $524 $729 534 369 $2,156 695 841 630 419 $2,585 784 908 809 365 $2,866
Taxes 107 170 107 (23) 361 119 565 106 73 863 131 171 170 41 513
Minority interest (2) (2) (2) (1) (7) (3) (2) (2) (2) (9) (2) (4) (2) (1) (9)
Net Income $294 $428 $298 $229 $1,249 $427 $125 $372 $186 $1,110 $500 $573 $555 $157 $1,785
Source: Company Reports
EL
May 4, 2020
Equity Analysis
Alexander Lai, Equity Research Extern, (718) 962-4212, alai5@binghamton.eduPage 15 of 15
Chart 26: Historical Cash Flow Statement
1Q17 2Q17 3Q17 4Q17 FY 1Q18 2Q18 3Q18 4Q18 FY 1Q19 2Q19 Q319 Q419 FY
Sep-16 Dec-16 Mar-17 Jun-17 2017 Sep-17 Dec-17 Mar-18 Jun-18 2018 Sep-18 Dec-18 Mar-19 Jun-19 2019
Net earnings 296 726 1,026 1,256 1,256 430 555 929 1,117 1,117 502 1,079 1,636 1,794 1,794
Adjustments to reconcile net earnings to net cash flows:
Depreciation and amortization 106 218 337 464 464 127 256 389 531 531 132 269 404 557 557
Amortization of purchased royalty rights 0 0 0 0 0 0 0 0 0 0 0 0 0 0 0
Deferred income taxes (32) (55) (84) (118) (118) (3) 106 84 175 175 (9) (46) (46) (66) (66)
Non-cash stock compensation 88 134 175 219 219 57 132 196 236 236 58 131 201 0 0
Excess tax benefits from stock-based compensation arrangements (10) (14) (37) (45) (45) 0 0 0 0 0 0 0 0 0 0
Loss on disposal of fixed assets (7) (7) (4) 5 5 3 7 12 15 15 3 5 6 0 0
Minority interest 0 0 0 0 0 0 0 0 0 0 0 0 0 0 0
Non-cash portion of restructuring and other non-recurring expenses 1 3 3 3 3 0 1 1 1 1 0 0 0 0 0
Other non-cash items 16 25 24 (5) (5) 8 15 (30) (77) (77) (3) 39 14 234 234
Discontinued operations, net of tax 0 0 0 0 0 0 0 0 0 0 0 0 0 0 0
Cumulative effect of change in accounting principle 0 0 0 0 0 0 0 0 0 0 0 0 0 0 0
Changes in operating assets and liabilities:
Increase in accounts receivable, net (365) (243) (242) (92) (92) (390) (281) (325) (105) (105) (546) (343) (377) (169) (169)
Decrease (increase) in inventory and promotional merchandise, Net (31) 78 59 (85) (85) (16) 66 0 (147) (147) (36) (21) (184) (375) (375)
Increase in other assets 4 (32) (30) (80) (80) 13 12 1 12 12 (18) (53) (73) (62) (62)
Decrease in accounts payable (170) (143) (168) 54 54 (166) (111) 20 349 349 (262) (174) (105) 604 604
Increase in accrued income taxes (46) 0 0 224 224 0 0 0 0 0 0 0 0 0 0
Increase in other accrued liabilities 0 134 193 - - 30 692 654 466 466 60 387 280 0 0
Decrease in other non-current liabilities 0 0 0 0 0 0
Net cash flows used for operating activities of discontinued operations 0 0 0 0
Net cash provided by (used in) operating activities ($150) $824 $1,252 $1,800 $1,800 $93 $1,450 $1,931 $2,573 $2,573 ($119) $1,273 $1,756 $2,517 $2,517
Capital expenditures (85) (208) (316) (504) (504) (116) (263) (368) (629) (629) (128) (292) (441) (744) (744)
Capital expenditures of discontinued operations 0 0 0 0 0 0 0 0 0 0 0 0 0
Acquisition of businesses (net of acquired cash) (10) (1,690) (1,690) (1,681) (1,681) (11) (11) (11) (11) (11) 0 0 0 0 0
Proceeds from disposition of long-term investments 365 637 955 1,226 1,226 0 609 716 749 749 173 271 1,229 1,215 1,215
Purchase of long-term investments (336) (466) (1,067) (1,267) (1,267) (148) (479) (492) (478) (478) (14) (14) (14) (100) (100)
Proceeds from divestitures/other 12 12 12 311 0 0 0 0 0 0 0 0 0
Net cash used in investing activities ($66) ($1,727) ($2,106) ($2,214) ($2,214) $36 ($144) ($155) ($369) ($369) $31 ($35) $774 $371 $371
Increase (decrease) in short-term debt, net 263 1,817 194 165 165 362 222 106 (8) (8) (3) (169) (167) (167) (167)
Proceeds from issuance of long-term debt, net (2) (3) 1,498 1,498 1,498 0 (1) 0 0 0 0 0 (1) (466) (466)
Debt issuance costs 0 0 (10) (11) (11) 0 0 0 0 0 0 0 0 0 0
Proceeds from the net settlement of Treasure Lock agreements 0 0 0 0 0 0 0 0 0 0 0 0 0 0 0
Repayments and redemptions of long-term debt 0 0 (4) (306) (306) 0 0 (1) (2) (2) 0 0 0 0 0
Net proceeds from employee stock transactions 26 41 94 186 186 48 83 157 182 182 0 0 0 0 0
Excess tax benefits from stock-based compensation arrangements 10 14 37 0 0 0 0 0 0 0 33 59 154 154 154
Acquisition of treasury stock (222) (363) (363) (413) (413) (111) (398) (676) (759) (759) (530) (1,126) (1,344) (1,555) (1,555)
Dividends paid (111) (236) (361) (486) (486) (126) (267) (407) (546) (546) (141) (297) (453) (609) (609)
Distributions made to minority holders & other 0 0 (2) (3) (3) 0 (1) (1) (39) (39) (1) (3) (3) (75) (75)
Proceeds from the issuance of commercial paper 0 0 0 0 0 0 0 0 0 0 0 0 0
Net cash provided by (used in) financing activities ($36) $1,270 $1,083 $630 $630 $173 ($362) ($822) ($1,172) ($1,172) ($642) ($1,536) ($1,814) ($2,718) ($2,718)
Source: Company Reports

More Related Content

What's hot

Depreciation at delta & singapore airline (HBR)
Depreciation at delta & singapore  airline (HBR)Depreciation at delta & singapore  airline (HBR)
Depreciation at delta & singapore airline (HBR)Abhishek kyal
 
Mountain Man Brewing Co. Case Study
Mountain Man Brewing Co. Case StudyMountain Man Brewing Co. Case Study
Mountain Man Brewing Co. Case StudyAvani Jain
 
Beauty and Personal Care in Sub-Saharan Africa
Beauty and Personal Care in Sub-Saharan AfricaBeauty and Personal Care in Sub-Saharan Africa
Beauty and Personal Care in Sub-Saharan AfricaEuromonitor International
 
Lululemon Athletica Brand Audit
Lululemon Athletica Brand AuditLululemon Athletica Brand Audit
Lululemon Athletica Brand AuditJoanna Komvopoulos
 
Procter& Gamble: Harvard Marketing Case Study Analysis
Procter& Gamble: Harvard Marketing Case Study AnalysisProcter& Gamble: Harvard Marketing Case Study Analysis
Procter& Gamble: Harvard Marketing Case Study AnalysisVasudha Harlalka
 
Colgate palmolive the precision toothbrush
Colgate palmolive the precision toothbrushColgate palmolive the precision toothbrush
Colgate palmolive the precision toothbrushRajendra Inani
 
Mountain man brewing company
Mountain man brewing companyMountain man brewing company
Mountain man brewing companySameer Mathur
 
Mountain Man Brewing Company: Case Analysis
Mountain Man Brewing Company: Case AnalysisMountain Man Brewing Company: Case Analysis
Mountain Man Brewing Company: Case AnalysisShashank Srivastava
 
Marriott Corporation. Cost of Capital
Marriott Corporation. Cost of CapitalMarriott Corporation. Cost of Capital
Marriott Corporation. Cost of CapitalTurumbayevRassul
 
Procter & Gamble, A case study
Procter & Gamble, A case study Procter & Gamble, A case study
Procter & Gamble, A case study Ronak Pani
 
Valuation of lululemon
Valuation of lululemonValuation of lululemon
Valuation of lululemonChristine Yee
 
Colgate Palmolive - The Precision Toothbrush - Case Study Analysis
Colgate Palmolive - The Precision Toothbrush - Case Study AnalysisColgate Palmolive - The Precision Toothbrush - Case Study Analysis
Colgate Palmolive - The Precision Toothbrush - Case Study AnalysisSharanya Ray
 
Under Armour Case Study
Under Armour Case StudyUnder Armour Case Study
Under Armour Case Studykmn3973
 
Dove Beauty Case Study
Dove Beauty Case StudyDove Beauty Case Study
Dove Beauty Case StudyElyse Schaefer
 

What's hot (20)

Crescent pure
Crescent pureCrescent pure
Crescent pure
 
Nike Cost of Capital
Nike Cost of Capital Nike Cost of Capital
Nike Cost of Capital
 
Depreciation at delta & singapore airline (HBR)
Depreciation at delta & singapore  airline (HBR)Depreciation at delta & singapore  airline (HBR)
Depreciation at delta & singapore airline (HBR)
 
Mountain Man Brewing Co. Case Study
Mountain Man Brewing Co. Case StudyMountain Man Brewing Co. Case Study
Mountain Man Brewing Co. Case Study
 
Estee Lauder analysis
Estee Lauder analysisEstee Lauder analysis
Estee Lauder analysis
 
Financial Policy at Apple (A) 2013
Financial Policy at Apple (A) 2013Financial Policy at Apple (A) 2013
Financial Policy at Apple (A) 2013
 
Beauty and Personal Care in Sub-Saharan Africa
Beauty and Personal Care in Sub-Saharan AfricaBeauty and Personal Care in Sub-Saharan Africa
Beauty and Personal Care in Sub-Saharan Africa
 
Lululemon Athletica Brand Audit
Lululemon Athletica Brand AuditLululemon Athletica Brand Audit
Lululemon Athletica Brand Audit
 
Procter& Gamble: Harvard Marketing Case Study Analysis
Procter& Gamble: Harvard Marketing Case Study AnalysisProcter& Gamble: Harvard Marketing Case Study Analysis
Procter& Gamble: Harvard Marketing Case Study Analysis
 
Colgate palmolive the precision toothbrush
Colgate palmolive the precision toothbrushColgate palmolive the precision toothbrush
Colgate palmolive the precision toothbrush
 
Baldwin Bicycle
Baldwin BicycleBaldwin Bicycle
Baldwin Bicycle
 
Mountain man brewing company
Mountain man brewing companyMountain man brewing company
Mountain man brewing company
 
Mountain Man Brewing Company: Case Analysis
Mountain Man Brewing Company: Case AnalysisMountain Man Brewing Company: Case Analysis
Mountain Man Brewing Company: Case Analysis
 
Marriott Corporation. Cost of Capital
Marriott Corporation. Cost of CapitalMarriott Corporation. Cost of Capital
Marriott Corporation. Cost of Capital
 
Procter & Gamble, A case study
Procter & Gamble, A case study Procter & Gamble, A case study
Procter & Gamble, A case study
 
CPNSFinalPaper
CPNSFinalPaperCPNSFinalPaper
CPNSFinalPaper
 
Valuation of lululemon
Valuation of lululemonValuation of lululemon
Valuation of lululemon
 
Colgate Palmolive - The Precision Toothbrush - Case Study Analysis
Colgate Palmolive - The Precision Toothbrush - Case Study AnalysisColgate Palmolive - The Precision Toothbrush - Case Study Analysis
Colgate Palmolive - The Precision Toothbrush - Case Study Analysis
 
Under Armour Case Study
Under Armour Case StudyUnder Armour Case Study
Under Armour Case Study
 
Dove Beauty Case Study
Dove Beauty Case StudyDove Beauty Case Study
Dove Beauty Case Study
 

Similar to Estée Lauder Equity Research Report

Sm Case Jisha & Remya(2)
Sm Case Jisha & Remya(2)Sm Case Jisha & Remya(2)
Sm Case Jisha & Remya(2)guest78d8ca
 
Presentation p&g final
Presentation p&g finalPresentation p&g final
Presentation p&g finalabumuiz82
 
Od4961 lipstick manufacturing industry report
Od4961 lipstick manufacturing industry reportOd4961 lipstick manufacturing industry report
Od4961 lipstick manufacturing industry reportReggie Aspelund
 
WDFC Equity Report SDSU
WDFC Equity Report SDSUWDFC Equity Report SDSU
WDFC Equity Report SDSUHongliao Xiong
 
US Personal Care and Consumer Healthcare (OTC) Market and M&A highlights
US Personal Care and Consumer Healthcare (OTC) Market and M&A highlightsUS Personal Care and Consumer Healthcare (OTC) Market and M&A highlights
US Personal Care and Consumer Healthcare (OTC) Market and M&A highlightsPete Chatziplis
 
Beauty/Cosmetics and Personal Care Industry
Beauty/Cosmetics and Personal Care IndustryBeauty/Cosmetics and Personal Care Industry
Beauty/Cosmetics and Personal Care Industrykirtane&Pandit
 
I-Bytes Healthcare Industry
I-Bytes Healthcare IndustryI-Bytes Healthcare Industry
I-Bytes Healthcare IndustryEGBG Services
 
Beauty Industry Overview 2017
Beauty Industry Overview 2017Beauty Industry Overview 2017
Beauty Industry Overview 2017Charlotte Brook
 
William Blair Investment Banking Competition Slide Deck
William Blair Investment Banking Competition Slide DeckWilliam Blair Investment Banking Competition Slide Deck
William Blair Investment Banking Competition Slide DeckEric Bonelli
 
Strategic Management in P&G
Strategic Management in P&GStrategic Management in P&G
Strategic Management in P&Gfalak nawaz
 
Team_3_Aritzia Anlysis report.docx
Team_3_Aritzia Anlysis report.docxTeam_3_Aritzia Anlysis report.docx
Team_3_Aritzia Anlysis report.docxKiran Dubb
 
Redseer_BPC_Report.pdf
Redseer_BPC_Report.pdfRedseer_BPC_Report.pdf
Redseer_BPC_Report.pdfRedSeer
 
Creating Meaningful Brands
Creating Meaningful BrandsCreating Meaningful Brands
Creating Meaningful BrandsKantar
 
International Business Strategy_AVON_Report
International Business Strategy_AVON_ReportInternational Business Strategy_AVON_Report
International Business Strategy_AVON_ReportHungyu Lai
 

Similar to Estée Lauder Equity Research Report (20)

Sm Case Jisha & Remya(2)
Sm Case Jisha & Remya(2)Sm Case Jisha & Remya(2)
Sm Case Jisha & Remya(2)
 
Presentation p&g final
Presentation p&g finalPresentation p&g final
Presentation p&g final
 
Od4961 lipstick manufacturing industry report
Od4961 lipstick manufacturing industry reportOd4961 lipstick manufacturing industry report
Od4961 lipstick manufacturing industry report
 
TOP 50 APPAREL BRANDS
TOP 50 APPAREL BRANDSTOP 50 APPAREL BRANDS
TOP 50 APPAREL BRANDS
 
WDFC Equity Report SDSU
WDFC Equity Report SDSUWDFC Equity Report SDSU
WDFC Equity Report SDSU
 
WDFC Equity Report 2016
WDFC Equity Report 2016WDFC Equity Report 2016
WDFC Equity Report 2016
 
US Personal Care and Consumer Healthcare (OTC) Market and M&A highlights
US Personal Care and Consumer Healthcare (OTC) Market and M&A highlightsUS Personal Care and Consumer Healthcare (OTC) Market and M&A highlights
US Personal Care and Consumer Healthcare (OTC) Market and M&A highlights
 
Beauty/Cosmetics and Personal Care Industry
Beauty/Cosmetics and Personal Care IndustryBeauty/Cosmetics and Personal Care Industry
Beauty/Cosmetics and Personal Care Industry
 
Handout 3 Brand Valuation Workshop
Handout 3 Brand Valuation WorkshopHandout 3 Brand Valuation Workshop
Handout 3 Brand Valuation Workshop
 
global-consumer-goods-m-a-report
global-consumer-goods-m-a-reportglobal-consumer-goods-m-a-report
global-consumer-goods-m-a-report
 
I-Bytes Healthcare Industry
I-Bytes Healthcare IndustryI-Bytes Healthcare Industry
I-Bytes Healthcare Industry
 
Smucker Project
Smucker ProjectSmucker Project
Smucker Project
 
Beauty Industry Overview 2017
Beauty Industry Overview 2017Beauty Industry Overview 2017
Beauty Industry Overview 2017
 
William Blair Investment Banking Competition Slide Deck
William Blair Investment Banking Competition Slide DeckWilliam Blair Investment Banking Competition Slide Deck
William Blair Investment Banking Competition Slide Deck
 
Beacon February version
Beacon February versionBeacon February version
Beacon February version
 
Strategic Management in P&G
Strategic Management in P&GStrategic Management in P&G
Strategic Management in P&G
 
Team_3_Aritzia Anlysis report.docx
Team_3_Aritzia Anlysis report.docxTeam_3_Aritzia Anlysis report.docx
Team_3_Aritzia Anlysis report.docx
 
Redseer_BPC_Report.pdf
Redseer_BPC_Report.pdfRedseer_BPC_Report.pdf
Redseer_BPC_Report.pdf
 
Creating Meaningful Brands
Creating Meaningful BrandsCreating Meaningful Brands
Creating Meaningful Brands
 
International Business Strategy_AVON_Report
International Business Strategy_AVON_ReportInternational Business Strategy_AVON_Report
International Business Strategy_AVON_Report
 

Recently uploaded

Ten Organizational Design Models to align structure and operations to busines...
Ten Organizational Design Models to align structure and operations to busines...Ten Organizational Design Models to align structure and operations to busines...
Ten Organizational Design Models to align structure and operations to busines...Seta Wicaksana
 
Call Girls Miyapur 7001305949 all area service COD available Any Time
Call Girls Miyapur 7001305949 all area service COD available Any TimeCall Girls Miyapur 7001305949 all area service COD available Any Time
Call Girls Miyapur 7001305949 all area service COD available Any Timedelhimodelshub1
 
Call Girls In Connaught Place Delhi ❤️88604**77959_Russian 100% Genuine Escor...
Call Girls In Connaught Place Delhi ❤️88604**77959_Russian 100% Genuine Escor...Call Girls In Connaught Place Delhi ❤️88604**77959_Russian 100% Genuine Escor...
Call Girls In Connaught Place Delhi ❤️88604**77959_Russian 100% Genuine Escor...lizamodels9
 
BEST Call Girls In Old Faridabad ✨ 9773824855 ✨ Escorts Service In Delhi Ncr,
BEST Call Girls In Old Faridabad ✨ 9773824855 ✨ Escorts Service In Delhi Ncr,BEST Call Girls In Old Faridabad ✨ 9773824855 ✨ Escorts Service In Delhi Ncr,
BEST Call Girls In Old Faridabad ✨ 9773824855 ✨ Escorts Service In Delhi Ncr,noida100girls
 
Marketing Management Business Plan_My Sweet Creations
Marketing Management Business Plan_My Sweet CreationsMarketing Management Business Plan_My Sweet Creations
Marketing Management Business Plan_My Sweet Creationsnakalysalcedo61
 
Call Girls in DELHI Cantt, ( Call Me )-8377877756-Female Escort- In Delhi / Ncr
Call Girls in DELHI Cantt, ( Call Me )-8377877756-Female Escort- In Delhi / NcrCall Girls in DELHI Cantt, ( Call Me )-8377877756-Female Escort- In Delhi / Ncr
Call Girls in DELHI Cantt, ( Call Me )-8377877756-Female Escort- In Delhi / Ncrdollysharma2066
 
Call Us 📲8800102216📞 Call Girls In DLF City Gurgaon
Call Us 📲8800102216📞 Call Girls In DLF City GurgaonCall Us 📲8800102216📞 Call Girls In DLF City Gurgaon
Call Us 📲8800102216📞 Call Girls In DLF City Gurgaoncallgirls2057
 
8447779800, Low rate Call girls in Shivaji Enclave Delhi NCR
8447779800, Low rate Call girls in Shivaji Enclave Delhi NCR8447779800, Low rate Call girls in Shivaji Enclave Delhi NCR
8447779800, Low rate Call girls in Shivaji Enclave Delhi NCRashishs7044
 
8447779800, Low rate Call girls in New Ashok Nagar Delhi NCR
8447779800, Low rate Call girls in New Ashok Nagar Delhi NCR8447779800, Low rate Call girls in New Ashok Nagar Delhi NCR
8447779800, Low rate Call girls in New Ashok Nagar Delhi NCRashishs7044
 
Call Girls In Sikandarpur Gurgaon ❤️8860477959_Russian 100% Genuine Escorts I...
Call Girls In Sikandarpur Gurgaon ❤️8860477959_Russian 100% Genuine Escorts I...Call Girls In Sikandarpur Gurgaon ❤️8860477959_Russian 100% Genuine Escorts I...
Call Girls In Sikandarpur Gurgaon ❤️8860477959_Russian 100% Genuine Escorts I...lizamodels9
 
Call US-88OO1O2216 Call Girls In Mahipalpur Female Escort Service
Call US-88OO1O2216 Call Girls In Mahipalpur Female Escort ServiceCall US-88OO1O2216 Call Girls In Mahipalpur Female Escort Service
Call US-88OO1O2216 Call Girls In Mahipalpur Female Escort Servicecallgirls2057
 
Flow Your Strategy at Flight Levels Day 2024
Flow Your Strategy at Flight Levels Day 2024Flow Your Strategy at Flight Levels Day 2024
Flow Your Strategy at Flight Levels Day 2024Kirill Klimov
 
Intro to BCG's Carbon Emissions Benchmark_vF.pdf
Intro to BCG's Carbon Emissions Benchmark_vF.pdfIntro to BCG's Carbon Emissions Benchmark_vF.pdf
Intro to BCG's Carbon Emissions Benchmark_vF.pdfpollardmorgan
 
Contemporary Economic Issues Facing the Filipino Entrepreneur (1).pptx
Contemporary Economic Issues Facing the Filipino Entrepreneur (1).pptxContemporary Economic Issues Facing the Filipino Entrepreneur (1).pptx
Contemporary Economic Issues Facing the Filipino Entrepreneur (1).pptxMarkAnthonyAurellano
 
Digital Transformation in the PLM domain - distrib.pdf
Digital Transformation in the PLM domain - distrib.pdfDigital Transformation in the PLM domain - distrib.pdf
Digital Transformation in the PLM domain - distrib.pdfJos Voskuil
 
Future Of Sample Report 2024 | Redacted Version
Future Of Sample Report 2024 | Redacted VersionFuture Of Sample Report 2024 | Redacted Version
Future Of Sample Report 2024 | Redacted VersionMintel Group
 
India Consumer 2024 Redacted Sample Report
India Consumer 2024 Redacted Sample ReportIndia Consumer 2024 Redacted Sample Report
India Consumer 2024 Redacted Sample ReportMintel Group
 
Lowrate Call Girls In Sector 18 Noida ❤️8860477959 Escorts 100% Genuine Servi...
Lowrate Call Girls In Sector 18 Noida ❤️8860477959 Escorts 100% Genuine Servi...Lowrate Call Girls In Sector 18 Noida ❤️8860477959 Escorts 100% Genuine Servi...
Lowrate Call Girls In Sector 18 Noida ❤️8860477959 Escorts 100% Genuine Servi...lizamodels9
 
Kenya’s Coconut Value Chain by Gatsby Africa
Kenya’s Coconut Value Chain by Gatsby AfricaKenya’s Coconut Value Chain by Gatsby Africa
Kenya’s Coconut Value Chain by Gatsby Africaictsugar
 

Recently uploaded (20)

Ten Organizational Design Models to align structure and operations to busines...
Ten Organizational Design Models to align structure and operations to busines...Ten Organizational Design Models to align structure and operations to busines...
Ten Organizational Design Models to align structure and operations to busines...
 
Call Girls Miyapur 7001305949 all area service COD available Any Time
Call Girls Miyapur 7001305949 all area service COD available Any TimeCall Girls Miyapur 7001305949 all area service COD available Any Time
Call Girls Miyapur 7001305949 all area service COD available Any Time
 
Call Girls In Connaught Place Delhi ❤️88604**77959_Russian 100% Genuine Escor...
Call Girls In Connaught Place Delhi ❤️88604**77959_Russian 100% Genuine Escor...Call Girls In Connaught Place Delhi ❤️88604**77959_Russian 100% Genuine Escor...
Call Girls In Connaught Place Delhi ❤️88604**77959_Russian 100% Genuine Escor...
 
BEST Call Girls In Old Faridabad ✨ 9773824855 ✨ Escorts Service In Delhi Ncr,
BEST Call Girls In Old Faridabad ✨ 9773824855 ✨ Escorts Service In Delhi Ncr,BEST Call Girls In Old Faridabad ✨ 9773824855 ✨ Escorts Service In Delhi Ncr,
BEST Call Girls In Old Faridabad ✨ 9773824855 ✨ Escorts Service In Delhi Ncr,
 
Marketing Management Business Plan_My Sweet Creations
Marketing Management Business Plan_My Sweet CreationsMarketing Management Business Plan_My Sweet Creations
Marketing Management Business Plan_My Sweet Creations
 
Call Girls in DELHI Cantt, ( Call Me )-8377877756-Female Escort- In Delhi / Ncr
Call Girls in DELHI Cantt, ( Call Me )-8377877756-Female Escort- In Delhi / NcrCall Girls in DELHI Cantt, ( Call Me )-8377877756-Female Escort- In Delhi / Ncr
Call Girls in DELHI Cantt, ( Call Me )-8377877756-Female Escort- In Delhi / Ncr
 
Call Us 📲8800102216📞 Call Girls In DLF City Gurgaon
Call Us 📲8800102216📞 Call Girls In DLF City GurgaonCall Us 📲8800102216📞 Call Girls In DLF City Gurgaon
Call Us 📲8800102216📞 Call Girls In DLF City Gurgaon
 
8447779800, Low rate Call girls in Shivaji Enclave Delhi NCR
8447779800, Low rate Call girls in Shivaji Enclave Delhi NCR8447779800, Low rate Call girls in Shivaji Enclave Delhi NCR
8447779800, Low rate Call girls in Shivaji Enclave Delhi NCR
 
8447779800, Low rate Call girls in New Ashok Nagar Delhi NCR
8447779800, Low rate Call girls in New Ashok Nagar Delhi NCR8447779800, Low rate Call girls in New Ashok Nagar Delhi NCR
8447779800, Low rate Call girls in New Ashok Nagar Delhi NCR
 
Call Girls In Sikandarpur Gurgaon ❤️8860477959_Russian 100% Genuine Escorts I...
Call Girls In Sikandarpur Gurgaon ❤️8860477959_Russian 100% Genuine Escorts I...Call Girls In Sikandarpur Gurgaon ❤️8860477959_Russian 100% Genuine Escorts I...
Call Girls In Sikandarpur Gurgaon ❤️8860477959_Russian 100% Genuine Escorts I...
 
Corporate Profile 47Billion Information Technology
Corporate Profile 47Billion Information TechnologyCorporate Profile 47Billion Information Technology
Corporate Profile 47Billion Information Technology
 
Call US-88OO1O2216 Call Girls In Mahipalpur Female Escort Service
Call US-88OO1O2216 Call Girls In Mahipalpur Female Escort ServiceCall US-88OO1O2216 Call Girls In Mahipalpur Female Escort Service
Call US-88OO1O2216 Call Girls In Mahipalpur Female Escort Service
 
Flow Your Strategy at Flight Levels Day 2024
Flow Your Strategy at Flight Levels Day 2024Flow Your Strategy at Flight Levels Day 2024
Flow Your Strategy at Flight Levels Day 2024
 
Intro to BCG's Carbon Emissions Benchmark_vF.pdf
Intro to BCG's Carbon Emissions Benchmark_vF.pdfIntro to BCG's Carbon Emissions Benchmark_vF.pdf
Intro to BCG's Carbon Emissions Benchmark_vF.pdf
 
Contemporary Economic Issues Facing the Filipino Entrepreneur (1).pptx
Contemporary Economic Issues Facing the Filipino Entrepreneur (1).pptxContemporary Economic Issues Facing the Filipino Entrepreneur (1).pptx
Contemporary Economic Issues Facing the Filipino Entrepreneur (1).pptx
 
Digital Transformation in the PLM domain - distrib.pdf
Digital Transformation in the PLM domain - distrib.pdfDigital Transformation in the PLM domain - distrib.pdf
Digital Transformation in the PLM domain - distrib.pdf
 
Future Of Sample Report 2024 | Redacted Version
Future Of Sample Report 2024 | Redacted VersionFuture Of Sample Report 2024 | Redacted Version
Future Of Sample Report 2024 | Redacted Version
 
India Consumer 2024 Redacted Sample Report
India Consumer 2024 Redacted Sample ReportIndia Consumer 2024 Redacted Sample Report
India Consumer 2024 Redacted Sample Report
 
Lowrate Call Girls In Sector 18 Noida ❤️8860477959 Escorts 100% Genuine Servi...
Lowrate Call Girls In Sector 18 Noida ❤️8860477959 Escorts 100% Genuine Servi...Lowrate Call Girls In Sector 18 Noida ❤️8860477959 Escorts 100% Genuine Servi...
Lowrate Call Girls In Sector 18 Noida ❤️8860477959 Escorts 100% Genuine Servi...
 
Kenya’s Coconut Value Chain by Gatsby Africa
Kenya’s Coconut Value Chain by Gatsby AfricaKenya’s Coconut Value Chain by Gatsby Africa
Kenya’s Coconut Value Chain by Gatsby Africa
 

Estée Lauder Equity Research Report

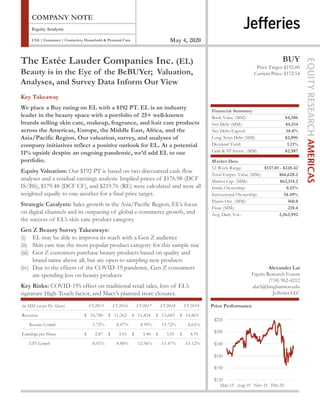
  • 1. Alexander Lai Equity Research Extern (718) 962-4212 alai5@binghamton.edu Jefferies LLC USA | Consumer | Cosmetics, Household & Personal Care Equity Analysis COMPANY NOTE May 4, 2020 The Estée Lauder Companies Inc. (EL) Beauty is in the Eye of the BeBUYer; Valuation, Analyses, and Survey Data Inform Our View Key Takeaway We place a Buy rating on EL with a $192 PT. EL is an industry leader in the beauty space with a portfolio of 25+ well-known brands selling skin care, makeup, fragrance, and hair care products across the Americas, Europe, the Middle East, Africa, and the Asia/Pacific Region. Our valuation, survey, and analyses of company initiatives reflect a positive outlook for EL. At a potential 11% upside despite an ongoing pandemic, we’d add EL to our portfolio. Equity Valuation: Our $192 PT is based on two discounted cash flow analyses and a residual earnings analysis. Implied prices of $176.98 (DCF IS/BS), $179.48 (DCF CF), and $219.76 (RE) were calculated and were all weighted equally to one another for a final price target. Strategic Catalysts: Sales growth in the Asia/Pacific Region, EL’s focus on digital channels and its outpacing of global e-commerce growth, and the success of EL’s skin care product category. Gen Z Beauty Survey Takeaways: (i) EL may be able to improve its reach with a Gen Z audience (ii) Skin care was the most popular product category for this sample size (iii) Gen Z customers purchase beauty products based on quality and brand name above all, but are open to sampling new products (iv) Due to the effects of the COVID-19 pandemic, Gen Z consumers are spending less on beauty products Key Risks: COVID-19’s effect on traditional retail sales, loss of EL’s signature High-Touch factor, and Macy’s planned store closures. BUY Price Target: $192.00 Current Price: $172.54 Price Performance Financial Summary 0.7 Book Value (MM): $4,386 Net Debt (MM): $4,514 Net Debt/Capital: 38.0% Long-Term Debt (MM) $2,896 Dividend Yield: 1.11% Cash & ST Invest. (MM) $2,987 Market Data 52 Week Range: $137.01 - $220.42 Total Entprs. Value (MM): $66,628.2 Market Cap. (MM): $62,114.2 Inside Ownership: 0.21% Institutional Ownership: 34.49% Shares Out. (MM): 360.0 Float (MM): 218.4 Avg. Daily Vol.: 2,563,992 (in MM except Per Share) FY2015 FY2016 FY2017 FY2018 FY2019 Revenue 10,780$ 11,262$ 11,824$ 13,683$ 14,863$ Revenue Growth -1.72% 4.47% 4.99% 15.72% 8.62% Earnings per Share 2.87$ 3.01$ 3.40$ 3.01$ 4.91$ EPS Growth -8.01% 4.88% 12.96% -11.47% 63.12%
  • 2. EL May 4, 2020 Equity Analysis Alexander Lai, Equity Research Extern, (718) 962-4212, alai5@binghamton.eduPage 2 of 15 Table of Contents COMPANY BACKGROUND.................................................................. 3 Business Description............................................................................ 3 INDUSTRY ANALYSIS............................................................................ 4 Beauty Market........................................................................................ 4 Market Trends........................................................................................ 4 VALUATION METHODOLOGY......................................................... 5 Valuation Summary............................................................................... 5 Weighted Average Cost of Capital..................................................... 5 Discounted Cash Flow Analysis......................................................... 6 Residual Earnings Analysis.................................................................. 7 SUPPORTING CATALYSTS................................................................... 8 Asia/Pacific Region Growth............................................................... 8 Digital Focus.......................................................................................... 8 Perseverance of Skin Care................................................................... 8 GEN Z BEAUTY SURVEY...................................................................... 9 Survey Results........................................................................................ 9 BUSINESS RISKS....................................................................................... 10 COVID-19 Slowing Retail Sales......................................................... 10 Losing the High-Touch Factor........................................................... 10 Macy’s Store Closures.......................................................................... 10 BOARD OF DIRECTORS....................................................................... 11 Board Composition.............................................................................. 11 CORPORATE GOVERNANCE............................................................ 12 ISS Governance Quality Score Analysis.............................................12 CONCLUDING THOUGHTS............................................................... 12 APPENDICES.................................................................................................. 3 3 4 4 4 5 5 5 6 7 8 8 8 8 9 9 10 10 10 10 11 11 12 12 12 13
  • 3. EL May 4, 2020 Equity Analysis Alexander Lai, Equity Research Extern, (718) 962-4212, alai5@binghamton.eduPage 3 of 15 Company Background Business Description: The Estée Lauder Companies Inc. is one of the world’s leading manufacturers and marketers of quality skin care, makeup, fragrance, and hair care products – see Chart 1. The company’s products are sold in approximately 150 countries and territories under a number of brand names including Estée Lauder, Clinique, Origins, M.A.C., Bobbi Brown, Jo Malone London, and Too Faced – see Charts 2 and 3. They are also the global licensee for fragrances, cosmetics, and/or related products sold under various designer brand names, such as Tommy Hilfiger, Donna Karan, Michael Kors, Tom Ford, and Coach. The company sells their prestige products principally through limited distribution channels to complement the images associated with their brands. These channels consist primarily of department stores, specialty-multi retailers, upscale perfumeries and pharmacies and prestige salons and spas. In addition, these products are sold in the Company’s own and authorized freestanding stores, their own and authorized retailer websites, third-party online malls, stores in airports and on cruise ships, in-flight, and duty-free shops. Chart 3: Brand Map Classic Premium Progressive Entry Price Point Source: Company Reports Chart 2: Net Sales by Region Source: Company Reports Chart 1: Net Sales by Product Category Source: Company Reports Table 1: Key Information Source: Company Reports Year Founded 1946 Headquarters New York, NY Employee Count 48,000
  • 4. EL May 4, 2020 Equity Analysis Alexander Lai, Equity Research Extern, (718) 962-4212, alai5@binghamton.eduPage 4 of 15 Industry Analysis Beauty Market: Beauty is currently a $500B+ industry and in the next five years is expected to grow at a 5-7% CAGR to exceed $800B by 2025. The beauty industry falls within the consumer staples sector, which is less sensitive to economic cycles. Macroeconomics factors that drive the consumer staples industry are employment, consumer confidence, inflation rates, and commodity costs, however, the sensitivity of this industry to these factors is relatively low compared to other industries. The main products sold by companies in this space relate to hair care, skin care, cosmetics, fragrance, personal products, and ancillary products. Hair care and skin care alone make up over half of the revenue in the industry at 61% market share while other categories take less than 20% each of overall market share. – see Chart 4. Industry peers include players such as Coty, Johnson & Johnson, Nu Skin, P&G, Revlon, Sally Beauty, and Ultra, among others - see Chart 5. Market Trends: There is a growing trend in recent years of beauty companies shifting away from wholesale selling to more direct-to-consumer channels. This allows companies to own the entire customer experience and cut out the middle man, allowing them to understand their target audience more deeply as well as reap high profit margins. Influencer marketing is also becoming more prevalent, with companies choosing to employ brand ambassadors instead of utilizing traditional advertising. Modern consumers are educating themselves on products and demand quality and transparency from companies. Recent initiatives such as the Personal Care Products Safety Act of 2019 work to regulate ingredients in beauty products, causing companies to be more conscious of consumer health while conducting research and development efforts. Chart 5: Industry Peers Source: Statista Chart 4: Market Share by Product Category Comparable Companies (as of 6/30/19) Company Ticker Market Cap (BN) Net Debt (BN) Enterprise Value (BN) Share Price Revenue (MN) EBITDA (MN) Net Income (MN) EPS Stockholder's Equity (MN) Outstanding Shares (MN) Book Value Coty Inc. COTY 10$ 7$ 2$ 12.95$ 8,649$ (2,736)$ (3,784)$ 0.65 4,587$ 751 6.11$ Johnson & Johnson JNJ 361$ 28$ 333$ 136.42$ 82,059$ 25,012$ 15,119$ 5.72 59,471$ 2,645 22.48$ Nu Skin Enterprises Inc. NUS 3$ 0$ 2$ 47.69$ 2,420$ 344$ 174$ 3.13 875$ 56 15.77$ Procter & Gamble Co. PG 269$ 46$ 223$ 107.61$ 67,684$ 8,311$ 3,897$ 1.45 47,479$ 2,504 18.96$ Revlon Inc. REV 1$ 4$ (3)$ 19.33$ 2,420$ 147$ (171)$ -3.11 (1,221)$ 53 (23.01)$ Sally Beauty Holdings Inc. SBH 2$ 2$ (0)$ 13.34$ 3,876$ 566$ 272$ 2.27 (60,323)$ 120 (504.22)$ Ulta Beauty Inc. ULTA 20$ 1$ 19$ 346.89$ 7,398$ 1,134$ 706$ 12.21 1,902$ 58 32.89$ Source: Company Reports
  • 5. EL May 4, 2020 Equity Analysis Alexander Lai, Equity Research Extern, (718) 962-4212, alai5@binghamton.eduPage 5 of 15 Valuation Methodology Valuation Summary: Our price target of $192 is based off of three valuation models; a discounted cash flow analysis based on the income statement and the balance sheet, a discounted cash flow based on the cash flow statement, and a residual earnings analysis. All three methods were weighted equally to come to a price target – see Charts 6 and 7. Chart 8: Weighted Average Cost of Capital Breakdown Weighted Average Cost of Capital: To arrive at a discount rate for the analyses, a weighted average coast of capital (WACC) had to be found. The cost of equity was calculated using the Capital Asset Pricing Model using both an industry beta and a regression analysis on the market. The cost of debt was calculated based on current borrowings, the yield to maturity method, the actual rating, and a synthetic rating. 7.88% was arrived at for the cost of equity, 4.06% was arrived at for the cost of debt, and based on these inputs, a WACC rate of 7.56% was arrived at – see Chart 8. Chart 6: Valuation Ranges Chart 7: Valuation Ranges Breakdown Current Price: $172.54 Price Target: $192.00 Source: Company Reports, Jefferies Source: Company Reports, Jefferies Debt Market Value of Debt (MM) $2,896 Weight of Debt 6.72% Cost of Debt 4.06% Equity Market Value of Equity (MM) $40,220 Weight of Equity 93.28% Cost of Equity 7.88% Weighted Average Cost of Capital Beta 0.76 Risk-Free Rate of Return 4.88% Market Risk Premium 4.83% Tax Rate 22.24% WACC 7.56% Source: Company Reports, Jefferies Low Q1 Median Q3 High Residual Earnings $174.75 $194.35 $220.33 $254.01 $302.76 Discounted Cash Flow (IS/BS) $121.80 $144.84 $176.98 $224.95 $304.27 Discounted Cash Flow (CF) $123.58 $146.91 $179.48 $228.08 $308.44 52 Week Range $137.01 $175.62 $188.12 $197.42 $220.42
  • 6. EL May 4, 2020 Equity Analysis Alexander Lai, Equity Research Extern, (718) 962-4212, alai5@binghamton.eduPage 6 of 15 Discounted Cash Flow Analysis: The discounted cash flow (DCF) analysis was chosen because EL has relatively stable cash flows that have had an upward trend over the last decade. Two methods were used to determine EL’s free cash flows; one drawing from the income statement and the balance sheet and the other drawing from the cash flow statement. A WACC of 7.56% was used as a discount rate. A perpetual growth rate of 2.5% was used as a conservative estimate of the company’s growth, mirroring the growth of U.S. GDP in recent years. Values of $176.95 and $179.45 were obtained using the income statement/balance sheet method and the cash flow statement method, respectively – see Charts 9 and 11. Chart 11: DCF (CF) Breakdown Chart 12: DCF (CF) Sensitivity Analysis Source: Company Reports, Jefferies Cash Flow Statement Method (in MM except Per Share) FY2017 FY2018 FY2019 Reported Cash Flow From Operations 1,790$ 2,562$ 2,517$ After Tax Net Interest Payment 49$ 41$ 57$ Cash Flow From Operations 1,839$ 2,603$ 2,574$ Capital Expenditures (504)$ (629)$ (744)$ Payments for Acquired Businesses (1,671)$ -$ -$ Proceeds from Sales of Investments 1,226$ 749$ 1,229$ Purchase of Investments (1,267)$ (478)$ (14)$ Cash Investment in Operations (2,216)$ (358)$ 471$ Free Cash Flow 4,055$ 2,961$ 2,103$ WACC= 7.56% g= 2.50% Total Firm Value 42,596$ Net Debt 2,896$ Intrinsic Value of Equity 39,700$ Shares Outstanding 221.22 Implied Share Price 179.48$ Source: Company Reports, Jefferies 6.56% 7.06% 7.56% 8.06% 8.56% 1.50% $177.60 $160.45 $146.13 $133.99 $123.58 2.00% $199.55 $178.54 $161.30 $146.91 $134.72 2.50% $226.91 $200.59 $179.48 $162.16 $147.70 3.00% $261.95 $228.08 $201.63 $180.42 $163.01 3.50% $308.44 $263.28 $229.25 $202.68 $181.35 PerpetualGrowth Weighted Average Cost of Capital Source: Company Reports, Jefferies Chart 9: DCF (IS/BS) Breakdown Income Statement & Balance Sheet Method (in MM except Per Share) FY2017 FY2018 FY2019 EBIT 1,704$ 2,055$ 2,313$ Marginal Tax Rate 27.90% 43.60% 22.20% NOPAT 1,229$ 1,159$ 1,800$ Deprecation and Amortization 464$ 531$ 557$ Capital Expenditure (2,216)$ (358)$ 471$ Net Working Capital 96$ (263)$ (190)$ Free Cash Flow 3,813$ 2,311$ 2,076$ WACC = 7.56% g= 2.50% Total Firm Value 42,044$ Net Debt 2,896$ Intrinsic Value of Equity 39,148$ Shares Outstanding 221.22 Implied Share Price 176.98$ Chart 10: DCF (IS/BS) Sensitivity Analysis Source: Company Reports, Jefferies 6.56% 7.06% 7.56% 8.06% 8.56% 1.50% $175.12 $158.20 $144.06 $132.09 $121.80 2.00% $196.79 $176.05 $159.04 $144.84 $132.80 2.50% $223.79 $197.82 $176.98 $159.89 $145.61 3.00% $258.38 $224.95 $198.85 $177.91 $160.73 3.50% $304.27 $259.70 $226.10 $199.88 $178.83 PerpetualGrowth Weighted Average Cost of Capital
  • 7. EL May 4, 2020 Equity Analysis Alexander Lai, Equity Research Extern, (718) 962-4212, alai5@binghamton.eduPage 7 of 15 Residual Earnings Analysis: The residual earnings analysis was chosen because EL is projected to consistently produce excess cash in future years. A 7.88% cost of equity was used as the discount rate. A earnings per share growth rate of 8.66% was used based off analyst estimates. A perpetual growth rate of residual earnings was predicted to be 6.54%. A value of $219.76 was obtained using this analysis – see Chart 13. Chart 13: Residual Earnings Analysis Breakdown Source: Company Reports, Jefferies Residual Earnings Analysis FY2019 FY2020 FY2021 FY2022 FY2023 FY2024 FY2025 FY2026 FY2027 FY2028 Earnings per Share 4.91$ 4.61$ 5.43$ 5.90$ 6.41$ 6.97$ 7.57$ 8.23$ 8.94$ 9.71$ EPS Growth - -6.11% 17.79% 8.66% 8.66% 8.66% 8.66% 8.66% 8.66% 8.66% Dividends per Share 1.67$ 1.85$ 2.04$ 2.26$ 2.50$ 2.77$ 3.07$ 3.39$ 3.75$ 4.15$ DPS Growth - 10.65% 10.65% 10.65% 10.65% 10.65% 10.65% 10.65% 10.65% 10.65% Book Value per Share 19.94$ 22.70$ 26.09$ 29.72$ 33.63$ 37.83$ 42.33$ 47.17$ 52.35$ 57.91$ BPS Growth - 13.85% 14.91% 13.94% 13.15% 12.48% 11.91% 11.42% 10.99% 10.62% Cost of Equity 7.88% Book Value of Equity (MM) 4,411 Shares Outstanding (MM) 221 Required Earnings - 1.57$ 1.79$ 2.06$ 2.34$ 2.65$ 2.98$ 3.34$ 3.72$ 4.12$ Residual Earnings 4.91$ 3.04$ 3.64$ 3.85$ 4.07$ 4.32$ 4.59$ 4.89$ 5.22$ 5.59$ RE Growth - -38.10% 19.82% 5.59% 5.84% 6.08% 6.32% 6.55% 6.78% 7.00% RE Growth after 2028 6.54% Terminal Value 344.97$ PV of Residual Earnings $200.76 Implied Share Price $219.76 Chart 14: Residual Earnings Sensitivity Analysis Source: Company Reports, Jefferies 7.68% 7.78% 7.88% 7.98% 8.08% 6.34% $225.74 $210.35 $196.95 $185.18 $174.75 6.44% $240.34 $222.73 $207.56 $194.35 $182.75 6.54% $257.50 $237.11 $219.76 $204.80 $191.78 6.64% $277.95 $254.01 $233.91 $216.81 $202.07 6.74% $302.76 $274.15 $250.56 $230.76 $213.90 ResidualEarningsGrowth Cost of Equity
  • 8. EL May 4, 2020 Equity Analysis Alexander Lai, Equity Research Extern, (718) 962-4212, alai5@binghamton.eduPage 8 of 15 Supporting Catalysts Asia/Pacific Region Growth: From Q1 to Q2, EL saw growth of 29% in the Asia/Pacific region jumping from $1,020MM to $1,319MM. The greater China area had double-digit net sales growth in part due to events such as Singles’ Day, an unofficial holiday where consumers go on a shopping spree to celebrate, similar to Black Friday in the U.S. Tall is the world’s third most visited website and is a popular online retailer in Asia. EL’s online sales on this platform saw a dramatic 135% increase from March 2019 to March 2020 of 129MM RMB, beating out other retailers, such as Lancôme, on the platform – see Chart 15. Upcoming events such as Mother’s Day, Children’s Day, Father’s Day, Youth Day, and Mall's Mid Year Sale in the coming months are expected to generate spikes in sales. Although historically this region produces less net sales than the Americas, Europe, the Middle East, and Africa, changing consumer habits in the region are contributing to this category’s growth. Digital Focus: EL noted that their online sales accelerated during February and March as the effects of the COVID-19 virus spread across Europe and the Americas. E-commerce represents ~30% of EL’s sales in top markets, and EL’s CAGR for online sales is nearly 30% over the past 5 years, outpacing the global e-commerce market CAGR of 21% in that same time frame. EL expects to continue double-digit growth in e-commerce and aims to double its online sales profit by 2023. In FY2019, EL shifted its advertising budget so that 75% of it went towards digital media, whereas beforehand, EL only spent 22% of its spend on digital channels. Perseverance of Skin Care: EL’s skin care products generate the most revenue out of all it’s product categories and, with the effects of the coronavirus pandemic, skin care sales across the entire industry have been increasing. According to NPD, skin care sales jumped 13% from January 2020 to February 2020, and Nielsen states that skin care sales are up 2% from March 2019 to March 2020. Historically, this category typically grows faster than the overall cosmetics market as well – see Chart 16. CEO Fabrizio Freda noted that “[c]consumers may cut back on buying cosmetics and perfumes as they are quarantined at home, but they continue to buy products that address their health and wellness while locked inside”, and it seems the effects of the pandemic cause consumers to purchase more than they usually would. Chart 15: Tall Flagship Sales (MM RMB) Source: Alltech Chart 16: Skin Care and Cosmetics Market Growth Source: L’Oréal
  • 9. EL May 4, 2020 Equity Analysis Alexander Lai, Equity Research Extern, (718) 962-4212, alai5@binghamton.eduPage 9 of 15 Gen Z Beauty Survey Survey Methodology: We surveyed 40 college students within the United States from a public university in the upstate New York area to gauge their shopping and usage patterns in regards to beauty products as well as their brand preferences. By age, 100% of them fell within the Generation Z category, indicating that their ages were between 7-22 years old. By gender, 47.5% of responders noted they were male and 52.5% noted they were female. Survey Results Our survey indicated that those in our sample size preferred EL over popular companies such as Avon or Coty – see Chart 17. This may indicate opportunities for EL to expand their core demographic. The typical EL customer is aged 35-55, falling in the Millennial or Gen X buckets, but developing products and marketing campaigns that appeal to a younger Gen Z audience could improve EL’s market share. Skin care was found to be the category with the top spend in our sample size, showing that perhaps skin care’s growth as an overall category is true for Gen Z as well and not just with EL’s target consumers – see Chart 18. The most important purchasing factor for our sample size was quality, with brand being a close second – See Chart 19. This supports the notion that Gen Z is highly knowledgeable when it comes to what they buy and that they understand what goes into an item and support only the brands they resonate with. However, 45% of our sample size noted they were open to trying new brands or products they were unfamiliar with – see Chart 20. It seems that during the COVID-19 pandemic, our sample size spent less on overall beauty products, most likely due to decrease in usage of cosmetics – see Chart 21. Chart 19: Beauty Product Purchasing Factors Chart 20: Willingness to Try New Beauty Products Chart 21: COVID-19 Pandemic Beauty Purchasing Habits Chart 17: Gen Z Beauty Company Preferences Source: Jefferies Chart 18: Beauty Product Spend by Category Source: Jefferies Source: Jefferies Source: Jefferies Source: Jefferies
  • 10. EL May 4, 2020 Equity Analysis Alexander Lai, Equity Research Extern, (718) 962-4212, alai5@binghamton.eduPage 10 of 15 Business Risks COVID-19 Slowing Retail Sales: The effects of COVID-19 have slowed in-person retail sales worldwide, and most physical stores across the world have been temporarily shut down. With the ongoing pandemic, many major cities with EL stores or third-party retailers in them have experienced a decrease in foot traffic as a result – see Chart 22. Traditional retail sales make up a large portion of the company’s revenue, and long-term closures of stores could severely impact their top line. EL’s retail stores remain shuttered in the Americas, Europe, the Middle East, and Africa at the moment, however, EL has begun to reopen stores in the Asia/Pacific region and are assessing when they can reopen the remaining locations in accordance with the authorities. Losing the High-Touch Factor: EL is known for their signature High-Touch approach, where they aim to create strong emotional bonds with their consumers through personalized experiences. This concept was founded over 60 years ago by the company’s founder, Estée Lauder, and manifests itself in stores through expert advice given by beauty consultants on the sales floor. Due to the pandemic, EL has lost its ability to connect with their target audience in person and this may result in them losing sales from loyal customers, but EL is attempting to change this through digital means. EL continues to innovate digitally and aims to interact with their consumers during this pandemic through online channels. Gary Chu, an online general manager for EL mentioned that “[l]livestreaming was something brand new [that they] tried” and that it “boomed during the pandemic”. They are also heavily promoting products featured on their e-commerce store through their social media accounts to help bolster online sales. Macy’s Store Closures: One of EL’s largest retail partners is Macy’s, which in the past has accounted for nearly 10% of the company’s overall revenue. Recently, Macy’s has been struggling to stay afloat, and as a cost-cutting measure, from now until 2023, Macy’s plans to shutter 125 stores, which is nearly a fifth of its locations. This plan by Macy’s may significantly impact EL’s revenues stemming from department stores over the next three years. Macy’s locations are currently closed due to the COVID-19 pandemic, so sales during this period may look similar to 2023 sales when Macy’s completes this initiative. However, in the next six to eight weeks, Macy’s plans to open all 775 of its stores, which may help recoup some sales for EL. Chart 22: Average Change in Major City Foot Traffic (5/4/20 – 5/11/20) Source: The Economist
  • 11. EL May 4, 2020 Equity Analysis Alexander Lai, Equity Research Extern, (718) 962-4212, alai5@binghamton.eduPage 11 of 15 Board of Directors Chart 23: Board of Directors Breakdown Source: Estée Lauder Name Current Position Previous Roles Education Stock Ownership Charlene Barshefsky Senior International Partner at Wilmer Hale U.S. Trade Representative Director at Intel and Starwood Hotels University of Wisconsin-Madison: Bachelor’s in English and Political Science The Catholic University of America: JD 61,411 shares (.03%) Rose Marie Bravo, CBE Retail and Marketing Consultant CEO at Burberry President at Saks Fifth Avenue Fordham University: Bachelor’s in English 8,000 shares Wei Sun Christianson MD & Co-CEO of Asia Pacific and CEO of China at Morgan Stanley Chairman of China at Citigroup Amherst College: BA in Political Science Columbia University: JD in International Law 4,104 shares Fabrizio Freda President and Chief Executive Officer at Estée Lauder President at Proctor and Gamble Strategic Planning at Gucci University of Naples Federico II: Economics and Business Administration 68,174 shares (.03%) Paul J. Fribourg Chairman and Chief Executive Officer at Continental Grain Company Director at Apollo Global Management, Loews, and Restaurant Brands International Amherst College: Bachelor’s in Business Administration and Economics 4,000 shares Irvine O. Hockaday Jr. CEO at Hallmark CEO at Kansas City Southern Industries Princeton University: AB in English University of Michigan: JD 11,740 shares (.01%) Jennifer Hyman Co-Founder and Chief Executive Officer at Rent the Runway Director at IMG Senior Manager at Starwood Hotels Harvard University: BA in Social Studies and MBA 2,000 shares Leonard A. Lauder Chairman Emeritus at Estée Lauder Chief Executive Officer at Estée Lauder Officer at U.S. Navy University of Pennsylvania: Bachelor’s Columbia University: Master’s Jane Lauder Global Brand President at Clinique Global President and General Manager of Origins, Joon, and Dauphin Brands Stanford University: Bachelor’s Ronald S. Lauder Chairman at Clinique Laboratories LLC Deputy Assistant Secretary of Defense at the U.S. Department of Defense University of Pennsylvania: Bachelor’s in International Business 6,364 Class A shares 9,409,895 Class B Shares (6.86%) William P. Lauder Executive Chairman at Estée Lauder CEO and COO at Estée Lauder Marketing Director at Clinique University of Pennsylvania: BS in Economics and International Marketing 10,468 Class A shares 8,515,960 Class B shares (6.21%) Richard D. Parsons Senior Advisor at Providence Equity Partners LLC Director and Chairman at Citigroup Albany Law School: JD 4,442 shares Lynn Forester de Rothschild Chair at E.L. Rothschild LLC Co-Chair of Field Fresh Foods Pomona College Columbia University 4,000 shares Barry S. Sternlicht Chairman and Chief Executive Officer at Starwood Capital Group Director at Baccarat, Restoration Hardware, Riviera Holdings, and TRI Pointe Brown University Harvard University: MBA 66,932 shares (.03%) Jennifer Tejada Chief Executive Officer at PagerDuty Inc. President and CEO at Keynote Systems EVP and CSO at Mincom University of Michigan: BA in Business Management and Organizational Behavior 2,000 shares Richard F. Annino Managing Director at CCMP Capital Advisors LLC CEO at Dow Jones EVP at Liz Claiborne Bentley College: BS in Finance and Economics Pace University: MBA in Finance
  • 12. EL May 4, 2020 Equity Analysis Alexander Lai, Equity Research Extern, (718) 962-4212, alai5@binghamton.eduPage 12 of 15 Board Composition: EL’s Board of Directors has 16 members, five of which serve as executives at EL – see Chart 23. Many of the board members come from financial backgrounds, hailing from firms such as Morgan Stanley, Providence Equity Partners, E.L. Rothschild, Starwood Capital Group, and CCMP Capital Advisors. Most members of the Board of Directors own a stake in the company, giving them incentive to help EL grow. Corporate Governance ISS Governance Quality Score Analysis: EL has an overall ISS Governance Quality Score of 10, scoring a 10 for both Shareholder Rights and Board, a 6 for Compensation, and a 1 for Audit – see Table 2. This overall score is the highest score possible and indicates that EL may have a high level of governance risk. The Audit component earning the lowest score of 1 indicates a low risk regarding the company’s audit policies. The Board component earned the highest score of 10, indicating a potential high risk in the board’s composition, practices, and policies. One potential reason why a 10 was earned could be due the Board of Directors having 16 members, when “[g]enterally, boards should not have . . . more than 15 members” (Institutional Shareholder Services). Another reason may be that the Board of Directors does not entirely consist of members independent of the company, and five of the 16 members of the board hold leadership roles within the company. The Shareholder Rights component earning the highest score of 10 indicates a potential high risk regarding shareholder voting practices. One potential reason why a 10 was earned could be due to most of the voting power stemming from Lauder-owned organizations. The Compensation component earning a mid-to-high score of 6, indicating a potential mid-to-high risk in the board’s compensation practices. This may be due the overly high compensation for the CEO, Fabrizio Freda. In 2019, Fabrizio’s compensation was ~$19M including base salary, bonuses, and performance share units (PSUs) when it was expected to be around 33% lower at around ~$14M based on performance objectives including corporate goals and objectives. Concluding Thoughts EL is prepared to handle the effects of COVID-19 and maintain a competitive advantage over is peers in the beauty industry going forward. We will have to closely monitor the company’s actions over the coming months. Our analyses, valuation, and catalysts imply a positive outlook for the firm’s performance and justify our Buy rating. Table 2: ISS Governance Quality Score Breakdown Source: Institutional Shareholder Services Audit 1 Board 10 Shareholder Rights 10 Compensation 6
  • 13. EL May 4, 2020 Equity Analysis Alexander Lai, Equity Research Extern, (718) 962-4212, alai5@binghamton.eduPage 13 of 15 Appendices
  • 14. EL May 4, 2020 Equity Analysis Alexander Lai, Equity Research Extern, (718) 962-4212, alai5@binghamton.eduPage 14 of 15 Source: Company Reports 1Q17 2Q17 3Q17 4Q17 FY 1Q18 2Q18 3Q18 4Q18 FY 1Q19 Q219 Q319 Q419 FY Sep-16 Dec-16 Mar-17 Jun-17 2017 Sep-17 Dec-17 Mar-18 Jun-18 2018 Sep-18 Dec-18 Mar-19 Jun-19 2019 Cash & equivalents 1,189 1,675 1,840 1,741 1,741 1,825 2,499 2,524 2,715 2,715 1,993 2,401 2,902 2,987 2,987 Accounts receivable 1,624 1,508 1,528 1,395 1,395 1,799 1,699 1,761 1,487 1,487 2,214 2,000 2,036 1,831 1,831 Inventories (incl. promotional merchandise) 1,296 1,278 1,310 1,479 1,479 1,518 1,445 1,533 1,618 1,618 1,681 1,651 1,814 2,006 2,006 Prepaid expenses & other current assets 292 328 294 349 349 365 332 351 348 348 361 388 408 388 388 0 0 0 0 0 0 0 0 0 0 0 0 0 0 0 Total current assets 4,401 4,789 4,972 4,964 $4,964 5,507 5,975 6,169 6,168 $6,168 6,249 6,440 7,160 7,212 $7,212 Property, plant and equipment 1,569 1,563 1,576 1,671 1,671 1,695 1,728 1,726 1,823 1,823 1,838 1,859 1,891 2,068 2,068 Operating lease right-of-use assets 0 0 0 0 0 0 0 0 0 0 0 0 0 0 0 Other assets 3,378 4,860 4,897 4,933 4,933 5,000 4,901 4,877 4,576 4,576 4,456 4,377 3,880 3,876 3,876 TOTAL ASSETS 9,348 11,212 11,445 11,568 $11,568 12,202 12,604 12,772 12,567 $12,567 12,543 12,676 12,931 13,156 $13,156 Short-term debt 592 2,143 519 189 189 552 413 296 183 183 183 18 516 516 516 Accounts payable 546 617 597 835 835 679 738 884 1,182 1,182 913 995 1,068 1,490 1,490 Accrued income taxes 0 0 0 0 0 0 0 0 0 0 0 0 0 Operating lease liabilities 0 0 0 0 0 0 0 0 0 0 0 0 0 0 0 Other current liabilities 1,574 1,698 1,744 1,799 1,799 1,911 2,252 2,208 1,945 1,945 2,467 2,763 2,647 2,599 2,599 Total current liabilities 2,712 4,458 2,860 2,823 $2,823 3,142 3,403 3,388 3,310 $3,310 3,563 3,776 4,231 4,605 $4,605 Long-term debt 1,908 1,890 3,377 3,383 3,383 3,383 3,374 3,363 3,361 3,361 3,361 3,373 2,883 2,896 2,896 Other non-current liabilities 1,053 1,056 1,073 960 1,046 924 1,238 1,284 1,186 1,046 1,189 1,194 1,200 1,244 1,046 Minority interest 0 0 0 0 0 0 0 0 0 0 0 0 0 0 0 Long-term operating lease liabilities 0 0 0 0 0 0 0 0 0 0 0 0 0 0 0 Total liabilities 5,673 7,404 7,310 7,166 $7,166 7,449 8,015 8,035 7,857 $7,857 8,113 8,343 8,314 8,745 $8,745 Total stockholders equity 3,675 3,808 4,135 4,402 4,402 4,753 4,589 4,737 4,710 4,710 4,430 4,333 4,617 4,411 4,411 Chart 25: Historical Balance Sheet Chart 24: Historical Income Statement 1Q17 2Q17 3Q17 4Q17 FY 1Q18 2Q18 3Q18 4Q18 FY 1Q19 Q219 Q319 Q419 FY Sep-16 Dec-16 Mar-17 Jun-17 2017 Sep-17 Dec-17 Mar-18 Jun-18 2018 Sep-18 Dec-18 Mar-19 Jun-19 2019 Net sales $2,865 $3,208 $2,857 $2,894 $11,824 $3,274 $3,744 $3,370 $3,295 $13,683 $3,524 $4,005 $3,744 $3,590 $14,863 % Change 1.1% 2.7% 7.5% 9.4% 5.0% 14.3% 16.7% 18.0% 13.9% 15.7% 7.6% 7.0% 11.1% 9.0% 8.6% Cost of sales 596 637 591 613 2,437 711 751 683 697 2,842 823 910 819 835 3,387 Gross profit $2,269 $2,571 $2,266 $2,281 $9,387 $2,563 $2,993 $2,687 $2,598 $10,841 $2,701 $3,095 $2,925 $2,755 $11,476 % Gross margin 79.2% 80.1% 79.3% 78.8% 79.4% 78.3% 79.9% 79.7% 78.8% 79.2% 76.6% 77.3% 78.1% 76.7% 77.2% SG&A 1,825 1,917 1,780 1,947 7,469 1,961 2,214 2,093 2,288 8,556 2,008 2,257 2,170 2,422 8,857 Operating income $418 $617 $427 $230 $1,692 568 712 497 277 $2,054 652 771 674 216 $2,313 % Operating margin 14.6% 19.2% 14.9% 7.9% 14.3% 17.3% 19.0% 14.7% 8.4% 15.0% 18.5% 19.3% 18.0% 6.0% 15.6% Interest expense, net 15 17 20 23 75 19 20 17 16 72 19 23 17 16 75 Other Expense (Income) (70) 1 (69) EBT $403 $600 $407 207 $1,617 549 692 480 261 $1,982 633 748 727 199 $2,307 D&A 106 112 107 139 464 127 129 133 142 531 132 137 135 149 553 EBITDA $524 $729 534 369 $2,156 695 841 630 419 $2,585 784 908 809 365 $2,866 Taxes 107 170 107 (23) 361 119 565 106 73 863 131 171 170 41 513 Minority interest (2) (2) (2) (1) (7) (3) (2) (2) (2) (9) (2) (4) (2) (1) (9) Net Income $294 $428 $298 $229 $1,249 $427 $125 $372 $186 $1,110 $500 $573 $555 $157 $1,785 Source: Company Reports
  • 15. EL May 4, 2020 Equity Analysis Alexander Lai, Equity Research Extern, (718) 962-4212, alai5@binghamton.eduPage 15 of 15 Chart 26: Historical Cash Flow Statement 1Q17 2Q17 3Q17 4Q17 FY 1Q18 2Q18 3Q18 4Q18 FY 1Q19 2Q19 Q319 Q419 FY Sep-16 Dec-16 Mar-17 Jun-17 2017 Sep-17 Dec-17 Mar-18 Jun-18 2018 Sep-18 Dec-18 Mar-19 Jun-19 2019 Net earnings 296 726 1,026 1,256 1,256 430 555 929 1,117 1,117 502 1,079 1,636 1,794 1,794 Adjustments to reconcile net earnings to net cash flows: Depreciation and amortization 106 218 337 464 464 127 256 389 531 531 132 269 404 557 557 Amortization of purchased royalty rights 0 0 0 0 0 0 0 0 0 0 0 0 0 0 0 Deferred income taxes (32) (55) (84) (118) (118) (3) 106 84 175 175 (9) (46) (46) (66) (66) Non-cash stock compensation 88 134 175 219 219 57 132 196 236 236 58 131 201 0 0 Excess tax benefits from stock-based compensation arrangements (10) (14) (37) (45) (45) 0 0 0 0 0 0 0 0 0 0 Loss on disposal of fixed assets (7) (7) (4) 5 5 3 7 12 15 15 3 5 6 0 0 Minority interest 0 0 0 0 0 0 0 0 0 0 0 0 0 0 0 Non-cash portion of restructuring and other non-recurring expenses 1 3 3 3 3 0 1 1 1 1 0 0 0 0 0 Other non-cash items 16 25 24 (5) (5) 8 15 (30) (77) (77) (3) 39 14 234 234 Discontinued operations, net of tax 0 0 0 0 0 0 0 0 0 0 0 0 0 0 0 Cumulative effect of change in accounting principle 0 0 0 0 0 0 0 0 0 0 0 0 0 0 0 Changes in operating assets and liabilities: Increase in accounts receivable, net (365) (243) (242) (92) (92) (390) (281) (325) (105) (105) (546) (343) (377) (169) (169) Decrease (increase) in inventory and promotional merchandise, Net (31) 78 59 (85) (85) (16) 66 0 (147) (147) (36) (21) (184) (375) (375) Increase in other assets 4 (32) (30) (80) (80) 13 12 1 12 12 (18) (53) (73) (62) (62) Decrease in accounts payable (170) (143) (168) 54 54 (166) (111) 20 349 349 (262) (174) (105) 604 604 Increase in accrued income taxes (46) 0 0 224 224 0 0 0 0 0 0 0 0 0 0 Increase in other accrued liabilities 0 134 193 - - 30 692 654 466 466 60 387 280 0 0 Decrease in other non-current liabilities 0 0 0 0 0 0 Net cash flows used for operating activities of discontinued operations 0 0 0 0 Net cash provided by (used in) operating activities ($150) $824 $1,252 $1,800 $1,800 $93 $1,450 $1,931 $2,573 $2,573 ($119) $1,273 $1,756 $2,517 $2,517 Capital expenditures (85) (208) (316) (504) (504) (116) (263) (368) (629) (629) (128) (292) (441) (744) (744) Capital expenditures of discontinued operations 0 0 0 0 0 0 0 0 0 0 0 0 0 Acquisition of businesses (net of acquired cash) (10) (1,690) (1,690) (1,681) (1,681) (11) (11) (11) (11) (11) 0 0 0 0 0 Proceeds from disposition of long-term investments 365 637 955 1,226 1,226 0 609 716 749 749 173 271 1,229 1,215 1,215 Purchase of long-term investments (336) (466) (1,067) (1,267) (1,267) (148) (479) (492) (478) (478) (14) (14) (14) (100) (100) Proceeds from divestitures/other 12 12 12 311 0 0 0 0 0 0 0 0 0 Net cash used in investing activities ($66) ($1,727) ($2,106) ($2,214) ($2,214) $36 ($144) ($155) ($369) ($369) $31 ($35) $774 $371 $371 Increase (decrease) in short-term debt, net 263 1,817 194 165 165 362 222 106 (8) (8) (3) (169) (167) (167) (167) Proceeds from issuance of long-term debt, net (2) (3) 1,498 1,498 1,498 0 (1) 0 0 0 0 0 (1) (466) (466) Debt issuance costs 0 0 (10) (11) (11) 0 0 0 0 0 0 0 0 0 0 Proceeds from the net settlement of Treasure Lock agreements 0 0 0 0 0 0 0 0 0 0 0 0 0 0 0 Repayments and redemptions of long-term debt 0 0 (4) (306) (306) 0 0 (1) (2) (2) 0 0 0 0 0 Net proceeds from employee stock transactions 26 41 94 186 186 48 83 157 182 182 0 0 0 0 0 Excess tax benefits from stock-based compensation arrangements 10 14 37 0 0 0 0 0 0 0 33 59 154 154 154 Acquisition of treasury stock (222) (363) (363) (413) (413) (111) (398) (676) (759) (759) (530) (1,126) (1,344) (1,555) (1,555) Dividends paid (111) (236) (361) (486) (486) (126) (267) (407) (546) (546) (141) (297) (453) (609) (609) Distributions made to minority holders & other 0 0 (2) (3) (3) 0 (1) (1) (39) (39) (1) (3) (3) (75) (75) Proceeds from the issuance of commercial paper 0 0 0 0 0 0 0 0 0 0 0 0 0 Net cash provided by (used in) financing activities ($36) $1,270 $1,083 $630 $630 $173 ($362) ($822) ($1,172) ($1,172) ($642) ($1,536) ($1,814) ($2,718) ($2,718) Source: Company Reports