Download to read offline
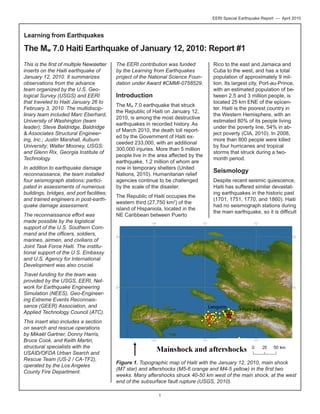
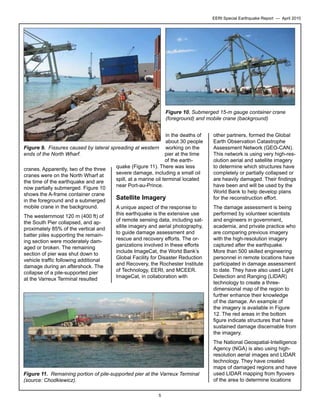

The document summarizes observations from an advance team that traveled to Haiti after the January 12, 2010 Mw 7.0 earthquake. Key points: - The earthquake caused widespread damage in Port-au-Prince and beyond, with over 230,000 deaths reported. - The team installed seismographs, assessed building damage, and trained engineers in post-earthquake assessment. - No surface faulting was found, though soil liquefaction contributed to damage. The majority of buildings surveyed in Port-au-Prince and Leogane were damaged or collapsed, largely due to lack of seismic design and construction practices.


