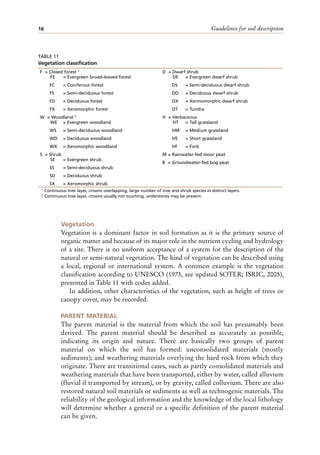
The document provides comprehensive guidelines for soil description, emphasizing the importance of reliable soil data for effective land use and management. It outlines procedures for soil classification, site evaluation, and the identification of soil characteristics, drawing from various international standards. The guidelines aim to standardize soil description practices for better communication and understanding in soil science research and applications.


![Chapter 3 – Soil formation factors 13
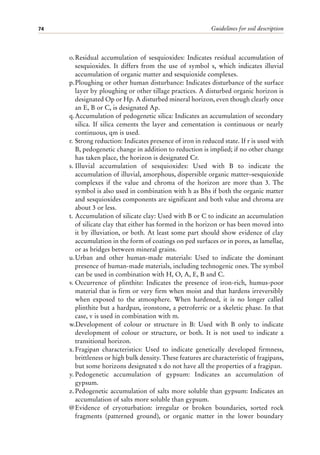
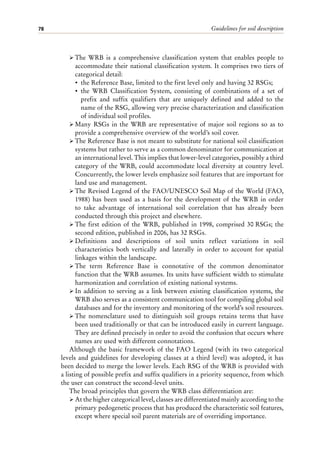
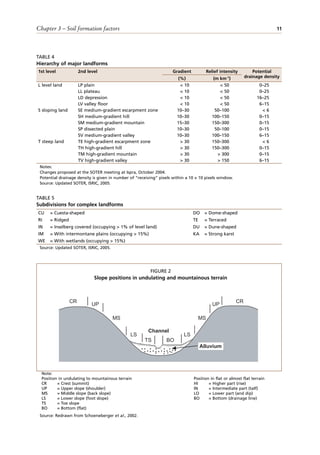
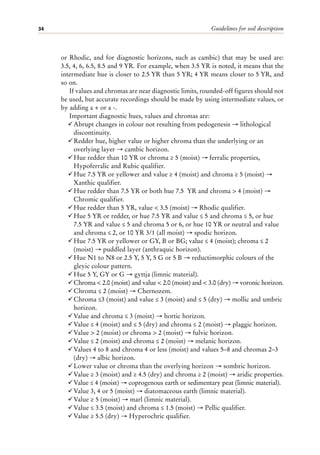
The orientation that a slope is facing is coded N for north, E for east, S for
south and W for west; for example, SSW means south-southwest.
LAND USE AND VEGETATION
Land use
Land use applies to the current use of the land, whether agricultural or non-
agricultural, in which the soil is located. Land use has a major influence on the
direction and rate of soil formation; its recording enhances the interpretative value
of the soil data considerably (Table 8).
For arable land use, the dominant crops grown should be mentioned (section
on crops [below]), and as much information as possible given on soil management,
use of fertilizers, duration of fallow period, rotation systems and yields.
Crops
Crops are plants that are cultivated for their economic value. Information on
crops is important because it gives an idea of the nature of soil disturbance as a
result of crop management practices as well as the nutrient and soil management
requirements of the crop. Information on crops can be given in a general or detailed
way as required. Examples for the most common crops with their recommended
codes are given in Table 9.
Human influence
This item refers to any evidence of human activity that is likely to have affected
the landscape or the physical and chemical properties of the soil. Erosion is dealt
with separately in Chapter 4. For various environments, it is useful to indicate
the degree of disturbance of the natural vegetation. The existing vegetation is
described in the section on vegetation (below).
Examples of human influences with their recommended codes are given in
Table 10.
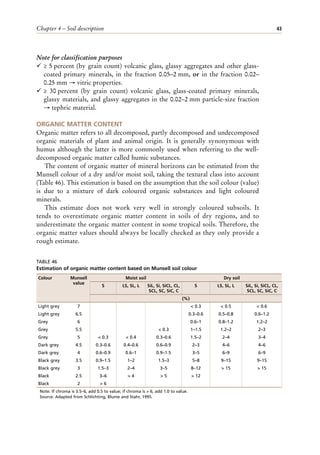
Note for classification purposes
¸ Constructed terraces → Escalic qualifier.
¸ Raised land surfaces → plaggic and terric horizons.
¸ Ploughing → anthraquic and anthric horizons and Aric qualifier.
¸ Special depth limits if plough layers are present → Fluvisols, Chernozems and
Cambisols.
¸ Special requirements if an eluvial horizon is part of a plough layer → argic and
natric horizons.
¸ Does not form part of a plough layer → cambic horizon.
¸ Mixing or soil layers or lumps of applied lime → anthric horizon.
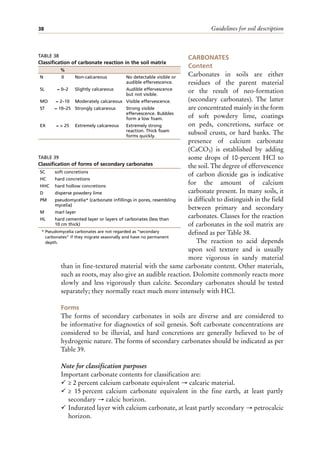
¸ Spade marks → plaggic horizon.](https://image.slidesharecdn.com/guidelinesforsoildescription-220117141405/85/Guidelines-for-soil-description-24-320.jpg)

![Chapter 4 – Soil description 29
¸ A texture of sand, loamy sand, sandy loam or silt loam or a combination of
them → plaggic horizon.
¸ A higher clay content than the underlying soil and relative differences among
medium, fine and very fine sand and clay < 20 percent → irragric horizon.
¸ A texture of sandy clay loam, clay loam, silty clay loam or finer → takyric
horizon.
¸ ≥ 8 percent clay in the underlying layer and within 7.5 cm either doubling of
the clay content if the overlying layer has less then 20 percent or 20 percent
(absolute) more clay → abrupt textural change.
¸ An abrupt change in particle-size distribution that is not solely associated with
a change in clay content resulting from pedogenesis or a relative change of
≥ 20 percent in the ratios between coarse sand, medium sand, and fine sand →
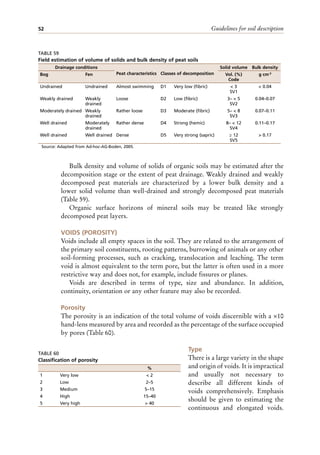
lithological discontinuity.
¸ The required amount of organic carbon depends on the clay content, if the layer
is saturated with water for ≥ 30 consecutive days in most years → organic and
mineral materials.
¸ The required amount of organic carbon depends on the texture → aridic
properties.
¸ The depth where an argic horizon starts depends on the texture → Alisols,
Acrisols, Luvisols and Lixisols, and Alic, Acric, Luvic and Lixic qualifiers.
¸ An argic horizon in which the clay content does not decrease by 20 percent of
more (relative) from its maximum within 150 cm → Profondic qualifier.
¸ An absolute clay increase of ≥ 3 percent → Hypoluvic qualifier.
¸ A silt/clay ratio < 0.6 → Hyperalic qualifier.
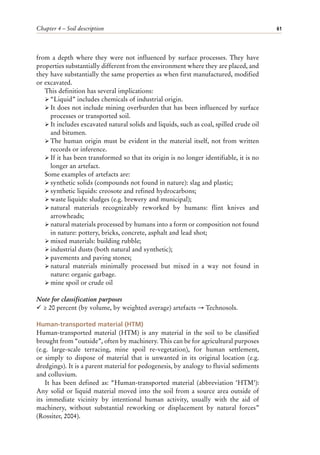
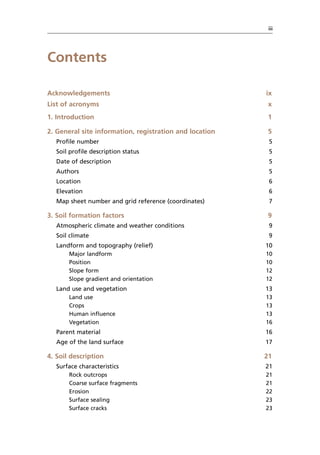
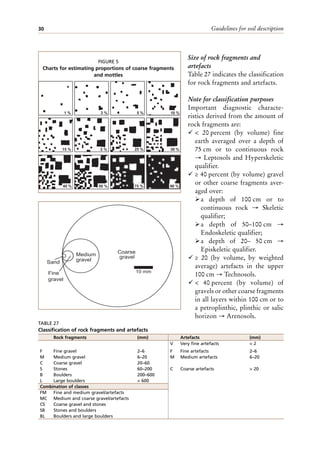
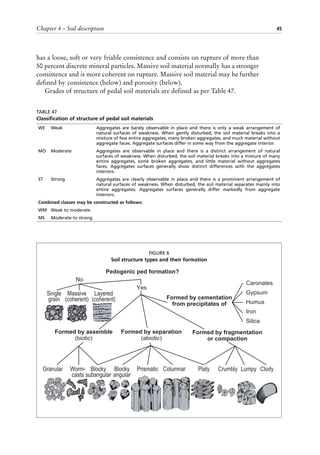
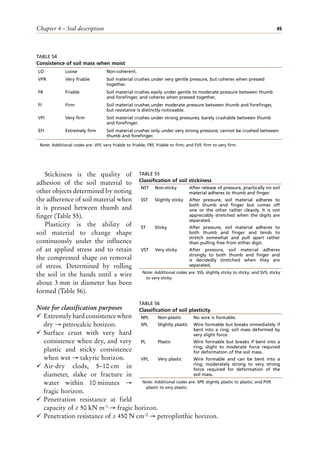
Rock fragments and artefacts
The presence of rock fragments influences the nutrient status, water movement,
use and management of the soil. It also reflects the origin and stage of development
of the soil.
Artefacts (sections on artefacts and description of artefacts [below]) are useful
for identifying colluviation, human occupation, and industrial processes.
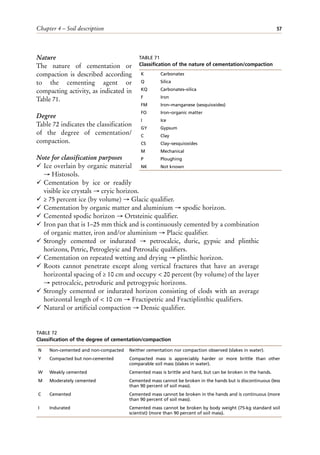
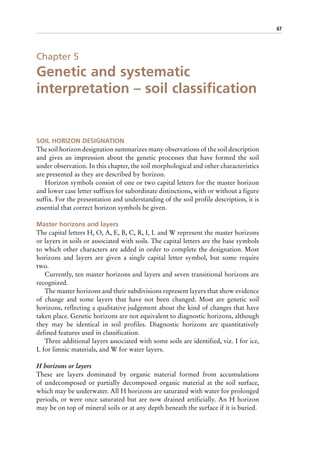
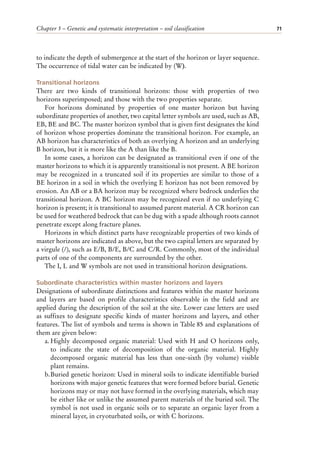
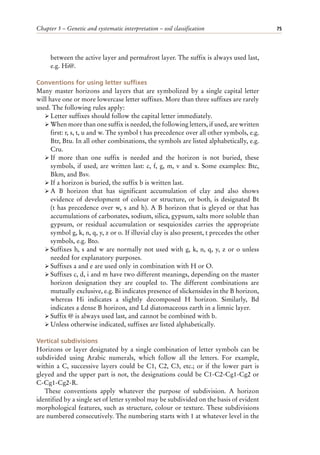
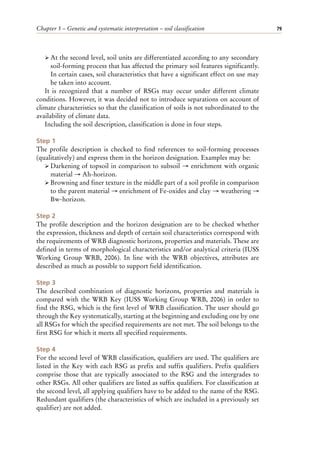
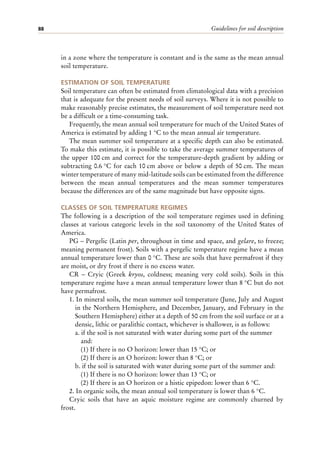
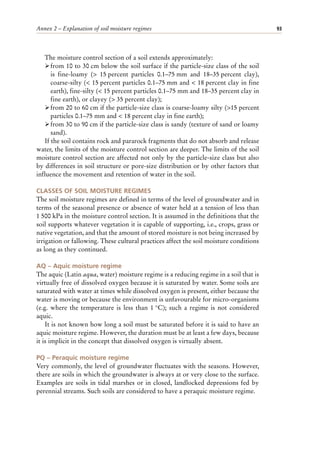
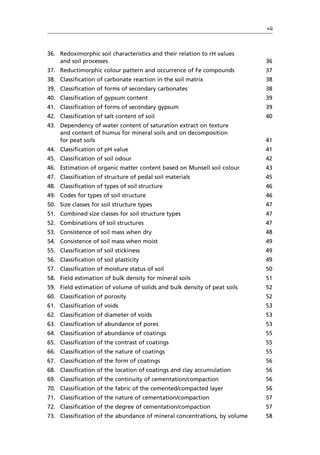
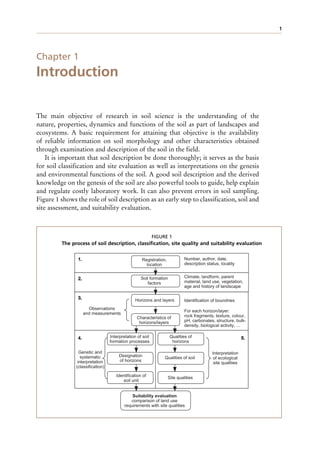
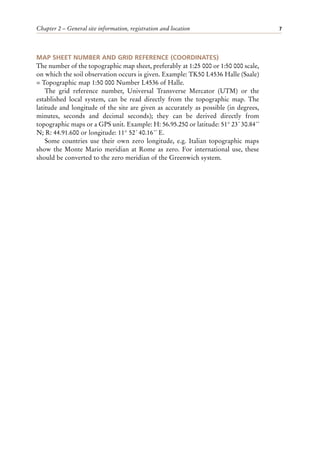
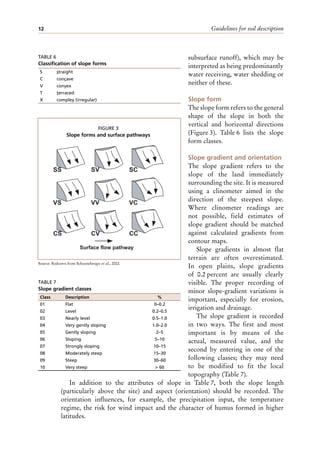
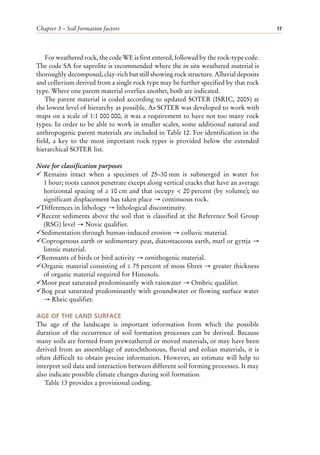
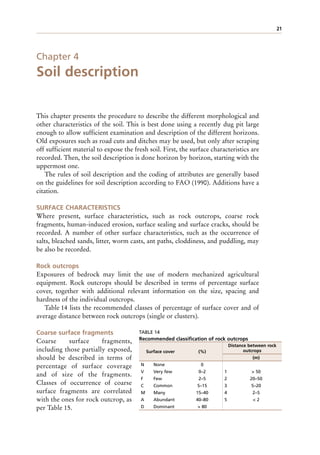
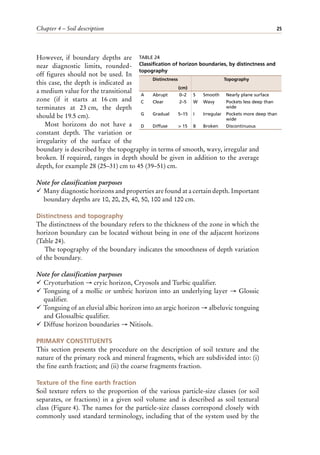
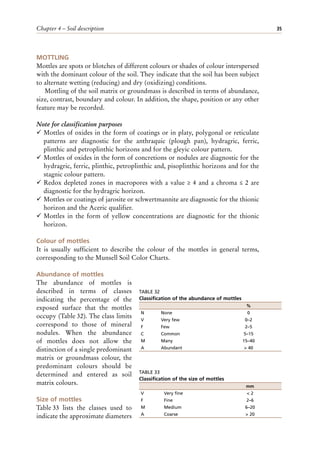
Large rock and mineral fragments (> 2 mm) and artefacts are described
according to abundance, size, shape, state of weathering, and nature of the
fragments. The abundance class
limits correspond with the ones
for surface coarse fragments and
mineral nodules, and the 40-
percent boundary coincides with
the requirement for the skeletic
phase (Table 26 and Figure 5).
Where rock fragments are not
distributed regularly within a
horizon but form a “stone line”,
this should be indicated clearly.
TABLE 26
Abundance of rock fragments and artefacts, by volume
%
N None 0
V Very few 0–2
F Few 2–5
C Common 5–15
M Many 15–40
A Abundant 40–80
D Dominant > 80
S Stone line any content, but concentrated at a distinct
depth of a horizon](https://image.slidesharecdn.com/guidelinesforsoildescription-220117141405/85/Guidelines-for-soil-description-40-320.jpg)
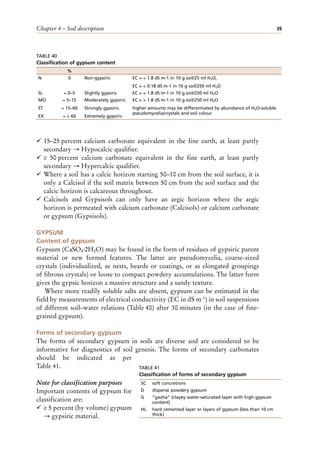
![Guidelines for soil description
40
¸ ≥ 5 percent (by mass) gypsum
and ≥ 1 percent (by volume)
secondary gypsum → gypsic
horizon.
¸ Indurated layer with ≥
5 percent (by mass) gypsum
and ≥ 1 percent (by volume)
secondary gypsum →
petrogypsic horizon.
¸ 15–25 percent (by mass)
gypsum and ≥ 1 percent (by
volume) secondary gypsum →
Hypogypsic qualifier.
¸ ≥ 50 percent (by mass) gypsum and ≥ 1 percent (by volume) secondary gypsum
→ Hypergypsic qualifier.
¸ Gypsisols can only have an argic horizon if the argic horizon is permeated with
calcium carbonate or gypsum.
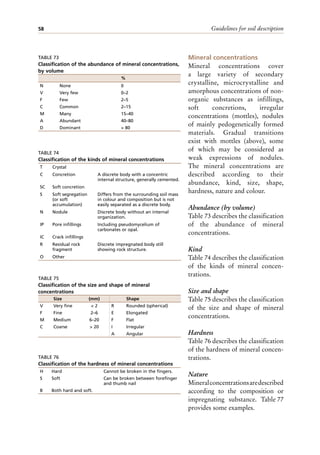
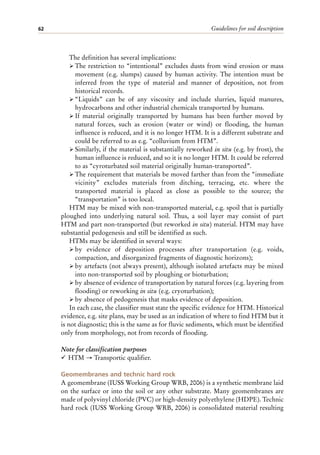
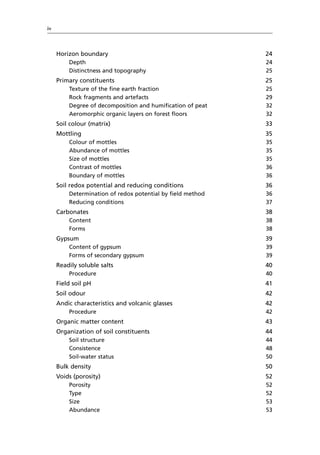
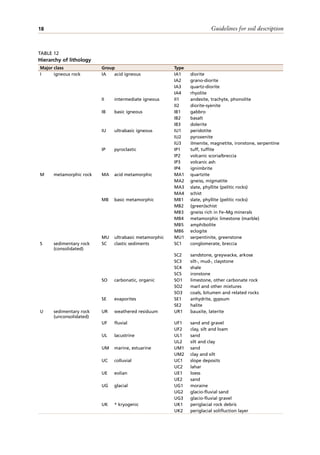
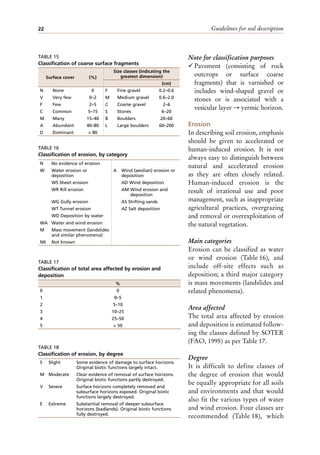
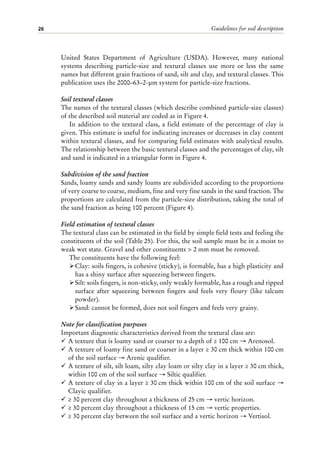
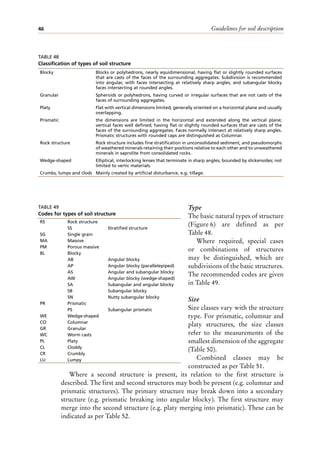
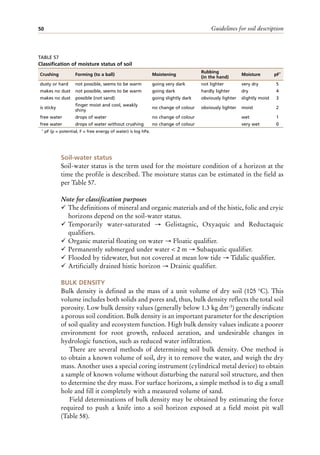
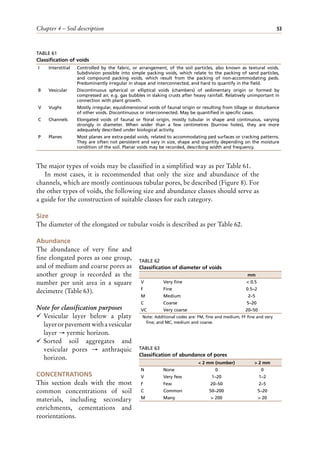
READILY SOLUBLE SALTS
Coastal or desert soils can be especially enriched with water-soluble salts or salts
more soluble than gypsum (CaSO4·2H2O; log Ks = -4.85 at 25 °C). The salt content
of the soil can be estimated roughly from an EC (in dS m-1 = mS cm-1) measured in
a saturated soil paste or a more diluted suspension of soil in water (Richards, 1954).
Conventionally, EC is measured in the laboratory in the saturation extract (ECSE).
Most classification values and data about salt sensitivity of crops refer to ECSE.
An easier and more comfortable method of determining EC in the field is to
use a 20 g soil/50 ml H2O (aqua dest) suspension (EC2.5) and to calculate ECSE
depending on the texture and content of organic matter (Table 43).
Procedure
Use a transparent plastic cup with marks for 8 cm3 soil (~ 10 g) and 25 ml water and
mix carefully with a plastic stick. The EC is measured with a field conductometer
after 30 minutes in the clear solution. Use water with an EC < 0.01 dS m-1.
The salt content (NaCl equivalent) can be estimated from EC2.5 by:
salt [%] = EC2.5 [mS cm-1] · 0.067 · 2.5.
The EC2.5 can be converted to ECSE depending on the texture and content of
humus according to the formula below and Table 43.
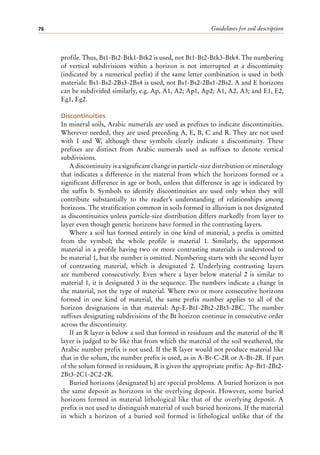
Note for classification purposes
¸ Threshold values of ≥ 8 and ≥ 15 dS m-1 (ECSE, 25 °C) → salic horizon.
¸ ≥ 4 dS m-1 (ECSE, 25°C) in at least some layer within 100 cm → Hyposalic
qualifier.
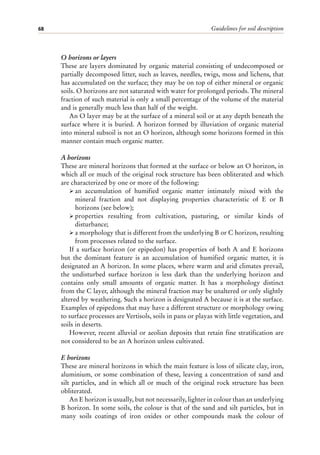
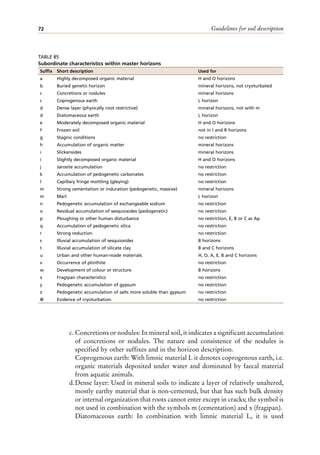
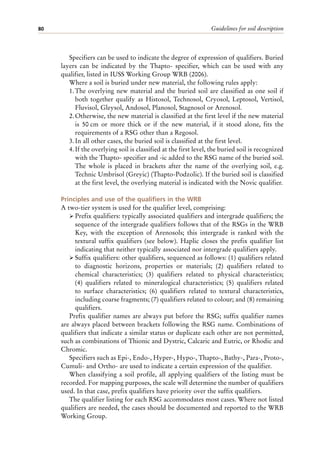
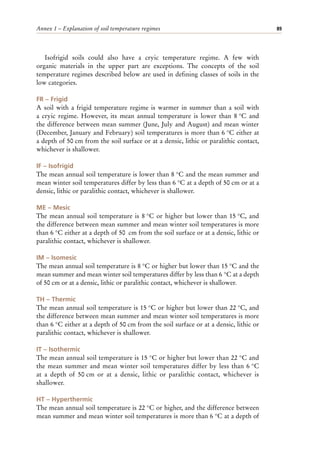
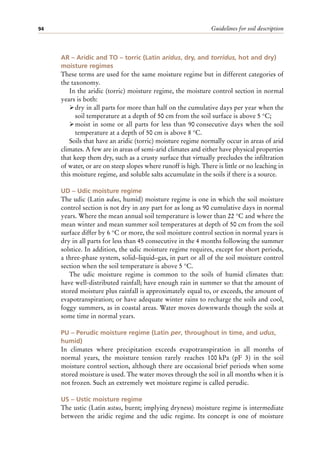
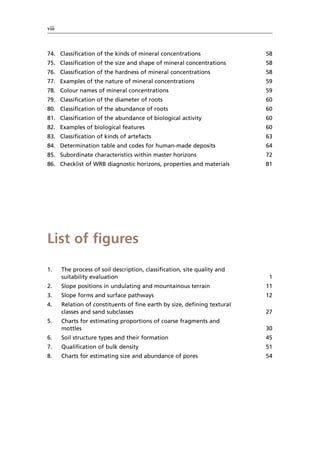
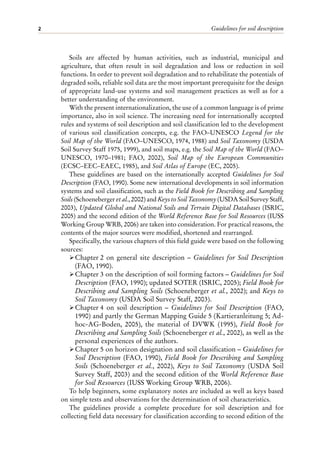
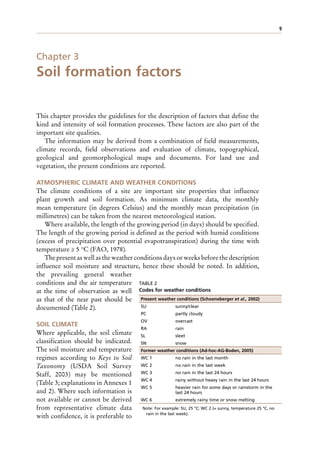
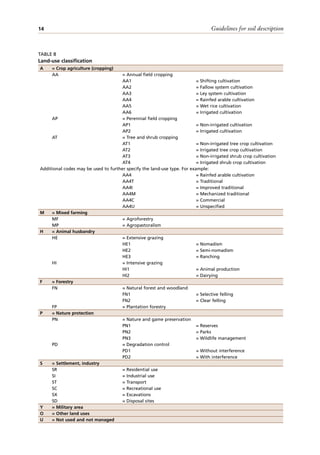
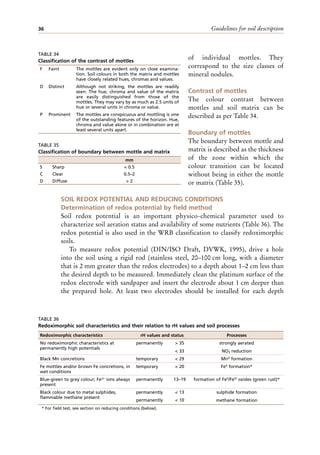
TABLE 42
Classification of salt content of soil
ECSE = dS m-1 (25 ºC)
N (nearly)Not salty < 0.75
SL Slightly salty 0.75–2
MO Moderately salty 2–4
ST Strongly salty 4–8
VST Very strongly salty 8–15
EX Extremely salty > 15
Source: DVWK, 1995.](https://image.slidesharecdn.com/guidelinesforsoildescription-220117141405/85/Guidelines-for-soil-description-51-320.jpg)
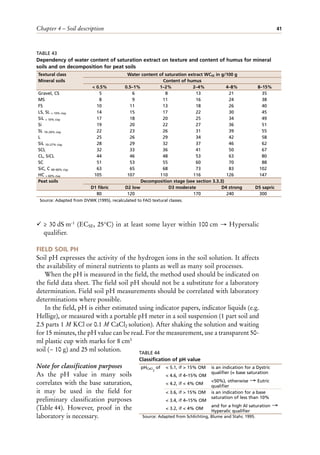
![Guidelines for soil description
44
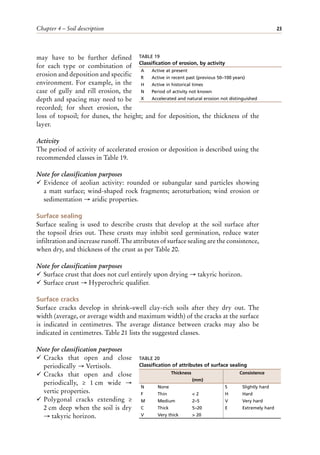
Note for classification purposes
¸ If saturated with water for ≥ 30 consecutive days in most years (unless drained):
≥ [12 + (clay percentage of the mineral fraction × 0.1)]% organic carbon or
≥ 18 percent organic carbon, else ≥ 20 percent organic carbon → organic
material.
¸ Organic material saturated with water for ≥ 30 consecutive days in most years
(unless drained) → histic horizon.
¸ Organic material saturated with water for < 30 consecutive days in most years
→ folic horizon.
¸ Weighted average of ≥ 6 percent organic carbon, and ≥ 4 percent organic carbon
in all parts → fulvic and melanic horizon.
¸ Organic carbon content of ≥ 0.6 percent → mollic and umbric horizon.
¸ Organic carbon content of ≥ 1.5 percent → voronic horizon.
(Note: the ratio of organic carbon to organic matter is about 1:1.7–2.)
Write the range or average value in the description sheet.
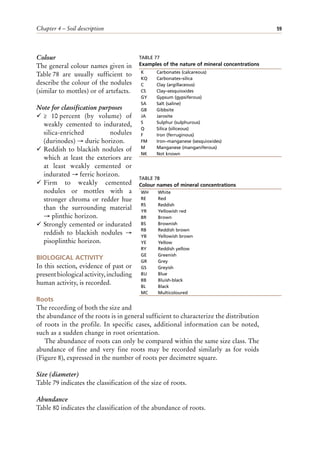
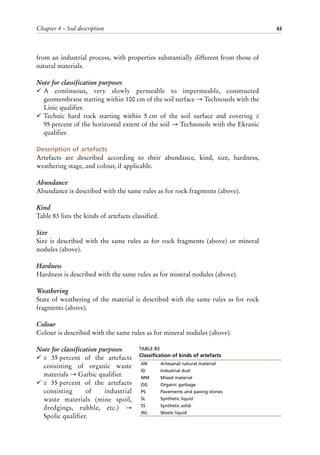
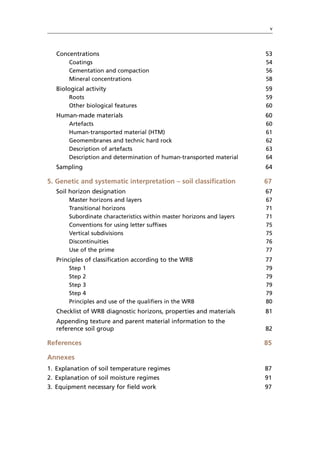
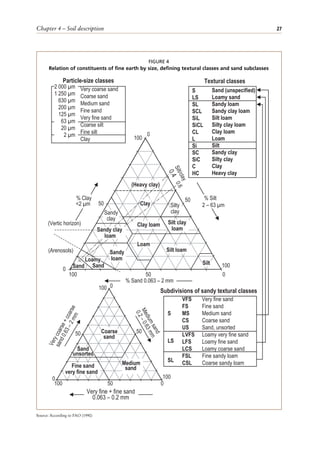
ORGANIZATION OF SOIL CONSTITUENTS
This section describes the primary physical organization of arrangement of the
soil constituents, together with the consistence of the constituents. Primary
organization is considered as being the overall arrangement of the soil mass
without concentrations, reorientations and biological additions. It will not always
be possible to make clear distinctions between primary and secondary elements of
the organization. Voids (pores), which relate to the structural organization of soil,
are described in a later section.
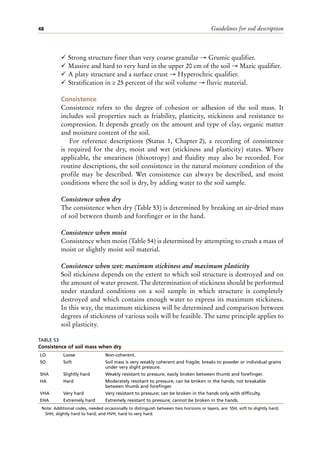
Soil structure
Soil structure refers to the natural organization of soil particles into discrete soil
units (aggregates or peds) that result from pedogenic processes. The aggregates
are separated from each other by pores or voids. It is preferred to describe the
structure when the soil is dry or slightly moist. In moist or wet conditions, it is
advisable to leave the description of structure to a later time when the soil has
dried out. For the description of soil structure, a large lump of the soil should be
taken from the profile, from various parts of the horizon if necessary, rather than
observing the soil structure in situ.
Soil structure is described in terms of grade, size and type of aggregates. Where a
soil horizon contains aggregates of more than one grade, size or type, the different
kinds of aggregates should be described separately and their relationship indicated.
Grade
In describing the grade or development of the structure, the first division is into
apedal soils (lacking soil structure) and pedal soils (showing soil structure).
In apedal or structureless soil, no aggregates are observable in place and there
is no definite arrangement of natural surfaces of weakness. Structureless soils are
subdivided into single grain and massive (see below). Single-grain soil material](https://image.slidesharecdn.com/guidelinesforsoildescription-220117141405/85/Guidelines-for-soil-description-55-320.jpg)
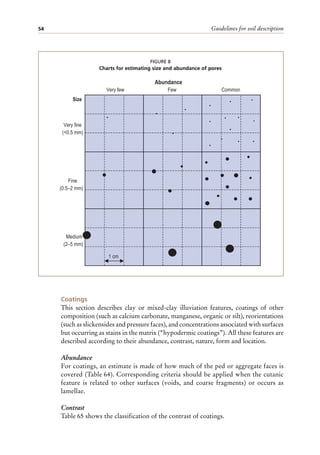
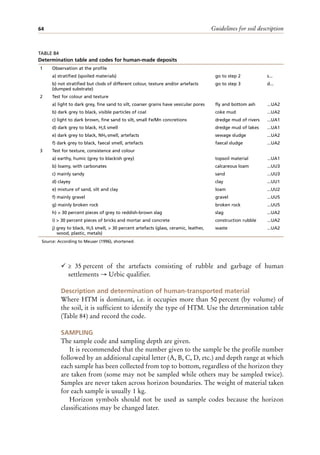
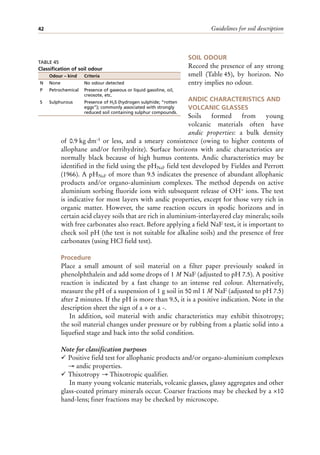
![Chapter 4 – Soil description 55
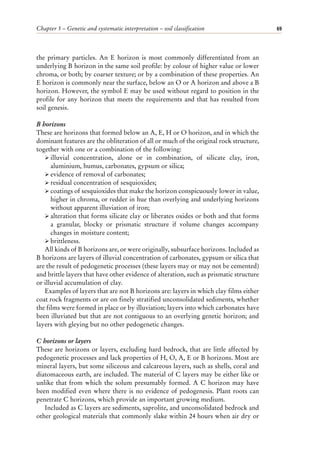
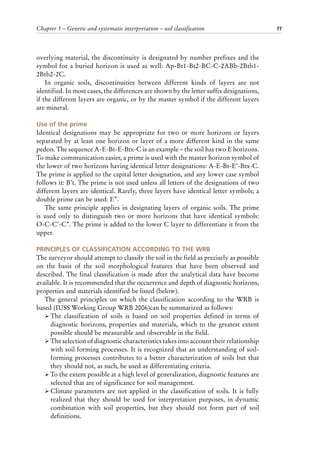
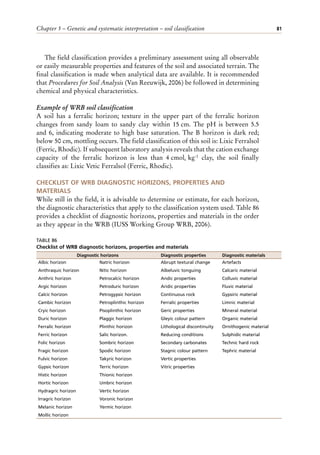
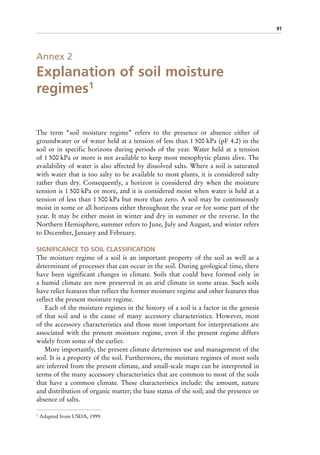
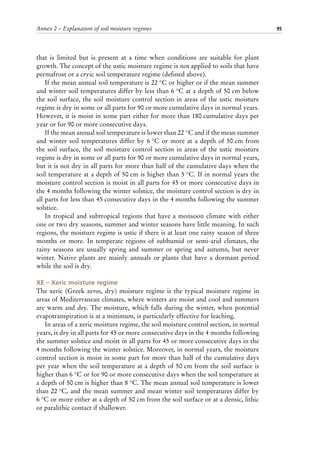
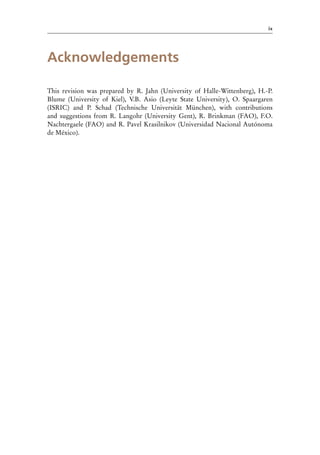
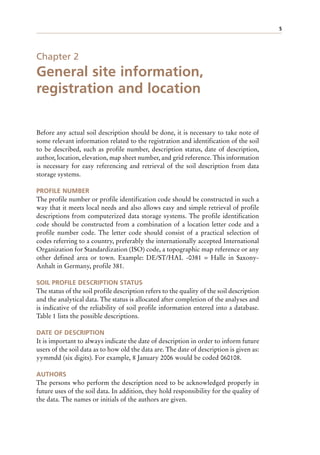
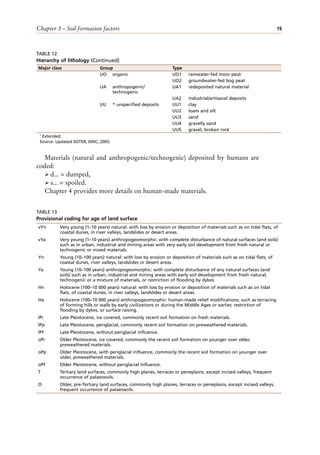
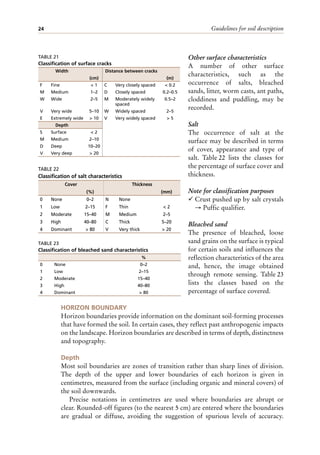
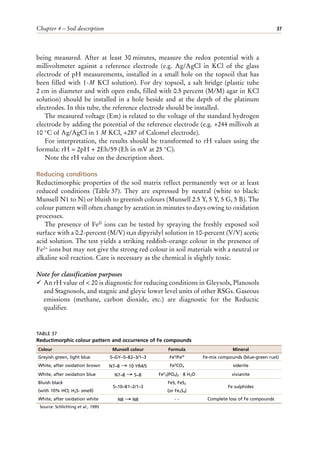
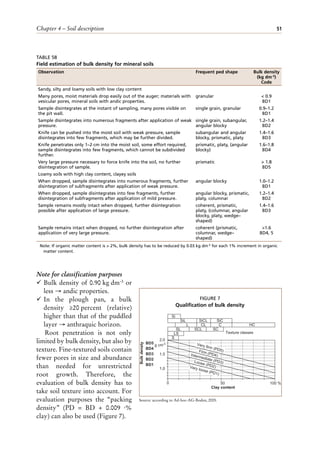
TABLE 64
Classification of abundance of coatings
%
N None 0
V Very few 0–2
F Few 2–5
C Common 5–15
M Many 15–40
A Abundant 40–80
D Dominant > 80
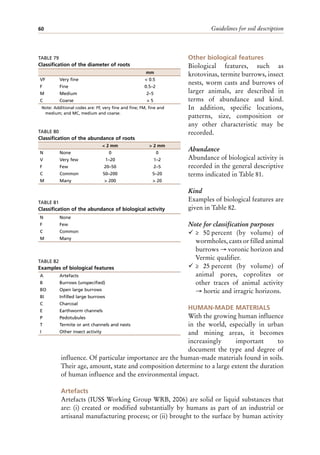
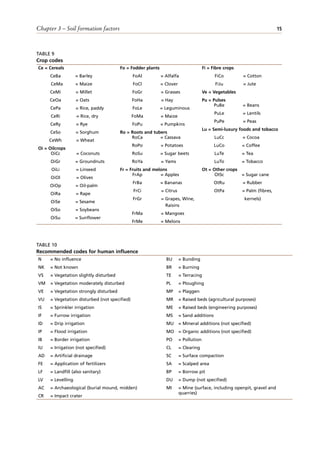
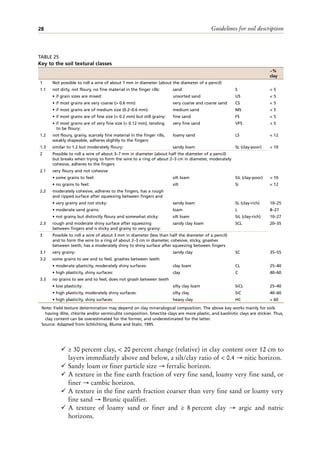
TABLE 65
Classification of the contrast of coatings
F Faint Surface of coating shows only little contrast in
colour, smoothness or any other property to the
adjacent surface. Fine sand grains are readily
apparent in the cutan. Lamellae are less than
2 mm thick.
D Distinct Surface of coating is distinctly smoother or
different in colour from the adjacent surface.
Fine sand grains are enveloped in the coating
but their outlines are still visible. Lamellae are
2–5 mm thick.
P Prominent Surface of coatings contrasts strongly in
smoothness or colour with the adjacent surfaces.
Outlines of fine sand grains are not visible.
Lamellae are more than 5 mm thick.
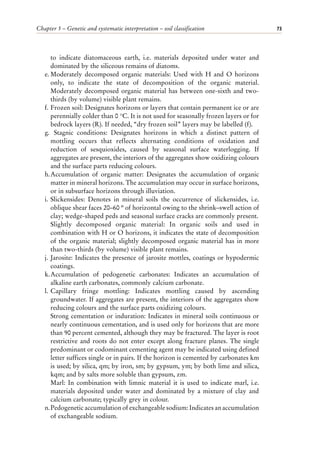
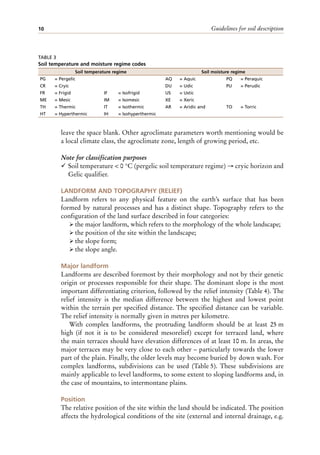
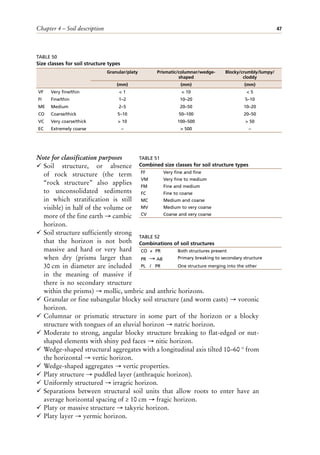
Nature
The nature of coatings may be
described as per Table 66.
Form
For some coatings, the form
may be informative for their
genesis (Table 67). For example,
manganese and iron–manganese
coatings of dendroidal form
indicate their formation owing to
poor infiltration and periodically
reductive conditions because of
percolating water.
Location
The location of the coatings or
clay accumulation is indicated
(Table 68). For pressure faces and
slickensides, no location is given
because they are by definition
located on pedfaces.
TABLE 66
Classification of the nature of coatings
C Clay
S Sesquioxides
H Humus
CS Clay and sesquioxides
CH Clay and humus (organic matter)
CC Calcium carbonate
GB Gibbsite
HC Hypodermic coatings (Hypodermic coatings, as used here, are field-scale features, commonly only expressed
as hydromorphic features. Micromorphological hypodermic coatings include non-redox features [Bullock et
al., 1985].)
JA Jarosite
MN Manganese
SL Silica (opal)
SA Sand coatings
ST Silt coatings
SF Shiny faces (as in nitic horizon)
PF Pressure faces
SI Slickensides, predominantly intersecting (Slickensides are polished and grooved ped surfaces that are
produced by aggregates sliding one past another.)
SP Slickensides, partly intersecting
SN Slickensides, non intersecting
Source: Adapted from Schoeneberger et al, 2002.](https://image.slidesharecdn.com/guidelinesforsoildescription-220117141405/85/Guidelines-for-soil-description-66-320.jpg)
![Guidelines for soil description
56
Note for classification purposes
¸ Evidence of silica accumulation,
e.g. as coatings → petroduric
horizon.
¸ Slickensides → vertic horizon
and vertic properties.
¸ Evidence of clay illuviation →
argic and natric horizons.
¸ Cracked coatings on sand grains
→ spodic horizon.
¸ Uncoated sand and silt grains →
Greyic qualifier.
¸ Clay coatings in the argic
horizon → Cutanic qualifier.
¸ Illuviation in the form of
lamellae in the argic, natric and
spodic horizon → Lamellic
qualifier.
¸ Coatings that have a different
colour from the matrix (section
on mottling [above]).
Cementation and compaction
The occurrence of cementation or
compaction in pans or otherwise is
described according to its nature,
continuity, structure, agent and
degree.
Compacted material has a firm
or stronger consistence when
moist and a close packing of
particles. Cemented material does
not slake after 1 hour of immersion
in water.
Continuity
Table 69 indicates the classification
of the continuity of cementation/
compaction.
Structure
The fabric or structure of the
cemented or compacted layer may
be described as per Table 70.
TABLE 67
Classification of the form of coatings
C Continuous
CI Continuous irregular (non-uniform, heterogeneous)
DI Discontinuous irregular
DE Dendroidal
DC Discontinuous circular
O Other
TABLE 68
Classification of the location of coatings and clay
accumulation
P Pedfaces
PV Vertical pedfaces
PH Horizontal pedfaces
CF Coarse fragments
LA Lamellae (clay bands)
VO Voids
BR Bridges between sand grains
NS No specific location
TABLE 69
Classification of the continuity of cementation/compaction
B Broken The layer is less than 50 percent cemented
or compacted, and shows a rather irregular
appearance.
D Discontinuous The layer is 50–90 percent cemented or
compacted, and in general shows a regular
appearance.
C Continuous The layer is more than 90 percent
cemented or compacted, and is only
interrupted in places by cracks or fissures.
TABLE 70
Classification of the fabric of the cemented/compacted
layer
P Platy The compacted or cemented parts are plate-
like and have a horizontal or subhorizontal
orientation.
V Vesicular The layer has large, equidimensional voids
that may be filled with uncemented material.
P Pisolithic The layer is largely constructed from
cemented spherical nodules.
D Nodular The layer is largely constructed from
cemented nodules or concretions of irregular
shape.](https://image.slidesharecdn.com/guidelinesforsoildescription-220117141405/85/Guidelines-for-soil-description-67-320.jpg)