
Recommended
More Related Content
What's hot
What's hot (18)
Similar to Guidelines for ratios
Similar to Guidelines for ratios (20)
More from Rakesh Bhaskar
More from Rakesh Bhaskar (16)
Recently uploaded
Recently uploaded (20)
Guidelines for ratios
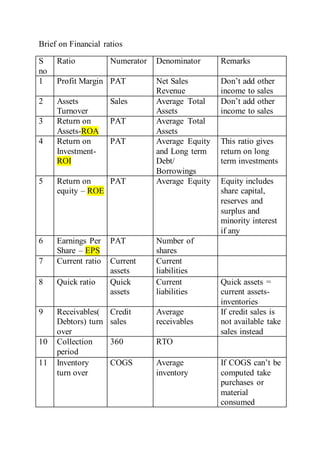
- 1. Brief on Financial ratios S no Ratio Numerator Denominator Remarks 1 Profit Margin PAT Net Sales Revenue Don’t add other income to sales 2 Assets Turnover Sales Average Total Assets Don’t add other income to sales 3 Return on Assets-ROA PAT Average Total Assets 4 Return on Investment- ROI PAT Average Equity and Long term Debt/ Borrowings This ratio gives return on long term investments 5 Return on equity – ROE PAT Average Equity Equity includes share capital, reserves and surplus and minority interest if any 6 Earnings Per Share – EPS PAT Number of shares 7 Current ratio Current assets Current liabilities 8 Quick ratio Quick assets Current liabilities Quick assets = current assets- inventories 9 Receivables( Debtors) turn over Credit sales Average receivables If credit sales is not available take sales instead 10 Collection period 360 RTO 11 Inventory turn over COGS Average inventory If COGS can’t be computed take purchases or material consumed
- 2. 12 Inventory holding period or conversion period 360 ITO 13 Debt Equity ratio Long term debt or borrowing Equity 14 Liabilities to equity ratio All liabilities Equity 15 Interest cover EBIT Interest expenses EBIT does not include exceptional items but include other income 16 PE ratio Market Price per share EPS 17 Dividend yield Dividend per share Market price per share Dividend include interim dividend and final dividend 18 Price Book ratio Market Price per share Book value per share Book value per share is equity divided by number of shares Three factor Dupont model PAT Sales Total assets ---------- * ---------- * ------------- Sales Total assets Equity
- 3. To compare earnings quality of different companies, please make a table like the following Co-1 Co-2 Co-3 Co-4 Co-5 Co-6 Co-7 Other income (A) Exceptional items net (B) C=A+B Profit before tax (D) C as a % of D For the purpose of cash flow comparison make a table like this Co-1 Co-2 Co-3 Co-4 Co-5 Co-6 Co-7 Net operating cash flow Net investing cash flow Net financing cash flow