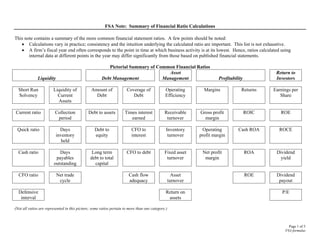
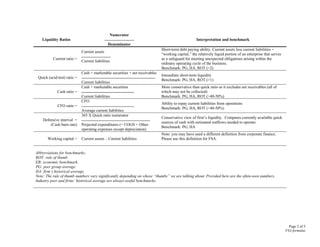
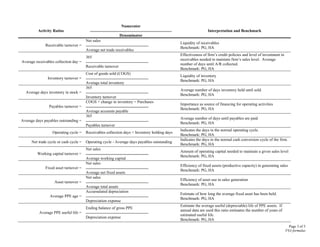
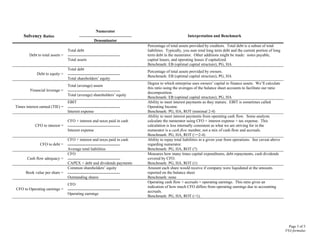
SlideShare a Scribd company logo
1 of 5
Download to read offline
FSA Note: Summary of Financial Ratio Calculations
This note contains a summary of the more common financial statement ratios. A few points should be noted:
• Calculations vary in practice; consistency and the intuition underlying the calculated ratio are important. This list is not exhaustive.
• A firm’s fiscal year end often corresponds to the point in time at which business activity is at its lowest. Hence, ratios calculated using
internal data at different points in the year may differ significantly from those based on published financial statements.
Pictorial Summary of Common Financial Ratios
Liquidity Debt Management
Asset
Management Profitability
Return to
Investors
Short Run
Solvency
Liquidity of
Current
Assets
Amount of
Debt
Coverage of
Debt
Operating
Efficiency
Margins Returns Earnings per
Share
Current ratio Collection
period
Debt to assets Times interest
earned
Receivable
turnover
Gross profit
margin
ROIC ROE
Quick ratio Days
inventory
held
Debt to
equity
CFO to
interest
Inventory
turnover
Operating
profit margin
Cash ROA ROCE
Cash ratio Days
payables
outstanding
Long term
debt to total
capital
CFO to debt Fixed asset
turnover
Net profit
margin
ROA Dividend
yield
CFO ratio Net trade
cycle
Cash flow
adequacy
Asset
turnover
ROE Dividend
payout
Defensive
interval
Return on
assets
P/E
(Not all ratios are represented in this picture; some ratios pertain to more than one category.)
Page 1 of 5
FSA formulas
Liquidity Ratios
Numerator
Denominator
Interpretation and benchmark
Current ratio =
Current assets
Current liabilities
Short-term debt paying ability. Current assets less current liabilities =
“working capital,” the relatively liquid portion of an enterprise that serves
as a safeguard for meeting unexpected obligations arising within the
ordinary operating cycle of the business.
Benchmark: PG, HA, ROT (>2)
Quick (acid-test) ratio =
Cash + marketable securities + net receivables
Current liabilities
Immediate short-term liquidity
Benchmark: PG, HA, ROT (>1)
Cash ratio =
Cash + marketable securities
Current liabilities
More conservative than quick ratio as it excludes net receivables (all of
which may not be collected)
Benchmark: PG, HA, ROT (>40-50%)
CFO ratio =
CFO
Average current liabilities
Ability to repay current liabilities from operations
Benchmark: PG, HA, ROT (>40-50%)
Defensive interval =
(Cash burn rate)
365 X Quick ratio numerator
Projected expenditures (= COGS + Other
operating expenses except depreciation)
Conservative view of firm’s liquidity. Compares currently available quick
sources of cash with estimated outflows needed to operate.
Benchmark: PG, HA
Working capital = Current assets – Current liabilities
Note: you may have used a different definition from corporate finance.
Please use this definition for FSA.
Abbreviations for benchmarks:
ROT: rule of thumb.
EB: economic benchmark.
PG: peer group average.
HA: firm’s historical average.
Note: The rule of thumb numbers vary significantly depending on whose “thumbs” we are talking about. Provided here are the often-seen numbers.
Industry peer and firms’ historical average are always useful benchmarks.
Page 2 of 5
FSA formulas
Activity Ratios
Numerator
Denominator
Interpretation and Benchmark
Receivable turnover =
Net sales
Average net trade receivables
Liquidity of receivables
Benchmark: PG, HA
Average receivables collection day =
365
Receivable turnover
Effectiveness of firm’s credit policies and level of investment in
receivables needed to maintain firm’s sales level. Average
number of days until A/R collected.
Benchmark: PG, HA
Inventory turnover =
Cost of goods sold (COGS)
Average total inventory
Liquidity of inventory
Benchmark: PG, HA
Average days inventory in stock =
365
Inventory turnover
Average number of days inventory held until sold.
Benchmark: PG, HA
Payables turnover =
COGS + change in inventory = Purchases
Average accounts payable
Importance as source of financing for operating activities
Benchmark: PG, HA
Average days payables outstanding =
365
Payables turnover
Average number of days until payables are paid
Benchmark: PG, HA
Operating cycle = Receivables collection days + Inventory holding days
Indicates the days in the normal operating cycle.
Benchmark: PG, HA
Net trade cycle or cash cycle = Operating cycle - Average days payables outstanding
Indicates the days in the normal cash conversion cycle of the firm.
Benchmark: PG, HA
Working capital turnover =
Net sales
Average working capital
Amount of operating capital needed to maintain a given sales level
Benchmark: PG, HA
Fixed asset turnover =
Net sales
Average net fixed assets
Efficiency of fixed assets (productive capacity) in generating sales
Benchmark: PG, HA
Asset turnover =
Net sales
Average total assets
Efficiency of asset use in sales generation
Benchmark: PG, HA
Average PPE age =
Accumulated depreciation
Depreciation expense
Estimate of how long the average fixed asset has been held.
Benchmark: PG, HA
Average PPE useful life =
Ending balance of gross PPE
Depreciation expense
Estimate the average useful (depreciable) life of PPE assets. If
annual data are used this ratio estimates the number of years of
estimated useful life.
Benchmark: PG, HA
Page 3 of 5
FSA formulas
Profitability Ratios
Numerator
Denominator
Interpretation and Benchmark
Return on equity (ROE) =
Net income
Average total shareholders’ equity
Profitability of all equity investors’ investment
Benchmark: EB (Cost of equity capital), PG, HA
Return on assets (ROA) =
Net Income + Interest expense * (1-tax rate)
Average total assets
Overall profitability of assets. Sometimes called return on investment (ROI).
Benchmark: EB (WACC), PG, HA
Return on invested capital (ROIC) =
(See Course Note for details)
NOPAT = EBIT * (1- tax rate)
Average invested capital
Overall profitability of invested capital. Sometimes called return on capital
employed (ROCE) or return on net operating assets (RNOA).
Benchmark: EB (WACC), PG, HA
Gross profit margin on sales =
Net sales – COGS = Gross margin
Net sales
Captures the relation between sales generated and manufacturing (or merchandising)
costs
Benchmark: PG, HA
Operating Margin =
EBIT
Net sales
Measures profitability independently of an enterprise’s financing and tax positions
Benchmark: PG, HA
Net profit margin on sales =
Net income
Net Sales
Net income generated by each sales dollar
Benchmark: PG, HA
Cash return on assets =
CFO
Average total assets
Measures return on assets on “cash” basis.
Benchmark: PG, HA
Earnings per share (EPS) =
Net income less preferred dividends
Weighted common shares outstanding
Net income earned per common share
Benchmark: PG, HA
Price earnings ratio (P-E) =
Market price of stock
Earnings per share
Ratio of market price to earnings per share
Benchmark: PG, HA
Market to book ratio =
Market value of equity
Book value of equity
Ratio of the market’s valuation of the enterprise to the book value of the enterprise
on its financial statements.
Benchmark: PG, HA
Dividend Payout =
Cash dividends paid on common equity
Net income
Percentage of earnings distributed as cash dividends. Note: Some firms/analysts
calculate this using cash dividends declared in the numerator instead.
Benchmark: PG, HA
Dividend Yield =
Cash dividends paid per share of common equity
Price per share
Percentage of share price distributed as cash dividends
Benchmark: PG, HA
Page 4 of 5
FSA formulas
Solvency Ratios
Numerator
Denominator
Interpretation and Benchmark
Debt to total assets =
Total debt
Total assets
Percentage of total assets provided by creditors. Total debt is a subset of total
liabilities. Typically, you sum total long term debt and the current portion of long
term debt in the numerator. Other additions might be made: notes payable,
capital leases, and operating leases if capitalized.
Benchmark: EB (optimal capital structure), PG, HA
Debt to equity =
Total debt
Total shareholders’ equity
Percentage of total assets provided by owners.
Benchmark: EB (optimal capital structure), PG, HA
Financial leverage =
Total (average) assets
Total (average) shareholders’ equity
Degree to which enterprise uses owners’ capital to finance assets. We’ll calculate
this ratio using the averages of the balance sheet accounts to facilitate our ratio
decomposition.
Benchmark: EB (optimal capital structure), PG, HA
Times interest earned (TIE) =
EBIT
Interest expense
Ability to meet interest payments as they mature. EBIT is sometimes called
Operating Income.
Benchmark: PG, HA, ROT (minimal 2-4)
CFO to interest =
CFO + interest and taxes paid in cash
Interest expense
Ability to meet interest payments from operating cash flow. Some analysts
calculate the numerator using CFO + interest expense + tax expense. This
calculation is less internally consistent as what we are striving for in the
numerator is a cash flow number, not a mix of cash flow and accruals.
Benchmark: PG, HA, ROT (>=2-4)
CFO to debt =
CFO + interest and taxes paid in cash
Average total liabilities
Ability to repay total liabilities in a given year from operations. See caveat above
regarding numerator.
Benchmark: PG, HA, ROT (?)
Cash flow adequacy =
CFO
CAPEX + debt and dividends payments
Measures how many times capital expenditures, debt repayments, cash dividends
covered by CFO.
Benchmark: PG, HA, ROT (1)
Book value per share =
Common shareholders’ equity
Outstanding shares
Amount each share would receive if company were liquidated at the amounts
reported on the balance sheet
Benchmark: none
CFO to Operating earnings =
CFO
Operating earnings
Operating cash flow + accruals = operating earnings. This ratio gives an
indication of how much CFO differs from operating earnings due to accounting
accruals.
Benchmark: PG, HA, ROT (>1).
Page 5 of 5
FSA formulas

More Related Content

Similar to Financial Ratio Formula - Common financial

Financial Reports and Ratios
Financial Reports and RatiosFinancial Reports and Ratios
Financial Reports and Ratios
Miriam Smith
 
Financial Report Literacy Fall 2011
Financial Report Literacy Fall 2011Financial Report Literacy Fall 2011
Financial Report Literacy Fall 2011
Miriam Smith
 
Chapter 2 analysis of financial statements
Chapter 2 analysis of financial statementsChapter 2 analysis of financial statements
Chapter 2 analysis of financial statements
SamsonJohn14
 
Financial Management in Construction 5.pptx
Financial Management in Construction 5.pptxFinancial Management in Construction 5.pptx
Financial Management in Construction 5.pptx
Abdulfeta7
 
3. Financial Statement Analysis Interpretation- AC570 AMcM.pptx
3. Financial Statement Analysis  Interpretation- AC570 AMcM.pptx3. Financial Statement Analysis  Interpretation- AC570 AMcM.pptx
3. Financial Statement Analysis Interpretation- AC570 AMcM.pptx
sawantac2
 
Financial statement analysis[1]
Financial statement analysis[1]Financial statement analysis[1]
Financial statement analysis[1]
Karishma Agarwal
 

Similar to Financial Ratio Formula - Common financial (20)

"The Income Statement and Cash Flows" in Minneapolis 2011
"The Income Statement and Cash Flows" in Minneapolis 2011"The Income Statement and Cash Flows" in Minneapolis 2011
"The Income Statement and Cash Flows" in Minneapolis 2011
 
Financial Reports and Ratios
Financial Reports and RatiosFinancial Reports and Ratios
Financial Reports and Ratios
 
Business analysis ppt babasab patil
Business analysis ppt babasab patil Business analysis ppt babasab patil
Business analysis ppt babasab patil
 
Ratio analysis
Ratio analysisRatio analysis
Ratio analysis
 
Introduction to ratio analysis
Introduction to ratio analysisIntroduction to ratio analysis
Introduction to ratio analysis
 
Introduction to ratio analysis
Introduction to ratio analysisIntroduction to ratio analysis
Introduction to ratio analysis
 
Financial accounting
Financial accountingFinancial accounting
Financial accounting
 
Financial Report Literacy Fall 2011
Financial Report Literacy Fall 2011Financial Report Literacy Fall 2011
Financial Report Literacy Fall 2011
 
Chapter 2 analysis of financial statements
Chapter 2 analysis of financial statementsChapter 2 analysis of financial statements
Chapter 2 analysis of financial statements
 
Financial Management Module
Financial Management ModuleFinancial Management Module
Financial Management Module
 
Financial Management in Construction 5.pptx
Financial Management in Construction 5.pptxFinancial Management in Construction 5.pptx
Financial Management in Construction 5.pptx
 
Financial Ratio
Financial RatioFinancial Ratio
Financial Ratio
 
3. Financial Statement Analysis Interpretation- AC570 AMcM.pptx
3. Financial Statement Analysis  Interpretation- AC570 AMcM.pptx3. Financial Statement Analysis  Interpretation- AC570 AMcM.pptx
3. Financial Statement Analysis Interpretation- AC570 AMcM.pptx
 
B2 - Du pont and other ratios
B2 - Du pont and other ratiosB2 - Du pont and other ratios
B2 - Du pont and other ratios
 
Industry specific ratios and Financial Ratios
Industry specific ratios and Financial RatiosIndustry specific ratios and Financial Ratios
Industry specific ratios and Financial Ratios
 
Du Pont Presentation
Du Pont PresentationDu Pont Presentation
Du Pont Presentation
 
Business analysis ppt
Business analysis ppt Business analysis ppt
Business analysis ppt
 
C3
C3C3
C3
 
Financial statement analysis[1]
Financial statement analysis[1]Financial statement analysis[1]
Financial statement analysis[1]
 
UNDERSTANDING BASIC FINANCIAL STATEMENTS.pptx
UNDERSTANDING BASIC FINANCIAL STATEMENTS.pptxUNDERSTANDING BASIC FINANCIAL STATEMENTS.pptx
UNDERSTANDING BASIC FINANCIAL STATEMENTS.pptx
 

Recently uploaded

Obat Penggugur Kandungan Aman Bagi Ibu Menyusui 087776558899
Obat Penggugur Kandungan Aman Bagi Ibu Menyusui  087776558899Obat Penggugur Kandungan Aman Bagi Ibu Menyusui  087776558899
Obat Penggugur Kandungan Aman Bagi Ibu Menyusui 087776558899
Cara Menggugurkan Kandungan 087776558899
 
Jual obat aborsi Jogja ( 085657271886 ) Cytote pil telat bulan penggugur kand...
Jual obat aborsi Jogja ( 085657271886 ) Cytote pil telat bulan penggugur kand...Jual obat aborsi Jogja ( 085657271886 ) Cytote pil telat bulan penggugur kand...
Jual obat aborsi Jogja ( 085657271886 ) Cytote pil telat bulan penggugur kand...
Klinik kandungan
 
Abortion pills in Dammam Saudi Arabia | +966572737505 |Get Cytotec
Abortion pills in Dammam Saudi Arabia | +966572737505 |Get CytotecAbortion pills in Dammam Saudi Arabia | +966572737505 |Get Cytotec
Abortion pills in Dammam Saudi Arabia | +966572737505 |Get Cytotec
Abortion pills in Riyadh +966572737505 get cytotec
 

Recently uploaded (20)

Shrambal_Distributors_Newsletter_May-2024.pdf
Shrambal_Distributors_Newsletter_May-2024.pdfShrambal_Distributors_Newsletter_May-2024.pdf
Shrambal_Distributors_Newsletter_May-2024.pdf
 
Significant AI Trends for the Financial Industry in 2024 and How to Utilize Them
Significant AI Trends for the Financial Industry in 2024 and How to Utilize ThemSignificant AI Trends for the Financial Industry in 2024 and How to Utilize Them
Significant AI Trends for the Financial Industry in 2024 and How to Utilize Them
 
Black magic specialist in Canada (Kala ilam specialist in UK) Bangali Amil ba...
Black magic specialist in Canada (Kala ilam specialist in UK) Bangali Amil ba...Black magic specialist in Canada (Kala ilam specialist in UK) Bangali Amil ba...
Black magic specialist in Canada (Kala ilam specialist in UK) Bangali Amil ba...
 
Current scenario of Energy Retail utilities market in UK
Current scenario of Energy Retail utilities market in UKCurrent scenario of Energy Retail utilities market in UK
Current scenario of Energy Retail utilities market in UK
 
fundamentals of corporate finance 11th canadian edition test bank.docx
fundamentals of corporate finance 11th canadian edition test bank.docxfundamentals of corporate finance 11th canadian edition test bank.docx
fundamentals of corporate finance 11th canadian edition test bank.docx
 
amil baba in australia amil baba in canada amil baba in london amil baba in g...
amil baba in australia amil baba in canada amil baba in london amil baba in g...amil baba in australia amil baba in canada amil baba in london amil baba in g...
amil baba in australia amil baba in canada amil baba in london amil baba in g...
 
Obat Penggugur Kandungan Aman Bagi Ibu Menyusui 087776558899
Obat Penggugur Kandungan Aman Bagi Ibu Menyusui  087776558899Obat Penggugur Kandungan Aman Bagi Ibu Menyusui  087776558899
Obat Penggugur Kandungan Aman Bagi Ibu Menyusui 087776558899
 
Collecting banker, Capacity of collecting Banker, conditions under section 13...
Collecting banker, Capacity of collecting Banker, conditions under section 13...Collecting banker, Capacity of collecting Banker, conditions under section 13...
Collecting banker, Capacity of collecting Banker, conditions under section 13...
 
Webinar on E-Invoicing for Fintech Belgium
Webinar on E-Invoicing for Fintech BelgiumWebinar on E-Invoicing for Fintech Belgium
Webinar on E-Invoicing for Fintech Belgium
 
Certified Kala Jadu, Black magic specialist in Rawalpindi and Bangali Amil ba...
Certified Kala Jadu, Black magic specialist in Rawalpindi and Bangali Amil ba...Certified Kala Jadu, Black magic specialist in Rawalpindi and Bangali Amil ba...
Certified Kala Jadu, Black magic specialist in Rawalpindi and Bangali Amil ba...
 
Pension dashboards forum 1 May 2024 (1).pdf
Pension dashboards forum 1 May 2024 (1).pdfPension dashboards forum 1 May 2024 (1).pdf
Pension dashboards forum 1 May 2024 (1).pdf
 
Jual obat aborsi Jogja ( 085657271886 ) Cytote pil telat bulan penggugur kand...
Jual obat aborsi Jogja ( 085657271886 ) Cytote pil telat bulan penggugur kand...Jual obat aborsi Jogja ( 085657271886 ) Cytote pil telat bulan penggugur kand...
Jual obat aborsi Jogja ( 085657271886 ) Cytote pil telat bulan penggugur kand...
 
uk-no 1 kala ilam expert specialist in uk and qatar kala ilam expert speciali...
uk-no 1 kala ilam expert specialist in uk and qatar kala ilam expert speciali...uk-no 1 kala ilam expert specialist in uk and qatar kala ilam expert speciali...
uk-no 1 kala ilam expert specialist in uk and qatar kala ilam expert speciali...
 
Abortion pills in Dammam Saudi Arabia | +966572737505 |Get Cytotec
Abortion pills in Dammam Saudi Arabia | +966572737505 |Get CytotecAbortion pills in Dammam Saudi Arabia | +966572737505 |Get Cytotec
Abortion pills in Dammam Saudi Arabia | +966572737505 |Get Cytotec
 
Test bank for advanced assessment interpreting findings and formulating diffe...
Test bank for advanced assessment interpreting findings and formulating diffe...Test bank for advanced assessment interpreting findings and formulating diffe...
Test bank for advanced assessment interpreting findings and formulating diffe...
 
Certified Kala Jadu, Black magic specialist in Rawalpindi and Bangali Amil ba...
Certified Kala Jadu, Black magic specialist in Rawalpindi and Bangali Amil ba...Certified Kala Jadu, Black magic specialist in Rawalpindi and Bangali Amil ba...
Certified Kala Jadu, Black magic specialist in Rawalpindi and Bangali Amil ba...
 
劳伦森大学毕业证
劳伦森大学毕业证劳伦森大学毕业证
劳伦森大学毕业证
 
Q1 2024 Conference Call Presentation vF.pdf
Q1 2024 Conference Call Presentation vF.pdfQ1 2024 Conference Call Presentation vF.pdf
Q1 2024 Conference Call Presentation vF.pdf
 
The Pfandbrief Roundtable 2024 - Covered Bonds
The Pfandbrief Roundtable 2024 - Covered BondsThe Pfandbrief Roundtable 2024 - Covered Bonds
The Pfandbrief Roundtable 2024 - Covered Bonds
 
Pitch-deck CopyFinancial and MemberForex.ppsx
Pitch-deck CopyFinancial and MemberForex.ppsxPitch-deck CopyFinancial and MemberForex.ppsx
Pitch-deck CopyFinancial and MemberForex.ppsx
 

Financial Ratio Formula - Common financial

  • 1. FSA Note: Summary of Financial Ratio Calculations This note contains a summary of the more common financial statement ratios. A few points should be noted: • Calculations vary in practice; consistency and the intuition underlying the calculated ratio are important. This list is not exhaustive. • A firm’s fiscal year end often corresponds to the point in time at which business activity is at its lowest. Hence, ratios calculated using internal data at different points in the year may differ significantly from those based on published financial statements. Pictorial Summary of Common Financial Ratios Liquidity Debt Management Asset Management Profitability Return to Investors Short Run Solvency Liquidity of Current Assets Amount of Debt Coverage of Debt Operating Efficiency Margins Returns Earnings per Share Current ratio Collection period Debt to assets Times interest earned Receivable turnover Gross profit margin ROIC ROE Quick ratio Days inventory held Debt to equity CFO to interest Inventory turnover Operating profit margin Cash ROA ROCE Cash ratio Days payables outstanding Long term debt to total capital CFO to debt Fixed asset turnover Net profit margin ROA Dividend yield CFO ratio Net trade cycle Cash flow adequacy Asset turnover ROE Dividend payout Defensive interval Return on assets P/E (Not all ratios are represented in this picture; some ratios pertain to more than one category.) Page 1 of 5 FSA formulas
  • 2. Liquidity Ratios Numerator Denominator Interpretation and benchmark Current ratio = Current assets Current liabilities Short-term debt paying ability. Current assets less current liabilities = “working capital,” the relatively liquid portion of an enterprise that serves as a safeguard for meeting unexpected obligations arising within the ordinary operating cycle of the business. Benchmark: PG, HA, ROT (>2) Quick (acid-test) ratio = Cash + marketable securities + net receivables Current liabilities Immediate short-term liquidity Benchmark: PG, HA, ROT (>1) Cash ratio = Cash + marketable securities Current liabilities More conservative than quick ratio as it excludes net receivables (all of which may not be collected) Benchmark: PG, HA, ROT (>40-50%) CFO ratio = CFO Average current liabilities Ability to repay current liabilities from operations Benchmark: PG, HA, ROT (>40-50%) Defensive interval = (Cash burn rate) 365 X Quick ratio numerator Projected expenditures (= COGS + Other operating expenses except depreciation) Conservative view of firm’s liquidity. Compares currently available quick sources of cash with estimated outflows needed to operate. Benchmark: PG, HA Working capital = Current assets – Current liabilities Note: you may have used a different definition from corporate finance. Please use this definition for FSA. Abbreviations for benchmarks: ROT: rule of thumb. EB: economic benchmark. PG: peer group average. HA: firm’s historical average. Note: The rule of thumb numbers vary significantly depending on whose “thumbs” we are talking about. Provided here are the often-seen numbers. Industry peer and firms’ historical average are always useful benchmarks. Page 2 of 5 FSA formulas
  • 3. Activity Ratios Numerator Denominator Interpretation and Benchmark Receivable turnover = Net sales Average net trade receivables Liquidity of receivables Benchmark: PG, HA Average receivables collection day = 365 Receivable turnover Effectiveness of firm’s credit policies and level of investment in receivables needed to maintain firm’s sales level. Average number of days until A/R collected. Benchmark: PG, HA Inventory turnover = Cost of goods sold (COGS) Average total inventory Liquidity of inventory Benchmark: PG, HA Average days inventory in stock = 365 Inventory turnover Average number of days inventory held until sold. Benchmark: PG, HA Payables turnover = COGS + change in inventory = Purchases Average accounts payable Importance as source of financing for operating activities Benchmark: PG, HA Average days payables outstanding = 365 Payables turnover Average number of days until payables are paid Benchmark: PG, HA Operating cycle = Receivables collection days + Inventory holding days Indicates the days in the normal operating cycle. Benchmark: PG, HA Net trade cycle or cash cycle = Operating cycle - Average days payables outstanding Indicates the days in the normal cash conversion cycle of the firm. Benchmark: PG, HA Working capital turnover = Net sales Average working capital Amount of operating capital needed to maintain a given sales level Benchmark: PG, HA Fixed asset turnover = Net sales Average net fixed assets Efficiency of fixed assets (productive capacity) in generating sales Benchmark: PG, HA Asset turnover = Net sales Average total assets Efficiency of asset use in sales generation Benchmark: PG, HA Average PPE age = Accumulated depreciation Depreciation expense Estimate of how long the average fixed asset has been held. Benchmark: PG, HA Average PPE useful life = Ending balance of gross PPE Depreciation expense Estimate the average useful (depreciable) life of PPE assets. If annual data are used this ratio estimates the number of years of estimated useful life. Benchmark: PG, HA Page 3 of 5 FSA formulas
  • 4. Profitability Ratios Numerator Denominator Interpretation and Benchmark Return on equity (ROE) = Net income Average total shareholders’ equity Profitability of all equity investors’ investment Benchmark: EB (Cost of equity capital), PG, HA Return on assets (ROA) = Net Income + Interest expense * (1-tax rate) Average total assets Overall profitability of assets. Sometimes called return on investment (ROI). Benchmark: EB (WACC), PG, HA Return on invested capital (ROIC) = (See Course Note for details) NOPAT = EBIT * (1- tax rate) Average invested capital Overall profitability of invested capital. Sometimes called return on capital employed (ROCE) or return on net operating assets (RNOA). Benchmark: EB (WACC), PG, HA Gross profit margin on sales = Net sales – COGS = Gross margin Net sales Captures the relation between sales generated and manufacturing (or merchandising) costs Benchmark: PG, HA Operating Margin = EBIT Net sales Measures profitability independently of an enterprise’s financing and tax positions Benchmark: PG, HA Net profit margin on sales = Net income Net Sales Net income generated by each sales dollar Benchmark: PG, HA Cash return on assets = CFO Average total assets Measures return on assets on “cash” basis. Benchmark: PG, HA Earnings per share (EPS) = Net income less preferred dividends Weighted common shares outstanding Net income earned per common share Benchmark: PG, HA Price earnings ratio (P-E) = Market price of stock Earnings per share Ratio of market price to earnings per share Benchmark: PG, HA Market to book ratio = Market value of equity Book value of equity Ratio of the market’s valuation of the enterprise to the book value of the enterprise on its financial statements. Benchmark: PG, HA Dividend Payout = Cash dividends paid on common equity Net income Percentage of earnings distributed as cash dividends. Note: Some firms/analysts calculate this using cash dividends declared in the numerator instead. Benchmark: PG, HA Dividend Yield = Cash dividends paid per share of common equity Price per share Percentage of share price distributed as cash dividends Benchmark: PG, HA Page 4 of 5 FSA formulas
  • 5. Solvency Ratios Numerator Denominator Interpretation and Benchmark Debt to total assets = Total debt Total assets Percentage of total assets provided by creditors. Total debt is a subset of total liabilities. Typically, you sum total long term debt and the current portion of long term debt in the numerator. Other additions might be made: notes payable, capital leases, and operating leases if capitalized. Benchmark: EB (optimal capital structure), PG, HA Debt to equity = Total debt Total shareholders’ equity Percentage of total assets provided by owners. Benchmark: EB (optimal capital structure), PG, HA Financial leverage = Total (average) assets Total (average) shareholders’ equity Degree to which enterprise uses owners’ capital to finance assets. We’ll calculate this ratio using the averages of the balance sheet accounts to facilitate our ratio decomposition. Benchmark: EB (optimal capital structure), PG, HA Times interest earned (TIE) = EBIT Interest expense Ability to meet interest payments as they mature. EBIT is sometimes called Operating Income. Benchmark: PG, HA, ROT (minimal 2-4) CFO to interest = CFO + interest and taxes paid in cash Interest expense Ability to meet interest payments from operating cash flow. Some analysts calculate the numerator using CFO + interest expense + tax expense. This calculation is less internally consistent as what we are striving for in the numerator is a cash flow number, not a mix of cash flow and accruals. Benchmark: PG, HA, ROT (>=2-4) CFO to debt = CFO + interest and taxes paid in cash Average total liabilities Ability to repay total liabilities in a given year from operations. See caveat above regarding numerator. Benchmark: PG, HA, ROT (?) Cash flow adequacy = CFO CAPEX + debt and dividends payments Measures how many times capital expenditures, debt repayments, cash dividends covered by CFO. Benchmark: PG, HA, ROT (1) Book value per share = Common shareholders’ equity Outstanding shares Amount each share would receive if company were liquidated at the amounts reported on the balance sheet Benchmark: none CFO to Operating earnings = CFO Operating earnings Operating cash flow + accruals = operating earnings. This ratio gives an indication of how much CFO differs from operating earnings due to accounting accruals. Benchmark: PG, HA, ROT (>1). Page 5 of 5 FSA formulas