Download to read offline


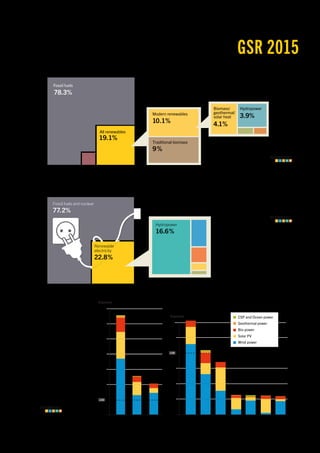

The 2015 Renewables Global Status Report highlights the significant growth and investment in renewable energy, particularly in the power sector, driven by policy support and technological advances. With renewable energy sources contributing to 19.1% of global final energy consumption in 2013, the report emphasizes the importance of renewables in tackling climate change, creating economic opportunities, and providing energy access. However, challenges persist, including fossil fuel subsidies and the need for further policy support for renewable heating, cooling, and transportation sectors.


