Download to read offline
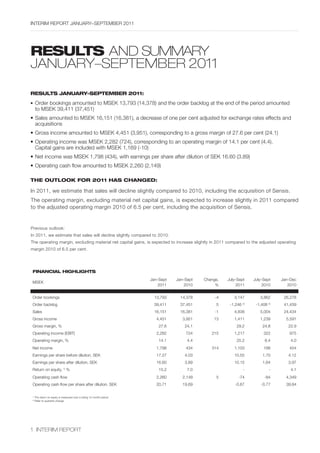
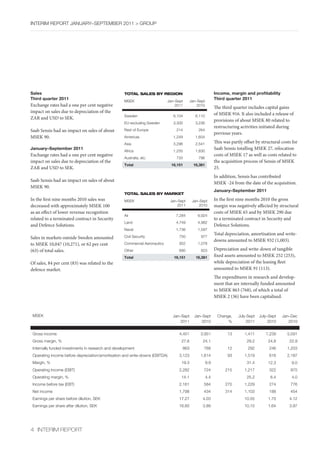
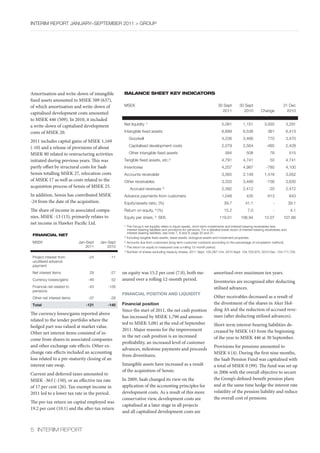
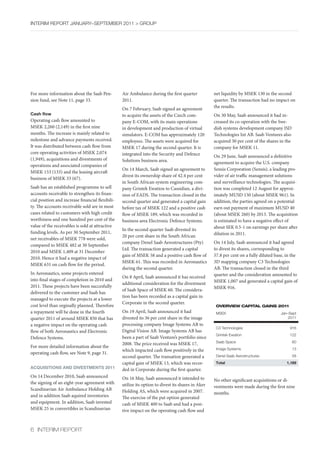
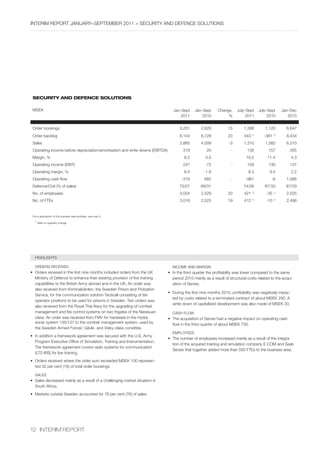
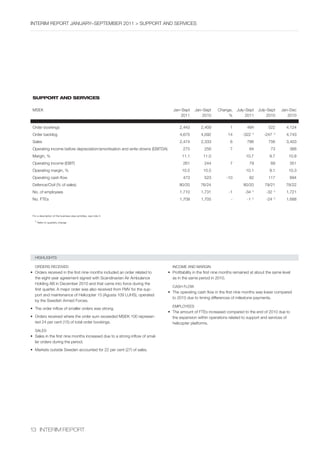
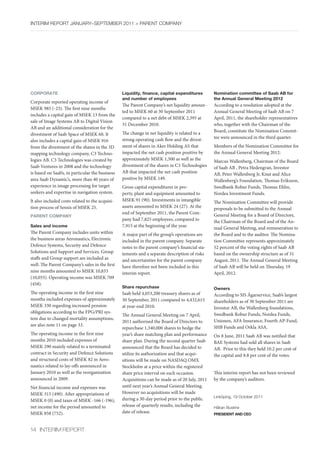
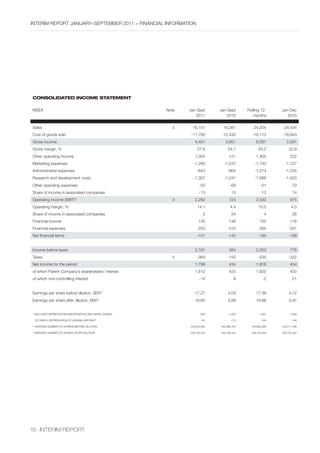
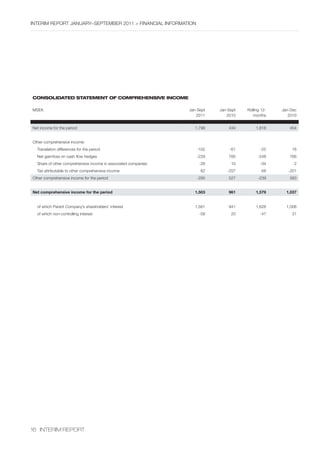
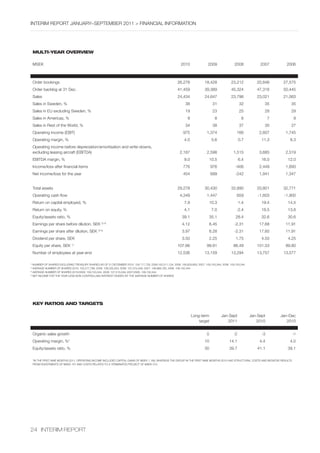
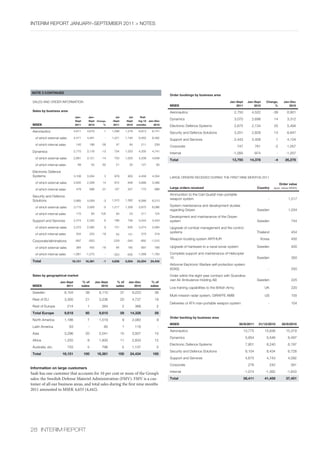
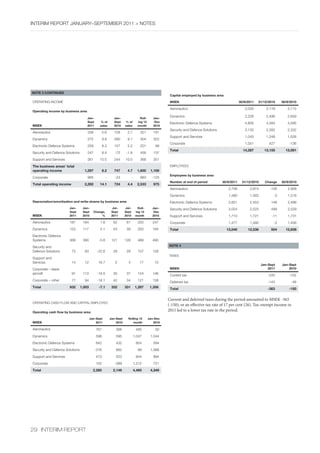
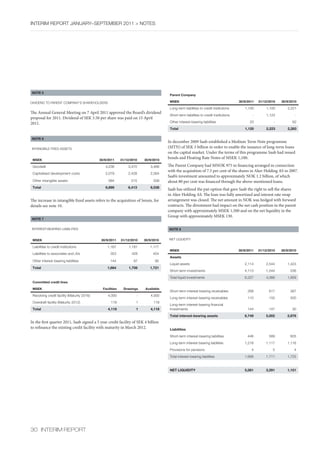
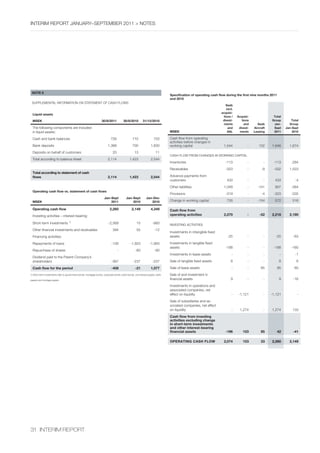

This interim report summarizes Saab's financial results for January-September 2011. Key highlights include: - Order bookings were MSEK 13,793, down 4% from the same period in 2010. The order backlog at the end of the period was MSEK 39,411, up 5% from 2010. - Sales were MSEK 16,151, down 1% compared to 2010 adjusted for exchange rates and acquisitions. - Operating income was MSEK 2,282, up significantly from MSEK 724 in 2010, with an operating margin of 14.1%. - Net income was MSEK 1,798, up from MSEK 434 in 2010. Earnings per share


