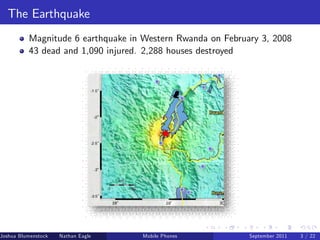
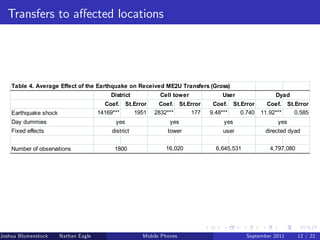
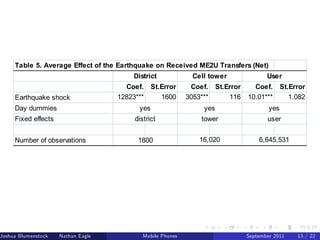
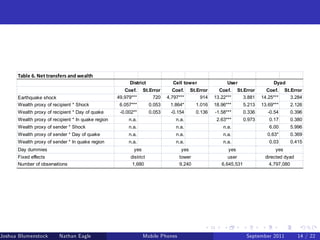
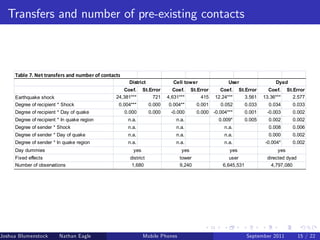
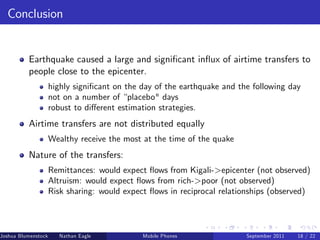
SlideShare a Scribd company logo
Risk and Reciprocity Over the Mobile Phone Network:
                      Evidence from Rwanda

           Joshua Blumenstock               Nathan Eagle             Marcel Fafchamps
              UC Berkeley                  Santa Fe Institute        Oxford University


                                          September 2011


Joshua Blumenstock   Nathan Eagle   Marcel Fafchamps   UC Berkeley
                                                 Mobile Phones             Santa Fe Institute
                                                                            September 2011 1 / 22
Motivation


          Earthquakes and other natural disasters can have catastrophic e¤ects
          Rely on friends, family, and neighbors for support in order to cope
          Mobile phones have the potential to alleviate the short-term
          consequences of a severe shock:
                     call for help (emergency services, stuck in rubble)
                     mobile money redeemed against food, shelter, health care
                     banks disrupted, ATM’ run out of cash
                                            s
          Households in developing world seldom hold large airtime balances
                     transfers of airtime/mobile money can provide tremendous help in
                     immediate aftermath of natural disaster
                     assuming that some cell towers remain in operation and phones are
                     charged


Joshua Blumenstock     Nathan Eagle   Marcel Fafchamps   UC Berkeley
                                                   Mobile Phones         Santa Fe Institute
                                                                          September 2011 2 / 22
The Earthquake
          Magnitude 6 earthquake in Western Rwanda on February 3, 2008
          43 dead and 1,090 injured. 2,288 houses destroyed


Joshua Blumenstock   Nathan Eagle   Marcel Fafchamps   UC Berkeley
                                                 Mobile Phones       Santa Fe Institute
                                                                      September 2011 3 / 22
Contribution


          Data on all phone-to-phone airtime transfers ME2U in Rwanda
          between 2006 and 2008
          Earthquake caused a large and signi…cant in‡ux of airtime transfers to
          people close to the epicenter.
                     highly signi…cant on the day of the earthquake and the following day
                     not on a number of “placebo" days
                     robust to di¤erent estimation strategies.
          Total volume small, probably because mobile banking launched
          shortly before earthquake
          If similar earthquake today and same proportional response, mobile
          money sent would be between USD$11,000 to $22,000.


Joshua Blumenstock      Nathan Eagle   Marcel Fafchamps   UC Berkeley
                                                    Mobile Phones         Santa Fe Institute
                                                                           September 2011 4 / 22
Contribution


          Additional data from phone interviews with 2,200 phone users
          Construct measures of wealth and social network based on phone call
          data

   Findings:
          More earthquake transfers go to richer individuals – probably because
          they are more intensive users of telephones
          More transfers to those with a large number of contacts living close
          by, but not so close as to have been directly a¤ected by the
          earthquake.
          More transfers from people near a¤ected area, less from cities


Joshua Blumenstock   Nathan Eagle   Marcel Fafchamps   UC Berkeley
                                                 Mobile Phones       Santa Fe Institute
                                                                      September 2011 5 / 22
Identi…cation and estimation


          We construct gross and net transfers received in all locations on each
          day before and after the earthquake
          We compare transfers on the day of the earthquake to the average
          transfer received by this location on other days just before and after
          the earthquake
          We vary the width of the time window to check robustness
          We control for variation in transfers between di¤erent days for all
          locations (e.g., day of the week, day of the month, seasonality)


Joshua Blumenstock   Nathan Eagle   Marcel Fafchamps   UC Berkeley
                                                 Mobile Phones       Santa Fe Institute
                                                                      September 2011 6 / 22
Identi…cation and estimation


          We do this at various levels of aggregation:
                     district
                     cell phone tower
                     individual phone number
                     pair of phone number (with some ME2U activity)
          From a policy point of view, the district or cell tower analysis is
          perhaps the most relevant
          But it is also relevant to know who receives the transfers
          Combining the two is often impossible because data is only available
          either at the aggregate level, or from surveys
          We can do both because we have the entire universe of ME2U
          transfers in Rwanda at the individual level


Joshua Blumenstock     Nathan Eagle   Marcel Fafchamps   UC Berkeley
                                                   Mobile Phones       Santa Fe Institute
                                                                        September 2011 7 / 22
Charity or reciprocity?

          Do earthquake transfers ‡ow from the rich to the poor?
                     if charity, would expect the rich to help the poor
                     but richer phone users probably use phone more, so to them airtime is
                     more valuable in emergency
          Do earthquake transfers come primarily from richer urban areas?
                     if charity, would expect help to come from more prosperous areas of
                     country
          Do earthquake transfers ‡ow primarily between individuals with
          previous history of transfers?
                     if reciprocity, would expect more transfers at earthquake between
                     individuals in reciprocal relationship
          Do earthquake transfers fall with distance from epicenter (ignoring
          the are directly a¤ected by earthquake)?
                     if monitoring is important, willingness to assist would fall with distance
                     from shock
Joshua Blumenstock      Nathan Eagle   Marcel Fafchamps   UC Berkeley
                                                    Mobile Phones            Santa Fe Institute
                                                                              September 2011 8 / 22
Data


          Primary dataset comes from Rwanda’ primary telecommunications
                                            s
          operator
                     Log of all airtime transfers from 2005 to end of 2008
                     Log of phone calls
                     50 billion transactions covering 1.5 million users over four years
          All phones prepaid


Joshua Blumenstock      Nathan Eagle   Marcel Fafchamps   UC Berkeley
                                                    Mobile Phones            Santa Fe Institute
                                                                              September 2011 9 / 22
Massive growth in recent years


    Table: Mobile phone penetration: Number of mobile phones per 100 inhabitants.


                            2000     2001        2003            2005    2007    2009    Annual Gro
     Rwanda                  0.49     0.78       1.49             2.47    6.53   24.3       77.1%
     South Africa           18.28    23.39       35.93           71.60   87.08   92.67      17.4%
     United States          38.53    44.77       54.90           71.43   83.51    97.1       9.1%
     Source: International Telecommunication Union


Joshua Blumenstock   Nathan Eagle   Marcel Fafchamps   UC Berkeley
                                                 Mobile Phones                   Santa Fe Institute
                                                                                 September 2011 10 / 22
Dates covered                          All dates                   Earthquake window
                                        1/1/05-12/31/08                  12/1/07-4/1/08
     Panel A: Aggregate tra¢ c                Mean                             S.D.
     # Me2U transactions                    9,202,954                        362,053
     # unique users                         1,084,085                        119,745
     # who send airtime                      870,099                          48,295
     # who receive airtime                   946,855                         101,351
     # who send and receive                  732,869                          29,901
     # unique dyads                          646,713                         159,204
     Panel B: Basic statistics           12/1/07-4/1/08
     Transactions per user                     6.05                            12.05
     Average distance (km)                     13.51                            27.67
     Average value (RWF)                      223.58                           652.02
     Notes: The window 1/1/2005-12/31/2008 encompasses the entire dataset.          The wind
     4/1/2008 is the same as is used in later individual-level regression. US$1=550RWF.


Joshua Blumenstock   Nathan Eagle   Marcel Fafchamps   UC Berkeley
                                                 Mobile Phones         Santa Fe Institute
                                                                       September 2011 11 / 22
Transfers to a¤ected locations


    Table 4. Average Effect of the Earthquake on Received ME2U Transfers (Gross)
                                          District          Cell tower          User               Dyad
                                        Coef. St.Error     Coef. St.Error    Coef. St.Error     Coef. St.Error
    Earthquake shock                  14169***   1951     2832***    177    9.48***   0.740   11.92***   0.585
    Day dummies                             yes                 yes             yes                yes
    Fixed effects                         district             tower            user           directed dyad


    Number of observations                 1800               16,020          6,645,531          4,797,080


Joshua Blumenstock     Nathan Eagle      Marcel Fafchamps   UC Berkeley
                                                      Mobile Phones                       Santa Fe Institute
                                                                                          September 2011 12 / 22
Table 5. Average Effect of the Earthquake on Received ME2U Transfers (Net)
                                             District             Cell tower             User
                                         Coef. St.Error           Coef. St.Error     Coef. St.Error
     Earthquake shock                  12823***   1600           3053***    116    10.01***   1.082
     Day dummies                               yes                    yes                yes
     Fixed effects                           district                tower               user


     Number of observations                   1800                  16,020            6,645,531


Joshua Blumenstock   Nathan Eagle   Marcel Fafchamps    UC Berkeley
                                                 Mobile Phones                     Santa Fe Institute
                                                                                   September 2011 13 / 22
Table 6. Net transfers and wealth
                                                           District               Cell tower                 User                  Dyad
                                                         Coef.     St.Error       Coef.     St.Error     Coef.     St.Error     Coef.     St.Error
      Earthquake shock                                49,979***        720      4,797***        914    13.22***       3.881   14.25***       3.284
      Wealth proxy of recipient * Shock                6.057***        0.053     1.864*       1.016    18.96***       5.213   13.69***      2.126
      Wealth proxy of recipient * Day of quake         -0.002**        0.053     -0.154       0.136    -1.58***       0.336      -0.54      0.396
      Wealth proxy of recipient * In quake region          n.a.                     n.a.                2.63***       0.973      0.17       0.380
      Wealth proxy of sender * Shock                       n.a.                     n.a.                   n.a.                  6.00       5.996
      Wealth proxy of sender * Day of quake                n.a.                     n.a.                   n.a.                 0.63*       0.369
      Wealth proxy of sender * In quake region             n.a.                     n.a.                   n.a.                  0.03       0.415
      Day dummies                                            yes                      yes                    yes                    yes
      Fixed effects                                         district                 tower                   user              directed dyad
      Number of observations                                 1,680                   9,240                6,645,531              4,797,080


Joshua Blumenstock       Nathan Eagle               Marcel Fafchamps
                                                                 Mobile Phones UC Berkeley                             Santa Fe Institute
                                                                                                                       September 2011 14 / 22
Transfers and number of pre-existing contacts


     Table 7. Net transfers and number of contacts
                                                       District              Cell tower                 User                  Dyad
                                                   Coef.       St.Error      Coef.     St.Error     Coef.     St.Error     Coef.     St.Error
     Earthquake shock                           24,381***          721     4,631***        415    12.24***       3.561   13.36***       2.577
     Degree of recipient * Shock                 0.004***         0.000    0.004**       0.001      0.052        0.033     0.034       0.033
     Degree of recipient * Day of quake              0.000        0.000     -0.000       0.000 -0.004***         0.001    -0.003       0.002
     Degree of recipient * In quake region            n.a.                     n.a.                0.009*        0.005     0.002       0.002
     Degree of sender * Shock                         n.a.                     n.a.                   n.a.                 0.008       0.006
     Degree of sender * Day of quake                  n.a.                     n.a.                   n.a.                 0.000       0.002
     Degree of sender * In quake region               n.a.                     n.a.                   n.a.                -0.004*      0.002
     Day dummies                                         yes                     yes                    yes                    yes
     Fixed effects                                     district                 tower                   user              directed dyad
     Number of observations                             1,680                   9,240                6,645,531              4,797,080


Joshua Blumenstock       Nathan Eagle        Marcel Fafchamps
                                                          Mobile Phones   UC Berkeley                            Santa Fe Institute
                                                                                                                 September 2011 15 / 22
Transfers and reciprocity


            Table 8. Net transfers and recipient's ME2U past activity
                                                                              Dyad
                                                                           Coef.     St.Error
            Earthquake shock                                            10.103***       0.784
            ME2U sent in the past * Shock                                0.187***       0.021
            ME2U sent in the past * Day of quake                          0.022**       0.011
            ME2U sent in the past * In quake region                        0.002        0.011
            ME2U received in the past * Shock                              -0.101       0.107
            ME2U received in the past * Day of quake                       -0.021       0.020
            ME2U received in the past * In quake region                   -0.052*       0.029
            Day dummies                                                        yes
            Fixed effects                                                      user
            Number of observations                                          4,381,704


Joshua Blumenstock   Nathan Eagle    Marcel Fafchamps   UC Berkeley
                                                  Mobile Phones               Santa Fe Institute
                                                                              September 2011 16 / 22
0.5
                 Shock X Distance coefficient
                                                0.0
                                                −0.5
                                                −1.0
                                                −1.5
                                                −2.0


                                                           Interaction coefficient
                                                           Lowess smoother (f=.25)


                                                       0           50            100      150      200

                                                                         Distance from recipient

Figure 3: Relationship between the geographic structure of an individual’s network and her propensity to
receive a transfer after the earthquake.


5    Robustness and Limitations

A    Functional form assumptions

We briefly show that our central results are not sensitive to the precise econometric specifications, or to the
choice of time window (which in most regressions is restricted to the period starting one month before the

earthquake and ending one month after the earthquake). Table 8 presents estimates of the average treatment

effect of model (1) using the full dataset from October 2006 until July 2009 under a variety of econometric
specifications. Column (1) gives the standard OLS results with no control variables Xrt , time fixed effects
θt , or tower fixed effects πr . Column (2) includes time-varying controls to account for regional variation

in mobile phone use, column (3) adds regional fixed effects, and column (4) adds daily dummy variables.
Across all specifications, the estimated effect of the shock remains strong and significant, and of a magnitude

similar to that presented in Table 3.


                                                                                     21
Other shocks: ‡oods


                     Table 10. Effect of flood on transfers -- cell tower regressions
                                                         OLS with            Cell tower      Tower/
                                                          controls              FE           time FE
                     Affected by flood                      933.040**         1029.241**     1068.659**
                                                               -316.98           -329.36        -375.45
                     Affected days                         952.838***         981.247***
                                                               -230.79           -206.75
                     In affected location                    237.740*
                                                                -88.55
                     Total calls in location                  0.075***           0.065***      0.103***
                                                                         0           -0.01        -0.01
                     Outgoing transfers from location         0.678***           0.637***      0.527***
                                                                 -0.03               -0.03        -0.04
                     R2                                          0.702               0.729       0.753
                     Number of observations                     74895              74895         74895


Joshua Blumenstock        Nathan Eagle      Marcel Fafchamps   UC Berkeley
                                                         Mobile Phones                         Santa Fe Institute
                                                                                               September 2011 17 / 22
Conclusion


          Earthquake caused a large and signi…cant in‡ux of airtime transfers to
          people close to the epicenter.
                     highly signi…cant on the day of the earthquake and the following day
                     not on a number of “placebo" days
                     robust to di¤erent estimation strategies.
          Airtime transfers are not distributed equally
                     Wealthy receive the most at the time of the quake
          Nature of the transfers:
                     Remittances: would expect ‡ows from Kigali-epicenter (not observed)
                     Altruism: would expect ‡ows from rich-poor (not observed)
                     Risk sharing: would expect ‡ows in reciprocal relationships (observed)


Joshua Blumenstock      Nathan Eagle   Marcel Fafchamps   UC Berkeley
                                                    Mobile Phones         Santa Fe Institute
                                                                          September 2011 18 / 22
Policy implications

          Research has shown that people a¤ected by large aggregate shocks
          receive airtime transfers that probably enable them to:
                     call for help for self or another
                     regroup families
                     organize search e¤ort
                     organize support of a¤ected people (e.g., shelter, water, food)
                     reassure loved ones
          These airtime transfers do not reach everyone:
                     mostly the rich
                     mostly well connected people, who know others outside the a¤ected
                     area
          These airtime transfers do not come from everyone:
                     mostly from people nearby
                     not from the capital city

Joshua Blumenstock      Nathan Eagle   Marcel Fafchamps   UC Berkeley
                                                    Mobile Phones          Santa Fe Institute
                                                                           September 2011 19 / 22
Policy implications


          Policy makers can do better than that:
                     ensure transfers reach everyone in a¤ected area
                     ensure transfers come from those who can best a¤ord them
          Suggestion:
                     automatic transfer of small amount of airtime by phone providers to all
                     phone numbers in a¤ected area
                     organized beforehand and triggered by agreed upon event
                     refunded ex post by government to phone providers


Joshua Blumenstock      Nathan Eagle   Marcel Fafchamps   UC Berkeley
                                                    Mobile Phones         Santa Fe Institute
                                                                          September 2011 20 / 22
Policy implications


          This can be organized
                     in any country
                     for any large shock such as earthquake, ‡ood, tsunami, volcanic
                     eruption, etc
                     as long as some cell towers are still standing
                     but towers are more resilient than many other installations (e.g.,
                     ATMs) because are located higher and often have own power supply
                     (e.g., solar panel)
          But most likely to help in developing countries where the poor are
          most likely
                     to have a zero airtime balance
                     to hold no cash


Joshua Blumenstock      Nathan Eagle   Marcel Fafchamps   UC Berkeley
                                                    Mobile Phones        Santa Fe Institute
                                                                         September 2011 21 / 22
Policy implications


   Mobile money
          Large shocks also disrupt bank system, especially ATM’s
          People run out of cash at a time when most need it – to pay for
          water, food, shelter, care
          Airtime can serve as substitute for money even where governments
          have not authorized mobile money
          Hence transfers can also serve as substitute for monetary transfers
          Obviously would be even easier if governments authorize mobile
          money
          Doing so would also have many other bene…ts for the poor and would
          help economic growth in more isolated, disadvantaged areas


Joshua Blumenstock   Nathan Eagle   Marcel Fafchamps   UC Berkeley
                                                 Mobile Phones       Santa Fe Institute
                                                                     September 2011 22 / 22
Evaluating the impact of
Land Tenure Regularization:
Design and research questions

              Daniel Ali
          Klaus Deininger
        Marguerite Duponchel
         Markus Goldstein
          Eliana La Ferrara

      IGC Growth Week, 20 September 2011
In the next 15’
 Motivation
 Background on LTR program
 Research questions
 Impact evaluation design
 Structure of baseline survey
Motivation
Motivation (1)
Land rights and productivity
   Insecure rights lower investment and
    productivity
    – Besley (1995), Goldstein and Udry (2008)

Mixed evidence on land registration
 does not increase productivity
    – Bardhan and Mookherjee, West Bengal (2009) 
    Quality of land matters
   does increase investment
    – Deininger and Ali, Ethiopia (2011)
   is not cost effective
    – Jacoby and Minten, Madagascar (2007)
   Need a better understanding of the
    relationship between registration,
    investment and productivity
    (e.g., role of credit)

   Most existing studies exploit non-
    experimental variation (politically difficult
    to randomize registration!)

   We exploit random phase-in
Motivation (2)
More than productivity
   Unequal land rights across gender
     titling may affect bargaining and intra-hh
    allocation
Land Tenure
Regularization (LTR)
Background on land in Rwanda
 Land scarcity, dependence on agriculture
 Highest popul. density in Africa
 Average parcel size =0.35 ha, significant
  variation around this
 Environmental degradation; need for
  investment
 Continued fragmentation; active land
  market
Recent legislation
   1999 Inheritance legislation: Equal rights
    to females

   2005 OLL
    • Recognizes existing (customary) rights
    • Equality for spouses; registration
    compulsory
    • Establishes institutional infrastructure
    (NLC, DLBs, LCs at cell, sector, district
    level)
National LTR program

   Participatory, low-cost methodology based
    on photomaps

   Nation-wide program launched in 2010

   Currently 8mn. out of 12 mn. parcels
    registered
9 steps to registration
   Notification to areas of LTR Programme
   Local information dissemination, public meetings
   Appoint & train Land Committees and Parasurveyors
   Demarcation: mark boundaries on a photo image
   Adjudication: record personal details, issue claims
    receipt, record objections simultaneous with
    demarcation
   Publication of adjudication record
   Objections & corrections period: final disputant lists
   Mediation period for disputes.
   Registration and Titling –preparation and issuance of
    Documents
explaining process & map
field demarcation with neighbors
locating parcels on the map
processing claims receipts
Research questions
Research questions
   How has LTR affected tenure security?
   What is the impact of increased security
    on productivity?
   How has LTR affected investment? Who
    within the hh has invested more?
   Channel: has LTR led to more access to
    credit (land as collateral)?
   Has LTR led to more land mkt
    transactions?
Research questions (cont’d)

   Intra-hh bargaining: has LTR changed
    decision making within the hh?
   Gender: has LTR increased inheritance
    rights of girls?
   Uncertainty about rights and land
    disputes: has LTR led to fewer disputes?
   Implementation: How to leverage capacity
    of village committee members to
    maximize impact of LTR
Evaluation design
RCT
 Program is national  cannot randomize
  Treatment vs No treatment
 However, can randomize ORDER in which
  different locations get LTR

Political constraints
 No Kigali province, Kirehe & Rubavu districts
 “Early” and “late” locations randomized,
  others not
Treatment
 Firstlocations to receive LTR
Control
 Last locations to receive LTR


Combine randomization & panel analysis
 Baseline IE survey in Jan. 2011
 Follow up in Dec. 2011-Jan. 2012
Design
Admin structure in Rwanda
 Provinces (4) + City of Kigali
 Districts (30, 3 in Kigali)
 Sectors (416)
 Cells (2,146)
 Villages or Imidugudu


Feasibility requirement by govt:
complete whole sector once started
 Sector level randomization
Multi-site cluster randomized trial w/ 4 levels
 Before randomizing groups, blocking by
  district is employed to improve statistical
  power
 hh’s nested within enumeration areas
  (umudugudu)
 nested within sectors
 nested within districts


Within each district sectors are randomly
 assigned to “early” and “late” program
 groups
 25 districts
   4 sectors per district
      3 cells per sector
        1 village per cell

 300 cells (villages) of which:
     150 treatment: LTR in Feb. 2011
     150 control: LTR in Jan-Feb. 2012

12 hh’s per cell (village)
 3600 hh’s
Treatment and control sectors
Survey instrument
HH questionnaire
 Individual demographics, marital history
 Education
 Migration & displacement history
 Income, expenditures, assets, livestock
 Credit and remittances
 Social capital and decision making
 Perceptions and legal knowledge


 Separate answers by head and spouse
Parcel roster
 land rights, disputes, inheritance
 investments
 seasonal crop cover
 seasonal labour/non-labour inputs
 land sales
Community questionnaire
   Community level infrastructure
   Other government programs
   Individual interviews with members of
    umudugudu committee:
    Perceptions and legal knowledge, decision
    making (survey and experimental)
Results

… next year!

More Related Content

More from The International Growth Centre

Growth Week 2011: Ideas for Growth Session 9 - Climate Change, Environment, N...
Growth Week 2011: Ideas for Growth Session 9 - Climate Change, Environment, N...Growth Week 2011: Ideas for Growth Session 9 - Climate Change, Environment, N...
Growth Week 2011: Ideas for Growth Session 9 - Climate Change, Environment, N...The International Growth Centre
 
Growth Week 2011: Ideas for Growth Session 6 - Human Capital
Growth Week 2011: Ideas for Growth Session 6 - Human CapitalGrowth Week 2011: Ideas for Growth Session 6 - Human Capital
Growth Week 2011: Ideas for Growth Session 6 - Human CapitalThe International Growth Centre
 
Growth Week 2011: Ideas for Growth Session 5 - Governance, Accountability and...
Growth Week 2011: Ideas for Growth Session 5 - Governance, Accountability and...Growth Week 2011: Ideas for Growth Session 5 - Governance, Accountability and...
Growth Week 2011: Ideas for Growth Session 5 - Governance, Accountability and...The International Growth Centre
 
Growth Week 2011: Ideas for Growth Session 4 - Firm Capabilities
Growth Week 2011: Ideas for Growth Session 4 - Firm CapabilitiesGrowth Week 2011: Ideas for Growth Session 4 - Firm Capabilities
Growth Week 2011: Ideas for Growth Session 4 - Firm CapabilitiesThe International Growth Centre
 
Growth Week 2011: Country Session 1 - Mozambique
Growth Week 2011: Country Session 1 - MozambiqueGrowth Week 2011: Country Session 1 - Mozambique
Growth Week 2011: Country Session 1 - Mozambique
The International Growth Centre
 
Growth Week 2011: Joint Country Session – Rwanda/Tanzania
Growth Week 2011: Joint Country Session – Rwanda/TanzaniaGrowth Week 2011: Joint Country Session – Rwanda/Tanzania
Growth Week 2011: Joint Country Session – Rwanda/Tanzania
The International Growth Centre
 
Growth Week 2011: Country Session 5 - Tanzania
Growth Week 2011: Country Session 5 - TanzaniaGrowth Week 2011: Country Session 5 - Tanzania
Growth Week 2011: Country Session 5 - Tanzania
The International Growth Centre
 
Growth Week 2011: Ideas for Growth Session 1 - Agriculture
Growth Week 2011: Ideas for Growth Session 1 - AgricultureGrowth Week 2011: Ideas for Growth Session 1 - Agriculture
Growth Week 2011: Ideas for Growth Session 1 - AgricultureThe International Growth Centre
 

More from The International Growth Centre (17)

Growth Week 2011: Ideas for Growth Session 10 - Trade
Growth Week 2011: Ideas for Growth Session 10 - TradeGrowth Week 2011: Ideas for Growth Session 10 - Trade
Growth Week 2011: Ideas for Growth Session 10 - Trade
 
Growth Week 2011: Country Session 11 - Pakistan
Growth Week 2011: Country Session 11 - PakistanGrowth Week 2011: Country Session 11 - Pakistan
Growth Week 2011: Country Session 11 - Pakistan
 
Growth Week 2011: Country Session 9 - Zambia
Growth Week 2011: Country Session 9 - ZambiaGrowth Week 2011: Country Session 9 - Zambia
Growth Week 2011: Country Session 9 - Zambia
 
Growth Week 2011: Ideas for Growth Session 9 - Climate Change, Environment, N...
Growth Week 2011: Ideas for Growth Session 9 - Climate Change, Environment, N...Growth Week 2011: Ideas for Growth Session 9 - Climate Change, Environment, N...
Growth Week 2011: Ideas for Growth Session 9 - Climate Change, Environment, N...
 
Growth Week 2011: Ideas for Growth Session 7 - Finance
Growth Week 2011: Ideas for Growth Session 7 - FinanceGrowth Week 2011: Ideas for Growth Session 7 - Finance
Growth Week 2011: Ideas for Growth Session 7 - Finance
 
Growth Week 2011: Ideas for Growth Session 6 - Human Capital
Growth Week 2011: Ideas for Growth Session 6 - Human CapitalGrowth Week 2011: Ideas for Growth Session 6 - Human Capital
Growth Week 2011: Ideas for Growth Session 6 - Human Capital
 
Growth Week 2011: Ideas for Growth Session 5 - Governance, Accountability and...
Growth Week 2011: Ideas for Growth Session 5 - Governance, Accountability and...Growth Week 2011: Ideas for Growth Session 5 - Governance, Accountability and...
Growth Week 2011: Ideas for Growth Session 5 - Governance, Accountability and...
 
Growth Week 2011: Ideas for Growth Session 4 - Firm Capabilities
Growth Week 2011: Ideas for Growth Session 4 - Firm CapabilitiesGrowth Week 2011: Ideas for Growth Session 4 - Firm Capabilities
Growth Week 2011: Ideas for Growth Session 4 - Firm Capabilities
 
Growth Week 2011: Country Session 10 - India-Central
Growth Week 2011: Country Session 10 - India-CentralGrowth Week 2011: Country Session 10 - India-Central
Growth Week 2011: Country Session 10 - India-Central
 
Growth Week 2011: Country Session 8 - Sierra Leone
Growth Week 2011: Country Session 8 - Sierra LeoneGrowth Week 2011: Country Session 8 - Sierra Leone
Growth Week 2011: Country Session 8 - Sierra Leone
 
Growth Week 2011: Country Session 7 - Bangladesh
Growth Week 2011: Country Session 7 - BangladeshGrowth Week 2011: Country Session 7 - Bangladesh
Growth Week 2011: Country Session 7 - Bangladesh
 
Growth Week 2011: Country Session 1 - Mozambique
Growth Week 2011: Country Session 1 - MozambiqueGrowth Week 2011: Country Session 1 - Mozambique
Growth Week 2011: Country Session 1 - Mozambique
 
Growth Week 2011: Joint Country Session – Rwanda/Tanzania
Growth Week 2011: Joint Country Session – Rwanda/TanzaniaGrowth Week 2011: Joint Country Session – Rwanda/Tanzania
Growth Week 2011: Joint Country Session – Rwanda/Tanzania
 
Growth Week 2011: Country Session 5 - Tanzania
Growth Week 2011: Country Session 5 - TanzaniaGrowth Week 2011: Country Session 5 - Tanzania
Growth Week 2011: Country Session 5 - Tanzania
 
Growth Week 2011: Country Session 4 – India-Bihar
Growth Week 2011: Country Session 4 – India-BiharGrowth Week 2011: Country Session 4 – India-Bihar
Growth Week 2011: Country Session 4 – India-Bihar
 
Growth Week 2011: Country Session 2 - Ethiopia
Growth Week 2011: Country Session 2 - EthiopiaGrowth Week 2011: Country Session 2 - Ethiopia
Growth Week 2011: Country Session 2 - Ethiopia
 
Growth Week 2011: Ideas for Growth Session 1 - Agriculture
Growth Week 2011: Ideas for Growth Session 1 - AgricultureGrowth Week 2011: Ideas for Growth Session 1 - Agriculture
Growth Week 2011: Ideas for Growth Session 1 - Agriculture
 

Recently uploaded

CACJapan - GROUP Presentation 1- Wk 4.pdf
CACJapan - GROUP Presentation 1- Wk 4.pdfCACJapan - GROUP Presentation 1- Wk 4.pdf
CACJapan - GROUP Presentation 1- Wk 4.pdf
camakaiclarkmusic
 
Unit 8 - Information and Communication Technology (Paper I).pdf
Unit 8 - Information and Communication Technology (Paper I).pdfUnit 8 - Information and Communication Technology (Paper I).pdf
Unit 8 - Information and Communication Technology (Paper I).pdf
Thiyagu K
 
Mule 4.6 & Java 17 Upgrade | MuleSoft Mysore Meetup #46
Mule 4.6 & Java 17 Upgrade | MuleSoft Mysore Meetup #46Mule 4.6 & Java 17 Upgrade | MuleSoft Mysore Meetup #46
Mule 4.6 & Java 17 Upgrade | MuleSoft Mysore Meetup #46
MysoreMuleSoftMeetup
 
Language Across the Curriculm LAC B.Ed.
Language Across the  Curriculm LAC B.Ed.Language Across the  Curriculm LAC B.Ed.
Language Across the Curriculm LAC B.Ed.
Atul Kumar Singh
 
The approach at University of Liverpool.pptx
The approach at University of Liverpool.pptxThe approach at University of Liverpool.pptx
The approach at University of Liverpool.pptx
Jisc
 
Normal Labour/ Stages of Labour/ Mechanism of Labour
Normal Labour/ Stages of Labour/ Mechanism of LabourNormal Labour/ Stages of Labour/ Mechanism of Labour
Normal Labour/ Stages of Labour/ Mechanism of Labour
Wasim Ak
 
A Strategic Approach: GenAI in Education
A Strategic Approach: GenAI in EducationA Strategic Approach: GenAI in Education
A Strategic Approach: GenAI in Education
Peter Windle
 
Supporting (UKRI) OA monographs at Salford.pptx
Supporting (UKRI) OA monographs at Salford.pptxSupporting (UKRI) OA monographs at Salford.pptx
Supporting (UKRI) OA monographs at Salford.pptx
Jisc
 
special B.ed 2nd year old paper_20240531.pdf
special B.ed 2nd year old paper_20240531.pdfspecial B.ed 2nd year old paper_20240531.pdf
special B.ed 2nd year old paper_20240531.pdf
Special education needs
 
The basics of sentences session 5pptx.pptx
The basics of sentences session 5pptx.pptxThe basics of sentences session 5pptx.pptx
The basics of sentences session 5pptx.pptx
heathfieldcps1
 
Welcome to TechSoup New Member Orientation and Q&A (May 2024).pdf
Welcome to TechSoup   New Member Orientation and Q&A (May 2024).pdfWelcome to TechSoup   New Member Orientation and Q&A (May 2024).pdf
Welcome to TechSoup New Member Orientation and Q&A (May 2024).pdf
TechSoup
 
Lapbook sobre os Regimes Totalitários.pdf
Lapbook sobre os Regimes Totalitários.pdfLapbook sobre os Regimes Totalitários.pdf
Lapbook sobre os Regimes Totalitários.pdf
Jean Carlos Nunes Paixão
 
Honest Reviews of Tim Han LMA Course Program.pptx
Honest Reviews of Tim Han LMA Course Program.pptxHonest Reviews of Tim Han LMA Course Program.pptx
Honest Reviews of Tim Han LMA Course Program.pptx
timhan337
 
June 3, 2024 Anti-Semitism Letter Sent to MIT President Kornbluth and MIT Cor...
June 3, 2024 Anti-Semitism Letter Sent to MIT President Kornbluth and MIT Cor...June 3, 2024 Anti-Semitism Letter Sent to MIT President Kornbluth and MIT Cor...
June 3, 2024 Anti-Semitism Letter Sent to MIT President Kornbluth and MIT Cor...
Levi Shapiro
 
Marketing internship report file for MBA
Marketing internship report file for MBAMarketing internship report file for MBA
Marketing internship report file for MBA
gb193092
 
A Survey of Techniques for Maximizing LLM Performance.pptx
A Survey of Techniques for Maximizing LLM Performance.pptxA Survey of Techniques for Maximizing LLM Performance.pptx
A Survey of Techniques for Maximizing LLM Performance.pptx
thanhdowork
 
The Challenger.pdf DNHS Official Publication
The Challenger.pdf DNHS Official PublicationThe Challenger.pdf DNHS Official Publication
The Challenger.pdf DNHS Official Publication
Delapenabediema
 
Overview on Edible Vaccine: Pros & Cons with Mechanism
Overview on Edible Vaccine: Pros & Cons with MechanismOverview on Edible Vaccine: Pros & Cons with Mechanism
Overview on Edible Vaccine: Pros & Cons with Mechanism
DeeptiGupta154
 
Acetabularia Information For Class 9 .docx
Acetabularia Information For Class 9  .docxAcetabularia Information For Class 9  .docx
Acetabularia Information For Class 9 .docx
vaibhavrinwa19
 
TESDA TM1 REVIEWER FOR NATIONAL ASSESSMENT WRITTEN AND ORAL QUESTIONS WITH A...
TESDA TM1 REVIEWER  FOR NATIONAL ASSESSMENT WRITTEN AND ORAL QUESTIONS WITH A...TESDA TM1 REVIEWER  FOR NATIONAL ASSESSMENT WRITTEN AND ORAL QUESTIONS WITH A...
TESDA TM1 REVIEWER FOR NATIONAL ASSESSMENT WRITTEN AND ORAL QUESTIONS WITH A...
EugeneSaldivar
 

Recently uploaded (20)

CACJapan - GROUP Presentation 1- Wk 4.pdf
CACJapan - GROUP Presentation 1- Wk 4.pdfCACJapan - GROUP Presentation 1- Wk 4.pdf
CACJapan - GROUP Presentation 1- Wk 4.pdf
 
Unit 8 - Information and Communication Technology (Paper I).pdf
Unit 8 - Information and Communication Technology (Paper I).pdfUnit 8 - Information and Communication Technology (Paper I).pdf
Unit 8 - Information and Communication Technology (Paper I).pdf
 
Mule 4.6 & Java 17 Upgrade | MuleSoft Mysore Meetup #46
Mule 4.6 & Java 17 Upgrade | MuleSoft Mysore Meetup #46Mule 4.6 & Java 17 Upgrade | MuleSoft Mysore Meetup #46
Mule 4.6 & Java 17 Upgrade | MuleSoft Mysore Meetup #46
 
Language Across the Curriculm LAC B.Ed.
Language Across the  Curriculm LAC B.Ed.Language Across the  Curriculm LAC B.Ed.
Language Across the Curriculm LAC B.Ed.
 
The approach at University of Liverpool.pptx
The approach at University of Liverpool.pptxThe approach at University of Liverpool.pptx
The approach at University of Liverpool.pptx
 
Normal Labour/ Stages of Labour/ Mechanism of Labour
Normal Labour/ Stages of Labour/ Mechanism of LabourNormal Labour/ Stages of Labour/ Mechanism of Labour
Normal Labour/ Stages of Labour/ Mechanism of Labour
 
A Strategic Approach: GenAI in Education
A Strategic Approach: GenAI in EducationA Strategic Approach: GenAI in Education
A Strategic Approach: GenAI in Education
 
Supporting (UKRI) OA monographs at Salford.pptx
Supporting (UKRI) OA monographs at Salford.pptxSupporting (UKRI) OA monographs at Salford.pptx
Supporting (UKRI) OA monographs at Salford.pptx
 
special B.ed 2nd year old paper_20240531.pdf
special B.ed 2nd year old paper_20240531.pdfspecial B.ed 2nd year old paper_20240531.pdf
special B.ed 2nd year old paper_20240531.pdf
 
The basics of sentences session 5pptx.pptx
The basics of sentences session 5pptx.pptxThe basics of sentences session 5pptx.pptx
The basics of sentences session 5pptx.pptx
 
Welcome to TechSoup New Member Orientation and Q&A (May 2024).pdf
Welcome to TechSoup   New Member Orientation and Q&A (May 2024).pdfWelcome to TechSoup   New Member Orientation and Q&A (May 2024).pdf
Welcome to TechSoup New Member Orientation and Q&A (May 2024).pdf
 
Lapbook sobre os Regimes Totalitários.pdf
Lapbook sobre os Regimes Totalitários.pdfLapbook sobre os Regimes Totalitários.pdf
Lapbook sobre os Regimes Totalitários.pdf
 
Honest Reviews of Tim Han LMA Course Program.pptx
Honest Reviews of Tim Han LMA Course Program.pptxHonest Reviews of Tim Han LMA Course Program.pptx
Honest Reviews of Tim Han LMA Course Program.pptx
 
June 3, 2024 Anti-Semitism Letter Sent to MIT President Kornbluth and MIT Cor...
June 3, 2024 Anti-Semitism Letter Sent to MIT President Kornbluth and MIT Cor...June 3, 2024 Anti-Semitism Letter Sent to MIT President Kornbluth and MIT Cor...
June 3, 2024 Anti-Semitism Letter Sent to MIT President Kornbluth and MIT Cor...
 
Marketing internship report file for MBA
Marketing internship report file for MBAMarketing internship report file for MBA
Marketing internship report file for MBA
 
A Survey of Techniques for Maximizing LLM Performance.pptx
A Survey of Techniques for Maximizing LLM Performance.pptxA Survey of Techniques for Maximizing LLM Performance.pptx
A Survey of Techniques for Maximizing LLM Performance.pptx
 
The Challenger.pdf DNHS Official Publication
The Challenger.pdf DNHS Official PublicationThe Challenger.pdf DNHS Official Publication
The Challenger.pdf DNHS Official Publication
 
Overview on Edible Vaccine: Pros & Cons with Mechanism
Overview on Edible Vaccine: Pros & Cons with MechanismOverview on Edible Vaccine: Pros & Cons with Mechanism
Overview on Edible Vaccine: Pros & Cons with Mechanism
 
Acetabularia Information For Class 9 .docx
Acetabularia Information For Class 9  .docxAcetabularia Information For Class 9  .docx
Acetabularia Information For Class 9 .docx
 
TESDA TM1 REVIEWER FOR NATIONAL ASSESSMENT WRITTEN AND ORAL QUESTIONS WITH A...
TESDA TM1 REVIEWER  FOR NATIONAL ASSESSMENT WRITTEN AND ORAL QUESTIONS WITH A...TESDA TM1 REVIEWER  FOR NATIONAL ASSESSMENT WRITTEN AND ORAL QUESTIONS WITH A...
TESDA TM1 REVIEWER FOR NATIONAL ASSESSMENT WRITTEN AND ORAL QUESTIONS WITH A...
 

Growth Week 2011: Country Session 6 - Rwanda

  • 1. Risk and Reciprocity Over the Mobile Phone Network: Evidence from Rwanda Joshua Blumenstock Nathan Eagle Marcel Fafchamps UC Berkeley Santa Fe Institute Oxford University September 2011 Joshua Blumenstock Nathan Eagle Marcel Fafchamps UC Berkeley Mobile Phones Santa Fe Institute September 2011 1 / 22
  • 2. Motivation Earthquakes and other natural disasters can have catastrophic e¤ects Rely on friends, family, and neighbors for support in order to cope Mobile phones have the potential to alleviate the short-term consequences of a severe shock: call for help (emergency services, stuck in rubble) mobile money redeemed against food, shelter, health care banks disrupted, ATM’ run out of cash s Households in developing world seldom hold large airtime balances transfers of airtime/mobile money can provide tremendous help in immediate aftermath of natural disaster assuming that some cell towers remain in operation and phones are charged Joshua Blumenstock Nathan Eagle Marcel Fafchamps UC Berkeley Mobile Phones Santa Fe Institute September 2011 2 / 22
  • 3. The Earthquake Magnitude 6 earthquake in Western Rwanda on February 3, 2008 43 dead and 1,090 injured. 2,288 houses destroyed Joshua Blumenstock Nathan Eagle Marcel Fafchamps UC Berkeley Mobile Phones Santa Fe Institute September 2011 3 / 22
  • 4. Contribution Data on all phone-to-phone airtime transfers ME2U in Rwanda between 2006 and 2008 Earthquake caused a large and signi…cant in‡ux of airtime transfers to people close to the epicenter. highly signi…cant on the day of the earthquake and the following day not on a number of “placebo" days robust to di¤erent estimation strategies. Total volume small, probably because mobile banking launched shortly before earthquake If similar earthquake today and same proportional response, mobile money sent would be between USD$11,000 to $22,000. Joshua Blumenstock Nathan Eagle Marcel Fafchamps UC Berkeley Mobile Phones Santa Fe Institute September 2011 4 / 22
  • 5. Contribution Additional data from phone interviews with 2,200 phone users Construct measures of wealth and social network based on phone call data Findings: More earthquake transfers go to richer individuals – probably because they are more intensive users of telephones More transfers to those with a large number of contacts living close by, but not so close as to have been directly a¤ected by the earthquake. More transfers from people near a¤ected area, less from cities Joshua Blumenstock Nathan Eagle Marcel Fafchamps UC Berkeley Mobile Phones Santa Fe Institute September 2011 5 / 22
  • 6. Identi…cation and estimation We construct gross and net transfers received in all locations on each day before and after the earthquake We compare transfers on the day of the earthquake to the average transfer received by this location on other days just before and after the earthquake We vary the width of the time window to check robustness We control for variation in transfers between di¤erent days for all locations (e.g., day of the week, day of the month, seasonality) Joshua Blumenstock Nathan Eagle Marcel Fafchamps UC Berkeley Mobile Phones Santa Fe Institute September 2011 6 / 22
  • 7. Identi…cation and estimation We do this at various levels of aggregation: district cell phone tower individual phone number pair of phone number (with some ME2U activity) From a policy point of view, the district or cell tower analysis is perhaps the most relevant But it is also relevant to know who receives the transfers Combining the two is often impossible because data is only available either at the aggregate level, or from surveys We can do both because we have the entire universe of ME2U transfers in Rwanda at the individual level Joshua Blumenstock Nathan Eagle Marcel Fafchamps UC Berkeley Mobile Phones Santa Fe Institute September 2011 7 / 22
  • 8. Charity or reciprocity? Do earthquake transfers ‡ow from the rich to the poor? if charity, would expect the rich to help the poor but richer phone users probably use phone more, so to them airtime is more valuable in emergency Do earthquake transfers come primarily from richer urban areas? if charity, would expect help to come from more prosperous areas of country Do earthquake transfers ‡ow primarily between individuals with previous history of transfers? if reciprocity, would expect more transfers at earthquake between individuals in reciprocal relationship Do earthquake transfers fall with distance from epicenter (ignoring the are directly a¤ected by earthquake)? if monitoring is important, willingness to assist would fall with distance from shock Joshua Blumenstock Nathan Eagle Marcel Fafchamps UC Berkeley Mobile Phones Santa Fe Institute September 2011 8 / 22
  • 9. Data Primary dataset comes from Rwanda’ primary telecommunications s operator Log of all airtime transfers from 2005 to end of 2008 Log of phone calls 50 billion transactions covering 1.5 million users over four years All phones prepaid Joshua Blumenstock Nathan Eagle Marcel Fafchamps UC Berkeley Mobile Phones Santa Fe Institute September 2011 9 / 22
  • 10. Massive growth in recent years Table: Mobile phone penetration: Number of mobile phones per 100 inhabitants. 2000 2001 2003 2005 2007 2009 Annual Gro Rwanda 0.49 0.78 1.49 2.47 6.53 24.3 77.1% South Africa 18.28 23.39 35.93 71.60 87.08 92.67 17.4% United States 38.53 44.77 54.90 71.43 83.51 97.1 9.1% Source: International Telecommunication Union Joshua Blumenstock Nathan Eagle Marcel Fafchamps UC Berkeley Mobile Phones Santa Fe Institute September 2011 10 / 22
  • 11. Dates covered All dates Earthquake window 1/1/05-12/31/08 12/1/07-4/1/08 Panel A: Aggregate tra¢ c Mean S.D. # Me2U transactions 9,202,954 362,053 # unique users 1,084,085 119,745 # who send airtime 870,099 48,295 # who receive airtime 946,855 101,351 # who send and receive 732,869 29,901 # unique dyads 646,713 159,204 Panel B: Basic statistics 12/1/07-4/1/08 Transactions per user 6.05 12.05 Average distance (km) 13.51 27.67 Average value (RWF) 223.58 652.02 Notes: The window 1/1/2005-12/31/2008 encompasses the entire dataset. The wind 4/1/2008 is the same as is used in later individual-level regression. US$1=550RWF. Joshua Blumenstock Nathan Eagle Marcel Fafchamps UC Berkeley Mobile Phones Santa Fe Institute September 2011 11 / 22
  • 12. Transfers to a¤ected locations Table 4. Average Effect of the Earthquake on Received ME2U Transfers (Gross) District Cell tower User Dyad Coef. St.Error Coef. St.Error Coef. St.Error Coef. St.Error Earthquake shock 14169*** 1951 2832*** 177 9.48*** 0.740 11.92*** 0.585 Day dummies yes yes yes yes Fixed effects district tower user directed dyad Number of observations 1800 16,020 6,645,531 4,797,080 Joshua Blumenstock Nathan Eagle Marcel Fafchamps UC Berkeley Mobile Phones Santa Fe Institute September 2011 12 / 22
  • 13. Table 5. Average Effect of the Earthquake on Received ME2U Transfers (Net) District Cell tower User Coef. St.Error Coef. St.Error Coef. St.Error Earthquake shock 12823*** 1600 3053*** 116 10.01*** 1.082 Day dummies yes yes yes Fixed effects district tower user Number of observations 1800 16,020 6,645,531 Joshua Blumenstock Nathan Eagle Marcel Fafchamps UC Berkeley Mobile Phones Santa Fe Institute September 2011 13 / 22
  • 14. Table 6. Net transfers and wealth District Cell tower User Dyad Coef. St.Error Coef. St.Error Coef. St.Error Coef. St.Error Earthquake shock 49,979*** 720 4,797*** 914 13.22*** 3.881 14.25*** 3.284 Wealth proxy of recipient * Shock 6.057*** 0.053 1.864* 1.016 18.96*** 5.213 13.69*** 2.126 Wealth proxy of recipient * Day of quake -0.002** 0.053 -0.154 0.136 -1.58*** 0.336 -0.54 0.396 Wealth proxy of recipient * In quake region n.a. n.a. 2.63*** 0.973 0.17 0.380 Wealth proxy of sender * Shock n.a. n.a. n.a. 6.00 5.996 Wealth proxy of sender * Day of quake n.a. n.a. n.a. 0.63* 0.369 Wealth proxy of sender * In quake region n.a. n.a. n.a. 0.03 0.415 Day dummies yes yes yes yes Fixed effects district tower user directed dyad Number of observations 1,680 9,240 6,645,531 4,797,080 Joshua Blumenstock Nathan Eagle Marcel Fafchamps Mobile Phones UC Berkeley Santa Fe Institute September 2011 14 / 22
  • 15. Transfers and number of pre-existing contacts Table 7. Net transfers and number of contacts District Cell tower User Dyad Coef. St.Error Coef. St.Error Coef. St.Error Coef. St.Error Earthquake shock 24,381*** 721 4,631*** 415 12.24*** 3.561 13.36*** 2.577 Degree of recipient * Shock 0.004*** 0.000 0.004** 0.001 0.052 0.033 0.034 0.033 Degree of recipient * Day of quake 0.000 0.000 -0.000 0.000 -0.004*** 0.001 -0.003 0.002 Degree of recipient * In quake region n.a. n.a. 0.009* 0.005 0.002 0.002 Degree of sender * Shock n.a. n.a. n.a. 0.008 0.006 Degree of sender * Day of quake n.a. n.a. n.a. 0.000 0.002 Degree of sender * In quake region n.a. n.a. n.a. -0.004* 0.002 Day dummies yes yes yes yes Fixed effects district tower user directed dyad Number of observations 1,680 9,240 6,645,531 4,797,080 Joshua Blumenstock Nathan Eagle Marcel Fafchamps Mobile Phones UC Berkeley Santa Fe Institute September 2011 15 / 22
  • 16. Transfers and reciprocity Table 8. Net transfers and recipient's ME2U past activity Dyad Coef. St.Error Earthquake shock 10.103*** 0.784 ME2U sent in the past * Shock 0.187*** 0.021 ME2U sent in the past * Day of quake 0.022** 0.011 ME2U sent in the past * In quake region 0.002 0.011 ME2U received in the past * Shock -0.101 0.107 ME2U received in the past * Day of quake -0.021 0.020 ME2U received in the past * In quake region -0.052* 0.029 Day dummies yes Fixed effects user Number of observations 4,381,704 Joshua Blumenstock Nathan Eagle Marcel Fafchamps UC Berkeley Mobile Phones Santa Fe Institute September 2011 16 / 22
  • 17. 0.5 Shock X Distance coefficient 0.0 −0.5 −1.0 −1.5 −2.0 Interaction coefficient Lowess smoother (f=.25) 0 50 100 150 200 Distance from recipient Figure 3: Relationship between the geographic structure of an individual’s network and her propensity to receive a transfer after the earthquake. 5 Robustness and Limitations A Functional form assumptions We briefly show that our central results are not sensitive to the precise econometric specifications, or to the choice of time window (which in most regressions is restricted to the period starting one month before the earthquake and ending one month after the earthquake). Table 8 presents estimates of the average treatment effect of model (1) using the full dataset from October 2006 until July 2009 under a variety of econometric specifications. Column (1) gives the standard OLS results with no control variables Xrt , time fixed effects θt , or tower fixed effects πr . Column (2) includes time-varying controls to account for regional variation in mobile phone use, column (3) adds regional fixed effects, and column (4) adds daily dummy variables. Across all specifications, the estimated effect of the shock remains strong and significant, and of a magnitude similar to that presented in Table 3. 21
  • 18. Other shocks: ‡oods Table 10. Effect of flood on transfers -- cell tower regressions OLS with Cell tower Tower/ controls FE time FE Affected by flood 933.040** 1029.241** 1068.659** -316.98 -329.36 -375.45 Affected days 952.838*** 981.247*** -230.79 -206.75 In affected location 237.740* -88.55 Total calls in location 0.075*** 0.065*** 0.103*** 0 -0.01 -0.01 Outgoing transfers from location 0.678*** 0.637*** 0.527*** -0.03 -0.03 -0.04 R2 0.702 0.729 0.753 Number of observations 74895 74895 74895 Joshua Blumenstock Nathan Eagle Marcel Fafchamps UC Berkeley Mobile Phones Santa Fe Institute September 2011 17 / 22
  • 19. Conclusion Earthquake caused a large and signi…cant in‡ux of airtime transfers to people close to the epicenter. highly signi…cant on the day of the earthquake and the following day not on a number of “placebo" days robust to di¤erent estimation strategies. Airtime transfers are not distributed equally Wealthy receive the most at the time of the quake Nature of the transfers: Remittances: would expect ‡ows from Kigali-epicenter (not observed) Altruism: would expect ‡ows from rich-poor (not observed) Risk sharing: would expect ‡ows in reciprocal relationships (observed) Joshua Blumenstock Nathan Eagle Marcel Fafchamps UC Berkeley Mobile Phones Santa Fe Institute September 2011 18 / 22
  • 20. Policy implications Research has shown that people a¤ected by large aggregate shocks receive airtime transfers that probably enable them to: call for help for self or another regroup families organize search e¤ort organize support of a¤ected people (e.g., shelter, water, food) reassure loved ones These airtime transfers do not reach everyone: mostly the rich mostly well connected people, who know others outside the a¤ected area These airtime transfers do not come from everyone: mostly from people nearby not from the capital city Joshua Blumenstock Nathan Eagle Marcel Fafchamps UC Berkeley Mobile Phones Santa Fe Institute September 2011 19 / 22
  • 21. Policy implications Policy makers can do better than that: ensure transfers reach everyone in a¤ected area ensure transfers come from those who can best a¤ord them Suggestion: automatic transfer of small amount of airtime by phone providers to all phone numbers in a¤ected area organized beforehand and triggered by agreed upon event refunded ex post by government to phone providers Joshua Blumenstock Nathan Eagle Marcel Fafchamps UC Berkeley Mobile Phones Santa Fe Institute September 2011 20 / 22
  • 22. Policy implications This can be organized in any country for any large shock such as earthquake, ‡ood, tsunami, volcanic eruption, etc as long as some cell towers are still standing but towers are more resilient than many other installations (e.g., ATMs) because are located higher and often have own power supply (e.g., solar panel) But most likely to help in developing countries where the poor are most likely to have a zero airtime balance to hold no cash Joshua Blumenstock Nathan Eagle Marcel Fafchamps UC Berkeley Mobile Phones Santa Fe Institute September 2011 21 / 22
  • 23. Policy implications Mobile money Large shocks also disrupt bank system, especially ATM’s People run out of cash at a time when most need it – to pay for water, food, shelter, care Airtime can serve as substitute for money even where governments have not authorized mobile money Hence transfers can also serve as substitute for monetary transfers Obviously would be even easier if governments authorize mobile money Doing so would also have many other bene…ts for the poor and would help economic growth in more isolated, disadvantaged areas Joshua Blumenstock Nathan Eagle Marcel Fafchamps UC Berkeley Mobile Phones Santa Fe Institute September 2011 22 / 22
  • 24. Evaluating the impact of Land Tenure Regularization: Design and research questions Daniel Ali Klaus Deininger Marguerite Duponchel Markus Goldstein Eliana La Ferrara IGC Growth Week, 20 September 2011
  • 25. In the next 15’  Motivation  Background on LTR program  Research questions  Impact evaluation design  Structure of baseline survey
  • 27. Motivation (1) Land rights and productivity  Insecure rights lower investment and productivity – Besley (1995), Goldstein and Udry (2008) Mixed evidence on land registration  does not increase productivity – Bardhan and Mookherjee, West Bengal (2009)  Quality of land matters  does increase investment – Deininger and Ali, Ethiopia (2011)  is not cost effective – Jacoby and Minten, Madagascar (2007)
  • 28. Need a better understanding of the relationship between registration, investment and productivity (e.g., role of credit)  Most existing studies exploit non- experimental variation (politically difficult to randomize registration!)  We exploit random phase-in
  • 29. Motivation (2) More than productivity  Unequal land rights across gender  titling may affect bargaining and intra-hh allocation
  • 31. Background on land in Rwanda  Land scarcity, dependence on agriculture  Highest popul. density in Africa  Average parcel size =0.35 ha, significant variation around this  Environmental degradation; need for investment  Continued fragmentation; active land market
  • 32. Recent legislation  1999 Inheritance legislation: Equal rights to females  2005 OLL • Recognizes existing (customary) rights • Equality for spouses; registration compulsory • Establishes institutional infrastructure (NLC, DLBs, LCs at cell, sector, district level)
  • 33. National LTR program  Participatory, low-cost methodology based on photomaps  Nation-wide program launched in 2010  Currently 8mn. out of 12 mn. parcels registered
  • 34. 9 steps to registration  Notification to areas of LTR Programme  Local information dissemination, public meetings  Appoint & train Land Committees and Parasurveyors  Demarcation: mark boundaries on a photo image  Adjudication: record personal details, issue claims receipt, record objections simultaneous with demarcation  Publication of adjudication record  Objections & corrections period: final disputant lists  Mediation period for disputes.  Registration and Titling –preparation and issuance of Documents
  • 40. Research questions  How has LTR affected tenure security?  What is the impact of increased security on productivity?  How has LTR affected investment? Who within the hh has invested more?  Channel: has LTR led to more access to credit (land as collateral)?  Has LTR led to more land mkt transactions?
  • 41. Research questions (cont’d)  Intra-hh bargaining: has LTR changed decision making within the hh?  Gender: has LTR increased inheritance rights of girls?  Uncertainty about rights and land disputes: has LTR led to fewer disputes?  Implementation: How to leverage capacity of village committee members to maximize impact of LTR
  • 43. RCT  Program is national  cannot randomize Treatment vs No treatment  However, can randomize ORDER in which different locations get LTR Political constraints  No Kigali province, Kirehe & Rubavu districts  “Early” and “late” locations randomized, others not
  • 44. Treatment  Firstlocations to receive LTR Control  Last locations to receive LTR Combine randomization & panel analysis  Baseline IE survey in Jan. 2011  Follow up in Dec. 2011-Jan. 2012
  • 45. Design Admin structure in Rwanda  Provinces (4) + City of Kigali  Districts (30, 3 in Kigali)  Sectors (416)  Cells (2,146)  Villages or Imidugudu Feasibility requirement by govt: complete whole sector once started  Sector level randomization
  • 46. Multi-site cluster randomized trial w/ 4 levels  Before randomizing groups, blocking by district is employed to improve statistical power  hh’s nested within enumeration areas (umudugudu)  nested within sectors  nested within districts Within each district sectors are randomly assigned to “early” and “late” program groups
  • 47.  25 districts  4 sectors per district  3 cells per sector  1 village per cell  300 cells (villages) of which:  150 treatment: LTR in Feb. 2011  150 control: LTR in Jan-Feb. 2012 12 hh’s per cell (village)  3600 hh’s
  • 50. HH questionnaire  Individual demographics, marital history  Education  Migration & displacement history  Income, expenditures, assets, livestock  Credit and remittances  Social capital and decision making  Perceptions and legal knowledge  Separate answers by head and spouse
  • 51. Parcel roster  land rights, disputes, inheritance  investments  seasonal crop cover  seasonal labour/non-labour inputs  land sales
  • 52. Community questionnaire  Community level infrastructure  Other government programs  Individual interviews with members of umudugudu committee: Perceptions and legal knowledge, decision making (survey and experimental)