SlideShare a Scribd company logo
1 of 45
GROUP PROJECT: CLEAR ESSENCE 15
Group Research Project
Entry of Clear Essence Ethnic Skincare & Cosmetics Brand into
the
Kenyan Beauty Supply Market
Contents
Executive
Summary………………………………………………………………
………...……3
PART I: Evaluating Sustainability Business Model
Opportunities
·
Purpose………………………………………………………………
……………….……4
· Environmental
Analysis……………………………………………………………….
..…4
· Market Structure
Analysis………………………………………………………………
…5
· Market
Opportunities…………………………………………………………
………...…6
· Competitor
Analysis………………………………………………………………
…….…6
· Key
Insights………………………………………………………………
…………….…7
PART II: Evaluating Capability readiness of the
·
Purpose………………………………………………………………
…………………….7
· Value
Analysis………………………………………………………………
…….………8
· Growth
Strategy………………………………………………………………
……...……8
· Collaboration/
Acquisition…………………………………………………………...
……9
· Key
Insights………………………………………………………………
…………..….10
PART III:Implementation plan
·
Purpose………………………………………………………………
…………………...10
· Cage
Analysis………………………………………………………………
…….………10
· Stakeholder
Analysis………………………………………………………..……1
2
· Business
Model………………………………………………………..………
…13
· Key
Insights……………………………………………………………..…
…….13
Exhibits/ Appendices
· STEEP
analysis………………………………………………………………
………..…14
· Five Forces
analysis………………………………………………………………
……
· Blue Ocean
analysis………………………………………………………………
……
· 9 M
analysis………………………………………………………………
……
References……………………………………………………………
…………………………
Executive Summary
The Clear Essence Brand is one that has for many decades
shown that it has the capabilities and the competencies, as well
as tools and offerings, to enter into multiple markets. These
entries have all ensured that there has been in place a direct and
careful framework established that taps into the needs and
openings in markets that have room for the Clear Essence brand
to make an entry. The decision to explore the entry into Kenya
is a recent move in that same direction. Kenya has a budding
and exponentially growing cosmetics and beauty industry that is
attracting the attention of local, regional and multinational
cosmetics companies and firms. The room is available and the
time is right for Clear Essence to make an entrance into this
market while there are still many unexplored and untapped
segments of the market that can be capitalized off of. Clear
Essence can and should take this moment to enter as it has the
growth potential and the tools needed, as well as an
environment in Kenya that is an aligned match for the products
that it has to offer. This is backed up through an extensive look
at the operational realities of the Clear Essence brand, as well
as the environmental realities of Kenya at this time.
Part I – Evaluating Sustainability Business Model Opportunities
Purpose
The sustainability and the ability for this concept to work in
Kenya is the main consideration of this segment. Here there is a
push to understand the existing forces that can and will dictate
the direction that the company can go in to compete and how its
competition is in the first place. This will be accomplished with
a breakdown of the existing competencies had and the existing
market segments held by the competition which ranges from
domestic brands, regional players as well as large
multinationals that have all in recent years made a push to enter
into the Kenyan beauty market (Situma, 2013). By
understanding this, there can be a realistic analysis of the best
direction and decisions that Clear Essence can make as it
considers its potential into the Kenyan market.
Environmental Analysis
Social, technological, economic, environmental, and political
conditions in Kenya all point to a nation that is a good fit for
the expansion of this organization. The nation is one that in
many ways has already been tested out over the last 5 years by
other nations in terms of the strength and stability of these
factors (Situma, 2013). Not only are these conditions stable and
positive, they are also growing in terms of the manner in which
the environment is able to support and allow for success for new
entrants. This is because the as the economy and the political
situations stabilize further and more economic investment
occurs in East Africa, the more the population is able to support
the growing demands amongst the middle and upper classes for
luxury items, of which makeup counts towards. This is seen in a
recent report that noted that the beauty industry is slated to
grow across the board in East Africa specifically:
(Odero, 2016)
Clear Essence falls directly into these categories and is entering
in a time when their products, which are crafted specifically for
ethnic skin and hair, can capitalize off the growing trend and
push in the cosmetics increases in Kenya. The environment in
terms of the social and the economic are therefore very much so
open and supportive of the decision to enter.
Market structure analysis
The Five Forces conditions on their own however do not
necessarily seem that positive. This is because mainly the
bargaining power of consumers, the threat of new entrants and
the threat of substitute products are all quite high. This is
because, while in some markets Clear Essence stands out for
catering to the minority needs in healthcare/ skincare, in Kenya,
this will be the major push and focus of the regional players and
the domestic players in a big way already. There is in fact a
large trend in Nigerian products making their way into Kenya as
well (Beauty Africa, 2016). This leaves the consumers needing
a large amount of push in marketing to establish any
differentiation in the Clear Essence brand and the existing
choices that there are.
Market Opportunities for Alternative Business Models
This is surely then for Clear Essence a red ocean that they are
stepping into. However, they can attempt a blue ocean strategy
and find new manners to offer to the population the same
products, but under different concepts and with more creative
marketing. This may be the manner in which they are able to
address the needs of the company in a way that allows for a way
to avoid the red and create the blue. This can be in the manner
in which the products are gotten to the hands of the consumers,
such as home to home Avon methods, or more of a collaborative
and exclusive rollout and line to the consumers. There are
manners in which they can avoid the red ocean by not entering
into the market in the same manner that the existing
competition, such as big names like Revlon have been doing
since 2013.
Competitor Analysis
There are many local and regional players in the nation that can
be considered as major firms, however, the Revlon brand is by
far the largest multinational player in this market. They have
entered in the last five years and have been pushing their brand
quite hard as they attempt to make a strong cornering of this
east African nation. Revlon is an organization that focuses on a
centralized HR process that also allows for regional research
and considerations so that they are able to be flexible and
responsive to needs. They additionally enjoy a solid and
organized supply chain that effectively gets items to their end
locations with little disturbance. The customer relation strategy
of the company is also refined and follows the overall parent
company brands of offering integrated and responsive channels
to give their consumers a voice. Revlon is additionally known
for investment that falls on the side of a budgetary approach.
The organization also uses a private-social combination for its
stewardship that focuses on CSR as well as shareholder returns.
Conduct 9 M analysis of a major firm in the target local market,
to understand the functional strategies driving that firm’s
success
Key insights
This market and entering into it has certain risks that must be
taken into consideration. The environment and the market are
neither fully open and easy and neither are they closed off and
too difficult. What is needed is a plan that takes into account
the fact that the country is in fact growing its cosmetics
industry and is in a position to let far more competitors in
during this time when companies are still vying for open
segments of the market. However, there is a need to enter in a
manner that prepares for the need for differentiation to be able
to capture not only new segments, but also some that are
already claimed by others.
Part II – Evaluating Capability Readiness of the Firm
Purpose
This segment lays out the many reasons that the Clear Essence
brand is ready to further expand and enter into the Kenyan and
the East African market. This is shown through a combination
of the analysis of not only the company itself, but also the
readiness of the Kenyan market itself (Lati, 2014). Through a
value analysis as well as a look at possible expansion, growth
and collaboration potentials, there can be a manner for Clear
Essence to assess itself, and see that it is indeed ready and
capable of making this entry now, while there is still
considerable room for it to make an entrance. The additional
purpose of this segment is to highlight that there is a need to
ensure that there is a focus on strategic integration and growth
strategies on the part of Clear Essence before it enters, as well
as in a continuous manner as it is in this nation. The threats of
new entrants will only grow as time goes on, and high-level
mergers and acquisitions on the part of multinationals
organizations like Revlon can be a serious threat if they are not
considered while making growth strategies for the company.
Value analysis
Clear Essence has a value in its precise and extensive focus on
a single area of retail concern. For well over 25 years they have
been offering skincare as well as haircare products that cater to
a large and core customer base (Clear Essence). They have
shown that they have the tools and the capabilities, as well as
competencies to carry their model and their products across a
variety of nations and continents having to date expanded into
multiple parts of the world. They have allowed there to be
multiple streams in which the products are available to the
consumers which include assigning ambassadors to sell the
items, online stores, physical partners and retail store locations.
This combination shows that they have the custom solutions and
dynamic and extensive capabilities to enter into the Kenyan
market using these same tools and approaches. The advantages
for Clear Essence can also be seen in the fact that the Kenyan
market has related industries and support capabilities that are
vital for the Clear Essence brand, such as location, raw supplies
and fulfillment partners. The demand conditions also create an
environment that allows there to be room for new entrants to
come in as well.
Growth strategy
By entering into this new market, the Clear Essence brans will
in fact be growing in a general manner. They can further this by
also making an effort to engage with and work with the local
brands for brand expansions, or by creating more collaborations
and making purchases of local brands to allow it to have more
ability in reaching market segments within the cosmetics users
in the nation. There is no reason to break from and fail to align
with the existing structures of their company process, as this
has been one that has worked for them to date in the many
nations they have gone into already. The best bet for growth in
the integration would be to focus on strategic alliances to save
money in the short run, as well as strategic acquisitions that can
allow for careful control over well-researched market segments.
The major risk for growth will be the existing competition and
the real possibility that as this region expands more and more
and gains the attention of other organizations, there will be new
entrants that will capture more market segments through better
alliances and acquisitions/ mergers.
Collaboration / Acquisition Strategy
The Clear Essence brand should be focused greatly on both of
these areas of consideration. Both the idea of collaboration as
well as acquisition are imperative if there is to be both growth
as well as a securing of market segments for Clear Essence. The
motivation should be to preemptively consider the new entrants
and the potential for substitutes for the consumer. There should
also be the consideration of the need to ensure growth in a
dynamic and continuous manner. The collaboration can be with
a number of companies and organizations in terms of both
actual brands, warehousing and shipping/ fulfillment centers as
well as stores. The fact that there are brand ambassadors can
mean that local chain stores for beauty supplies can be worked
with to create specific lines in a complimentary and related
diversification strategy. There can also be special brands
created with larger stores to piggyback off their market and foot
traffic and increase their exposure and visibility to more
consumers. There can also be a consideration of creating with
these same larger stores strategic alliances that can be
beneficial to them both. The major drawback of these options
can be seen in the risk of getting bogged down in what may only
be short-term alliances that may not be long-term what the
organization needs, and can cost it some autonomy.
Key Insights
What can be seen and learned in these considerations is that
there are many paths that can be open to Clear Essence as far as
expansion and collaboration go. Growth needs to be a constant
consideration that they are focused on if they are to attempt any
long-term viability and competitiveness in this potentially red
ocean market. The value analysis shows that Clear Essence is in
a god position and that they can in fact make the jump and have
many options in front of them for expansion and collaboration.
These however, will only be fruitful with a diverse look at
multiple options that can be taken advantage of in a way that
allows for them to grow using multiple tools. These tools
include things such as the focus on creating strategic alliances
that can help it to reach more people through relationships, as
well as the crafting of creative and new manners of selling and
presenting the products that they have in their brand.
Part III – Implementation plan
Purpose
This segment endeavors to assess the cultural, economic,
administrative and geographical differences that can be found in
this nation and how that will create opportunities for adjustment
on the part of Clear Essence in terms of incorporating these
norms into its business practices, its operations as well as its
overall product pricing and offering.
CAGE analysis
The major considerations in terms of government, geography
and economic differences can be seen in this organization and
its intended market as not being hard to bridge. Again, this is
because the company has already entered into, and in actuality
started in, markets in Africa, the Caribbean and so on. They are
therefore well aware of the implications and the needs of these
markets. The cultural angles that most affect the offerings are in
particular already addressed as the Clear Essence brand is
focused on offering items custom crafted and created to be
offered to the ethnic communities that are dominant in Kenya.
The target market is therefore already in line with the goals and
the realities of the Clear Essence company. Additionally, as the
nation’s company is labeled as a lower middle income by the
World Bank, the price ranges of the offerings fall in line with
the economic abilities and realities of Kenya (Euromonitor
International, 2017). Additionally, in terms of the economic and
the administrative angles of doing business and expanding
business, Kenya is ranked as participating in reform that is
making doing business easier and more fluid (The World Bank).
The major area that do need to be addressed will be the
operational manners in which the company addresses itself and
others. This means ensuring to know that in Kenya there are
cultural norms in business that intersect at a line in which there
is a need and push for casual relationships as well as formal
business ones at the same time. The conditions however overall
are conducive and line up well enough with the Clear Essence
brand that is already a multinational company that is sold across
many continents. The Kenyan CAGE variables also allow for
the company to enjoy many commonalities with the anticipated
market with only some considerations needed for the cultural
business realities and operational realities once the market has
been entered into.
Stakeholder analysis
There will be a variety of stakeholders in this expansion into
Kenya scenario. The largest and most obvious will be the
shareholders of the Clear Essence company. These individuals
will be able to decide ultimately if there is going to be any
entry at all as they may not find it to be a prudent or profitable
decision to make at all. These stakeholders are the ones who
will make the decisions and the only manner to manage them
and their power is to be prepared with answers, figures and data
that shows that this is a viable and lucrative endeavor to embark
upon. This can be done with transparency at the highest levels.
Another stakeholder will be the employees at all levels of this
organization. These individuals will have a good amount of
power themselves because they will be needed to fill a variety
of functions as this organization embarks on their path towards
this entry into Kenya. Their power needs to be managed as well
through transparency and inclusion so that they are aware of the
goals and the reasons for the expansion so that they do not push
against any change and internally slow down the process. This
will also include the new employees of the company in Kenya
directly, who will also have power and need to be treated in an
equitable and balanced manner to control and manage their
power.
Another stakeholder will be the consumers themselves as well
as those who are connected to the company through proximity
of chipping methods, store locations, etc. These individuals
have power in that they can affect support for, and thereby
survival of the company the latter group has much less power
than the actual consumers. Both can be managed through
systems that offer them transparency, fairness and cooperation
as well as listening to their needs in constructive manners.
Business model
The business models that should be used is a collaborative one.
This means that they should focus at first on entering with
strategic alliances that sees them working with existing brands
and stores to sell the items through their brick and mortar
locations. This can save the Clear Essence brans considerable
money and energy as they find their footing and also gives them
access to larger segments of the market right from the start. The
market selection process itself has identified Kenya as a nation
that has a large growth and focus on the beauty industry and is
increasing exponentially on a yearly basis.
Key insights
This analysis has shown that once again Clear Essence is in a
strong position to enter this market and has in its capabilities
the tools needed to create a multipronged approach to entering
into the Kenyan market, and can choose to use multiple of them
to start with, or it can choose to focus on one business strategy
in full. The existing stakeholders in the company’s activities
can also be managed in a way that allows for the regional
realities to be addressed and focused on as well. These make the
implementation plan of the company one that can very easily be
put into action with a number of strengths and tools in favor of
Clear Essence and its desired activities in offering their
products inside of Kenya.
Exhibits
STEEP Analysis
Content
Five Forces Analysis
Content
Blue Ocean Analysis
Content
9 M Analysis
Content
References
Clear Essence Company Homepage. Retrieved from:
https://www.clearessence.com/Euromonitor International
(2017). Beauty and Personal Care in Kenya.
http://www.euromonitor.com/beauty-and-personal-care-in-
kenya/reportLati, M. (2014). Nigerian entrepreneur enters
Kenya’s cosmetics market. Business Daily Africa. Retrieved
from: http://www.businessdailyafrica.com/Corporate-
News/Nigerian-enters-Kenya-cosmetics-market/-
/539550/2537306/-/bp1wjpz/-/index.htmlBeauty Africa. (2016).
Beauty Industry: Growth Spots in East Africa. http://beauty-
africa.com/beauty-industry-growth-spots-in-the-greater-east-
africa-region/Odero, C. (2016). The rise of the Kenya beauty
industry. http://www.nation.co.ke/lifestyle/lifestyle/The-rise-of-
the-Kenya-beauty-industry/1214-2928452-
i3stlwz/index.htmlSituma,E. (2013). Cosmetics brands battling
for Kenyan market. Business Daily Africa. Retrieved from:
http://www.businessdailyafrica.com/Cosmetics-brands-battling-
for-Kenyan-market/-/1248928/1745578/-/10k9g37/-
/index.htmlThe World Bank. Doing Business in Kenya.
Retrieved from:
http://www.doingbusiness.org/data/exploreeconomies/kenya
1
Differences and the CAGE Distance Framework
1
Pankaj Ghemawat
After analyzing the cases in section 1, the reality of
semiglobalization
and the importance of cross-country differences should be clear.
This
section introduces the CAGE distance framework, which is used
to
identify and prioritize the differences between countries that
companies
must address when developing cross-border strategies.
2
Begin by considering the example summarized in exhibit 2-1,
which
plots Walmart’s operating margin by country in 2004 against
the
distance between each country’s capital and Walmart’s
headquarters in
Bentonville, Arkansas. The impact of geographic distance is
obvious, but
what other types of difference or distance can you identify that
separated
the markets that were profitable for Walmart from those that
weren’t?
Exhibit 2-1
Walmart International’s Operating Margin by Country (2004
estimates)
Figure 2-1: Wal-Mart International’s Operating Margin by
Country, 2004 (Estimated)
2
The CAGE distance framework disaggregates distance or
difference into
four major categories: Cultural, Administrative, Geographic,
and
Economic. Differences along these dimensions generally have a
negative
effect on many cross-border interactions, although in some
cases,
differences along a limited subset of CAGE dimensions can
actually
encourage rather than discourage such interactions.
3
Each of these broad
types of difference or distance is illustrated by the Walmart
example.
beliefs, values, and social norms—the unwritten, unspoken rules
of the game—that shape the behavior of individuals and
organizations. Cultural distance encompasses differences in
religious beliefs, race/ethnicity, language, and social norms and
values. Societies even differ in their social attitudes toward
market power and globalization in ways that have important
effects, both formally via regulation and informally, on how
businesses operate.
4
Interestingly, Walmart’s four profitable
markets share linguistic, religious and ethnic similarities or, at
least, ties through large diaspora.
distance: Historical and political associations
between countries—colonial links, free trade agreements, the
tenor of current relationships—profoundly affect economic
exchange between them—which is the same as saying that
differences along these dimensions matter a great deal. So, of
course, do administrative attributes specific to a particular
country such as autarchic policies or weak institutions and high
levels of corruption. In the Walmart example, note that two of
the
profitable countries, Canada and Mexico, partner with the
United
States in a regional free trade agreement, the North American
Free Trade Agreement (NAFTA). And a third profitable
―country‖
as classified by Walmart, Puerto Rico, is officially an
unincorporated territory of the United States.
involves more than just how far two countries are from each
other: other attributes to be considered include contiguity, a
country’s physical size, within-country distances to borders,
3
access to the ocean, topography, and even time zones. Exhibit
2-
1 makes it clear that the capital city of each of Walmart’s four
profitable ―countries‖ is geographically closer to Walmart’s
headquarters than the capitals of any of the unprofitable ones;
in
addition, Canada and Mexico share a common land border with
the United States.
of
labor are the most obvious (and related) determinants of
economic distance between countries. Others include
differences
in availability (or lack) of resources, inputs, infrastructure and
complements, and organizational capabilities. It seems a bit
harder for Walmart to do well in poorer countries—although the
number of data points is very limited. Note, however, that
economic distance has not been entirely or even primarily a
liability for Walmart. The company saves more money by
procuring merchandise from China—exploiting economic
distance, particularly in terms of labor costs—than it makes
from
its entire international store network. We will return to such
strategies in section 5, which discusses arbitrage.
What the Numbers Tell Us
International economists have adapted Newton’s law of
universal
gravitation to describe trade and other international economic
interactions. Thus, the simplest gravity model of international
trade
between two countries predicts that trade will be directly related
to their
economic sizes (a unilateral attribute of each country) and
inversely
related to the physical distance between them (a bilateral or
country-pair
attribute). Augmented gravity models add measures of other
types of
differences as well as unilateral attributes. Exhibit 2-2 shows
the results
of one such analysis that evaluated cultural, administrative,
geographic,
and economic effects on trade.
4
Exhibit 2-2 Effects of Similarities Versus Differences on
Bilateral Trade
Dimensions of
Distance/Proximity
Determinant
Change in Trade
Cultural
Administrative
Geographic
Economic
Common language
Common regional trading bloc
Colony/colonizer links
Common currency
Differences in corruption
Physical distance: 1% increase
Physical size: 1% increase
Landlockedness
Common land border
Economic size: GDP (1% increase)
Income level: GDP per capita (1% increase)
+42%
+47%
+188%
+114%
–11%
–1.1%
–0.2%
–48%
+125%
+0.8%
+0.7%
Source: Pankaj Ghemawat and Rajiv Mallick, “The Industry-
Level Structure of
International Trade Networks: A Gravity-Based Approach,”
working paper, Harvard
Business School Boston, February 2003.
The estimates correct for unobserved thresholds for
participation in trade and are all
significant at the 1% level but are, in a number of cases, smaller
than those reported in
many other studies, apparently due to the correction
The signs on most of the estimates in the table probably accord
with
your intuitions (although they cannot be reconciled with a fully
globalized ―flat‖ world). What are probably more surprising
are the
magnitudes of some of the effects—for example, that countries
with
colonial ties are apt to trade almost three times as much as
countries
without them, or even more if one also accounts for the role of
colonial
ties in generating cultural similarities! The persistence of such
large
effects decades and, in some instances, more than a century
after the
original colonial relationships were dissolved reinforce the
conclusion
that complete globalization—as in the disappearance of the
effects of
such considerations—is extremely unlikely anytime soon.
Similarities versus differences along many of the same
dimensions also
help explain foreign direct investment or companies’ foreign
presence.
Thus, for U.S. companies that operate in just one foreign
country, that
5
country is Canada 60 percent of the time (and 10 percent of the
time it is
the United Kingdom).
5
Gravity models have also been adapted to explain
cross-border interactions as diverse as equity trading, e-
commerce
transactions, patent citations, immigrant flows, air traffic,
phone calls,
and even the incidence of wars! The basic conclusion from this
literature
is that differences between countries—and differences in
differences—
matter in significant, predictable ways.
Identifying and Prioritizing Differences
Having highlighted the persistent impact of cross-country
differences or
distances, the rest of this section focuses on using the CAGE
distance
framework to identify and prioritize the differences that must be
accounted for in developing global strategies. Exhibit 2-3 helps
in this
regard by identifying bilateral and unilateral factors to consider
for each
of the CAGE categories.
Exhibit 2-3 The CAGE Framework at the Country Level
Cultural
Distance
Administrative
Distance
Geographic
Distance
Economic
Distance
Country pairs
(bilateral)
languages
t
ethnicities;
lack of
connective
ethnic or
social
networks
religions
values, norms,
and
dispositions
ties
regional trading
bloc
currency
distance
border
time zones
climates /
disease
environments
differences
differences in
cost or quality
of natural
resources,
financial
resources,
human
resources,
infrastructure,
and information
or knowledge
Countries
(unilateral)
economy (home
bias vs. foreign
bias)
membership in
international
organizations
navigability
remoteness
transportation
income
6
corruption
or
communication
links
The most distinctive feature of the CAGE framework is that it
encompasses the bilateral attributes of country pairs as well as
the
unilateral attributes of individual countries. Most of the other
frameworks that have been proposed for thinking about the
differences
across countries (or locations) focus on just unilateral
attributes; that is,
they assume that countries can be assessed one by one against a
common
set of yardsticks. Note that this characterization applies not
only to
cardinal indices such as the World Economic Forum’s Global
Competitiveness Index or Transparency International’s
Corruption
Perceptions Index but also to ordinal ranking schemes such as
Michael
Porter’s ―diamond‖ framework for diagnosing the (relative)
international
competitiveness of different countries as home bases in specific
industries. But indexicality of this sort is restrictive since it
can’t deal
with ideas such as ―The U.S. is closer to Canada than it is to
Indonesia.‖
More generally, indexicality is incapable of capturing bilateral
differences of the sort necessary to envision countries as
existing in (and
even occupying) space in relation to each other, that is, as nodes
in a
network instead of as an array along a common yardstick.
6
Having drawn that distinction between unilateral and bilateral
influences,
it is useful to add that they can be fitted together into the same
overall
structure. Specifically, unilateral measures of isolation (or
integration)
capturing country-specific attributes that generally decrease (or
increase)
a country’s involvement in cross-border economic activities can
be
treated as a common component of that country’s distances
along
various dimensions from all other countries. For example, really
isolated
countries (characterized by unique, ingrown cultures, closed
administrative policies, physical remoteness, or extremely high
or low
incomes) can be thought of as being relatively distant from
everywhere
else. That said, one needs to add bilateral indicators to such
unilateral
conceptions to capture the idea that a company’s home base
affects
which countries are close and which ones are farther away.
The other point worthy of even more emphasis is that different
types of
distance matter to different extents in different industries. For
instance,
7
since geographic distance affects the costs of transportation, it
is of
particular importance to companies dealing in heavy or bulky
products.
Cultural distance, on the other hand, shapes consumers’ product
preferences and should be a crucial consideration for a
consumer goods
or media company—but is much less important for a cement or
steel
business. Exhibit 2-4 provides a summary of the characteristics
that are
likely to make an industry particularly sensitive to a particular
kind of
distance.
Exhibit 2-4 The CAGE Framework at the Industry Level
Cultural
Distance
Administrative
Distance
Geographic
Distance
Economic
Distance
Cultural differences
matter the most
when:
linguistic content
(TV programs)
cultural or national
identity (foods)
vary in terms of
size (cars) or
standards
(electrical
equipment)
country-specific
quality
associations
(wines)
Government
involvement is high in
industries that are:
goods (electricity)
―entitlements‖ (drugs)
(farming)
government (mass
transportation)
(aerospace)
security
(telecommunications)
resources (oil, mining)
costs (infrastructure)
Geography plays a
more important role
when:
value-to-weight or
bulk ratio (cement)
or perishable (glass,
fruit)
and operational
requirements are
high (services)
Economic differences
make the biggest
impact when:
varies with income
(cars)
standardization or
scale are limited
(cement)
factor cost
differences are
salient (garments)
or
business systems
are different
(insurance)
be responsive and
agile (home
appliances)
Applications of the CAGE Distance Framework
The CAGE framework, once it is taken down to the industry
level, lends
itself to a very broad array of applications. Let’s focus here on
four of
the most important ones.
8
Making Differences Visible
One application of the CAGE distance framework is to make
key
differences visible. While this application may seem too
obvious to be
worth belaboring, most notable international business debacles
can be
traced back to a failure to appreciate a key type of cross-country
difference or distance. Furthermore, in a very diverse world,
managers
cannot simply fall back on personal experience to ensure
adequate
sensitivity to differences. Checklists of the sort embedded in
exhibits 2-3
and 2-4 can help even experienced people avoid errors due to
forgetfulness and cognitive overload in a complex environment.
Understanding the Liability of Foreignness
A second application of the CAGE framework is to pinpoint the
differences across countries that might handicap multinational
companies relative to local competitors—the so-called liability
of
foreignness—or more generally affect their relative positions.
This can
be a useful exercise for both multinationals and their local
competitors.
When there are substantial liabilities of foreignness,
multinationals often
look to acquire or set up joint ventures with local firms to
overcome
these barriers.
Assessing Natural Owners and Comparing Foreign Competitors
Even if multinationals can be confident that they are going to
prevail
over local competitors in a particular market, the CAGE
framework can
be used at a finer level of resolution to shed light on the relative
position
of multinationals from different countries. For example, CAGE
analysis
can help explain why Spanish firms do well in many industries
across
Latin America, but also why success in Mexico has proved
comparatively easier for U.S. firms.
7
Again, such analysis is most
valuable when conducted at the industry level and is indicative
rather
than decisive. Thus, particularly good or bad global strategies
can matter
more than ―natural ownership‖ advantages.
9
Comparing Markets and Discounting by Distance
The CAGE framework can also be used to compare markets
from the
perspective of a particular company. One method to conduct
quantitative
analysis of this type is to discount (specifically, divide) raw
measures of
market size or potential with measures of distance, broadly
defined.
While such discounting involves numerous approximations,
making
some adjustments of market potential for distance is a better
idea, given
how much distance matters, than refraining from making any
adjustments at all. Some companies do formally use methods of
this sort
in deciding to enter or exit markets (as described in the first
case in this
section, on Grolsch).
Conclusion
The CAGE framework helps identify the most important cross-
country
differences and their implications for strategy. However,
understanding
differences is not a sufficient basis for setting global strategy.
Think
back to the ADDING value scorecard from the previous section
and ask
yourself how each type of difference or distance affects the six
levers for
value addition and subtraction. Is it a challenge that must be
accounted
for and addressed? Or does it offer an opportunity to improve
economic
profitability? The next three sections help address these
questions by
introducing three types of strategies for creating and claiming
value in
the presence of cross-border differences: adaptation,
aggregation, and
arbitrage.
1
Pan kaj Gh em aw at An d Jord an I. Siegel, ― Cases on
Redefining Global
Strategy‖ , (H arv ard Bu sin ess Review Press, 2011):59-69
2
For a more extended treatment of this material, see Pankaj
Ghemawat,
―Distance Still Matters: The Hard Reality of Global
Expansion,‖ Harvard Business
Review, September 2001. This topic is also addressed at
substantially greater length in
chapter 2 of Pankaj Ghemawat, Redefining Global Strategy
(Harvard Business School
Press, 2007), and chapter 3 of Pankaj Ghemawat, World 3.0:
Global Prosperity and
How to Achieve It (Harvard Business Review Press, 2011). For
a collection of maps
that highlight distance effects, see www.ghemawat.com.
10
3
For further discussion of the ways in which CAGE differences
can encourage
rather than discourage cross-border activity, see the discussion
of arbitrage in section 5
and the references cited therein.
4
For an original discussion of cultural distance and how it
affects foreign
direct investment, see Jordan Siegel, Amir Licht, and Shalom
Schwartz,
―Egalitarianism, Cultural Distance, and FDI: A New
Approach,‖ working paper,
Harvard Business School, Boston, October 2008.
5
Su san E. Fein berg, ―Th e Exp an sion an d Location Patter
n s of U.S.
Mu ltin ation als,‖ u n p u blish ed w orkin g p ap er, Ru tgers
Un iversity, 2005.
6
For a more extended discussion of indexicality in a broader
social science
context, see Andrew Abbott, Chaos of Disciplines (Chicago:
University of Chicago
Press, 2001).
7
Subramanian Rangan and Aldemir Drummond, ―Explaining
Outcomes in
Competition among Foreign Multinationals in a Focal Host
Market,‖ Strategic
Management Journal 25, no. 3: 285–293.

More Related Content

More from whittemorelucilla

Database reports provide us with the ability to further analyze ou.docx
Database reports provide us with the ability to further analyze ou.docxDatabase reports provide us with the ability to further analyze ou.docx
Database reports provide us with the ability to further analyze ou.docxwhittemorelucilla
 
DataInformationKnowledge1.  Discuss the relationship between.docx
DataInformationKnowledge1.  Discuss the relationship between.docxDataInformationKnowledge1.  Discuss the relationship between.docx
DataInformationKnowledge1.  Discuss the relationship between.docxwhittemorelucilla
 
DataHole 12 Score6757555455555455575775655565656555655656556566643.docx
DataHole 12 Score6757555455555455575775655565656555655656556566643.docxDataHole 12 Score6757555455555455575775655565656555655656556566643.docx
DataHole 12 Score6757555455555455575775655565656555655656556566643.docxwhittemorelucilla
 
DataDestination PalletsTotal CasesCases redCases whiteCases organi.docx
DataDestination PalletsTotal CasesCases redCases whiteCases organi.docxDataDestination PalletsTotal CasesCases redCases whiteCases organi.docx
DataDestination PalletsTotal CasesCases redCases whiteCases organi.docxwhittemorelucilla
 
DataIllinois Tool WorksConsolidated Statement of Income($ in milli.docx
DataIllinois Tool WorksConsolidated Statement of Income($ in milli.docxDataIllinois Tool WorksConsolidated Statement of Income($ in milli.docx
DataIllinois Tool WorksConsolidated Statement of Income($ in milli.docxwhittemorelucilla
 
DataIDSalaryCompa-ratioMidpoint AgePerformance RatingServiceGender.docx
DataIDSalaryCompa-ratioMidpoint AgePerformance RatingServiceGender.docxDataIDSalaryCompa-ratioMidpoint AgePerformance RatingServiceGender.docx
DataIDSalaryCompa-ratioMidpoint AgePerformance RatingServiceGender.docxwhittemorelucilla
 
DataCity1997 Median Price1997 Change1998 Forecast1993-98 Annualize.docx
DataCity1997 Median Price1997 Change1998 Forecast1993-98 Annualize.docxDataCity1997 Median Price1997 Change1998 Forecast1993-98 Annualize.docx
DataCity1997 Median Price1997 Change1998 Forecast1993-98 Annualize.docxwhittemorelucilla
 
DataClientRoom QualityFood QualityService Quality1GPG2GGG3GGG4GPG5.docx
DataClientRoom QualityFood QualityService Quality1GPG2GGG3GGG4GPG5.docxDataClientRoom QualityFood QualityService Quality1GPG2GGG3GGG4GPG5.docx
DataClientRoom QualityFood QualityService Quality1GPG2GGG3GGG4GPG5.docxwhittemorelucilla
 
Database Project CharterBusiness CaseKhalia HartUnive.docx
Database Project CharterBusiness CaseKhalia HartUnive.docxDatabase Project CharterBusiness CaseKhalia HartUnive.docx
Database Project CharterBusiness CaseKhalia HartUnive.docxwhittemorelucilla
 
Databases selected Multiple databases...Full Text (1223 .docx
Databases selected Multiple databases...Full Text (1223  .docxDatabases selected Multiple databases...Full Text (1223  .docx
Databases selected Multiple databases...Full Text (1223 .docxwhittemorelucilla
 
Database SystemsDesign, Implementation, and ManagementCo.docx
Database SystemsDesign, Implementation, and ManagementCo.docxDatabase SystemsDesign, Implementation, and ManagementCo.docx
Database SystemsDesign, Implementation, and ManagementCo.docxwhittemorelucilla
 
DATABASE SYSTEMS DEVELOPMENT & IMPLEMENTATION PLAN1DATABASE SYS.docx
DATABASE SYSTEMS DEVELOPMENT & IMPLEMENTATION PLAN1DATABASE SYS.docxDATABASE SYSTEMS DEVELOPMENT & IMPLEMENTATION PLAN1DATABASE SYS.docx
DATABASE SYSTEMS DEVELOPMENT & IMPLEMENTATION PLAN1DATABASE SYS.docxwhittemorelucilla
 
Database Security Assessment Transcript You are a contracting office.docx
Database Security Assessment Transcript You are a contracting office.docxDatabase Security Assessment Transcript You are a contracting office.docx
Database Security Assessment Transcript You are a contracting office.docxwhittemorelucilla
 
Database Design Mid Term ExamSpring 2020Name ________________.docx
Database Design Mid Term ExamSpring 2020Name ________________.docxDatabase Design Mid Term ExamSpring 2020Name ________________.docx
Database Design Mid Term ExamSpring 2020Name ________________.docxwhittemorelucilla
 
Database Justification MemoCreate a 1-page memo for the .docx
Database Justification MemoCreate a 1-page memo for the .docxDatabase Justification MemoCreate a 1-page memo for the .docx
Database Justification MemoCreate a 1-page memo for the .docxwhittemorelucilla
 
Database Concept Maphttpwikieducator.orgCCNCCCN.docx
Database Concept Maphttpwikieducator.orgCCNCCCN.docxDatabase Concept Maphttpwikieducator.orgCCNCCCN.docx
Database Concept Maphttpwikieducator.orgCCNCCCN.docxwhittemorelucilla
 
Database Dump Script(Details of project in file)Mac1) O.docx
Database Dump Script(Details of project in file)Mac1) O.docxDatabase Dump Script(Details of project in file)Mac1) O.docx
Database Dump Script(Details of project in file)Mac1) O.docxwhittemorelucilla
 
Database Design 1. What is a data model A. method of sto.docx
Database Design 1.  What is a data model A. method of sto.docxDatabase Design 1.  What is a data model A. method of sto.docx
Database Design 1. What is a data model A. method of sto.docxwhittemorelucilla
 
DataAGEGENDERETHNICMAJORSEMHOUSEGPAHRSNEWSPAPTVHRSSLEEPWEIGHTHEIGH.docx
DataAGEGENDERETHNICMAJORSEMHOUSEGPAHRSNEWSPAPTVHRSSLEEPWEIGHTHEIGH.docxDataAGEGENDERETHNICMAJORSEMHOUSEGPAHRSNEWSPAPTVHRSSLEEPWEIGHTHEIGH.docx
DataAGEGENDERETHNICMAJORSEMHOUSEGPAHRSNEWSPAPTVHRSSLEEPWEIGHTHEIGH.docxwhittemorelucilla
 

More from whittemorelucilla (20)

Database reports provide us with the ability to further analyze ou.docx
Database reports provide us with the ability to further analyze ou.docxDatabase reports provide us with the ability to further analyze ou.docx
Database reports provide us with the ability to further analyze ou.docx
 
DataInformationKnowledge1.  Discuss the relationship between.docx
DataInformationKnowledge1.  Discuss the relationship between.docxDataInformationKnowledge1.  Discuss the relationship between.docx
DataInformationKnowledge1.  Discuss the relationship between.docx
 
DataHole 12 Score6757555455555455575775655565656555655656556566643.docx
DataHole 12 Score6757555455555455575775655565656555655656556566643.docxDataHole 12 Score6757555455555455575775655565656555655656556566643.docx
DataHole 12 Score6757555455555455575775655565656555655656556566643.docx
 
DataDestination PalletsTotal CasesCases redCases whiteCases organi.docx
DataDestination PalletsTotal CasesCases redCases whiteCases organi.docxDataDestination PalletsTotal CasesCases redCases whiteCases organi.docx
DataDestination PalletsTotal CasesCases redCases whiteCases organi.docx
 
DataIllinois Tool WorksConsolidated Statement of Income($ in milli.docx
DataIllinois Tool WorksConsolidated Statement of Income($ in milli.docxDataIllinois Tool WorksConsolidated Statement of Income($ in milli.docx
DataIllinois Tool WorksConsolidated Statement of Income($ in milli.docx
 
DataIDSalaryCompa-ratioMidpoint AgePerformance RatingServiceGender.docx
DataIDSalaryCompa-ratioMidpoint AgePerformance RatingServiceGender.docxDataIDSalaryCompa-ratioMidpoint AgePerformance RatingServiceGender.docx
DataIDSalaryCompa-ratioMidpoint AgePerformance RatingServiceGender.docx
 
DataCity1997 Median Price1997 Change1998 Forecast1993-98 Annualize.docx
DataCity1997 Median Price1997 Change1998 Forecast1993-98 Annualize.docxDataCity1997 Median Price1997 Change1998 Forecast1993-98 Annualize.docx
DataCity1997 Median Price1997 Change1998 Forecast1993-98 Annualize.docx
 
DataClientRoom QualityFood QualityService Quality1GPG2GGG3GGG4GPG5.docx
DataClientRoom QualityFood QualityService Quality1GPG2GGG3GGG4GPG5.docxDataClientRoom QualityFood QualityService Quality1GPG2GGG3GGG4GPG5.docx
DataClientRoom QualityFood QualityService Quality1GPG2GGG3GGG4GPG5.docx
 
Database Project CharterBusiness CaseKhalia HartUnive.docx
Database Project CharterBusiness CaseKhalia HartUnive.docxDatabase Project CharterBusiness CaseKhalia HartUnive.docx
Database Project CharterBusiness CaseKhalia HartUnive.docx
 
Databases selected Multiple databases...Full Text (1223 .docx
Databases selected Multiple databases...Full Text (1223  .docxDatabases selected Multiple databases...Full Text (1223  .docx
Databases selected Multiple databases...Full Text (1223 .docx
 
Database SystemsDesign, Implementation, and ManagementCo.docx
Database SystemsDesign, Implementation, and ManagementCo.docxDatabase SystemsDesign, Implementation, and ManagementCo.docx
Database SystemsDesign, Implementation, and ManagementCo.docx
 
DATABASE SYSTEMS DEVELOPMENT & IMPLEMENTATION PLAN1DATABASE SYS.docx
DATABASE SYSTEMS DEVELOPMENT & IMPLEMENTATION PLAN1DATABASE SYS.docxDATABASE SYSTEMS DEVELOPMENT & IMPLEMENTATION PLAN1DATABASE SYS.docx
DATABASE SYSTEMS DEVELOPMENT & IMPLEMENTATION PLAN1DATABASE SYS.docx
 
Database Security Assessment Transcript You are a contracting office.docx
Database Security Assessment Transcript You are a contracting office.docxDatabase Security Assessment Transcript You are a contracting office.docx
Database Security Assessment Transcript You are a contracting office.docx
 
Data.docx
Data.docxData.docx
Data.docx
 
Database Design Mid Term ExamSpring 2020Name ________________.docx
Database Design Mid Term ExamSpring 2020Name ________________.docxDatabase Design Mid Term ExamSpring 2020Name ________________.docx
Database Design Mid Term ExamSpring 2020Name ________________.docx
 
Database Justification MemoCreate a 1-page memo for the .docx
Database Justification MemoCreate a 1-page memo for the .docxDatabase Justification MemoCreate a 1-page memo for the .docx
Database Justification MemoCreate a 1-page memo for the .docx
 
Database Concept Maphttpwikieducator.orgCCNCCCN.docx
Database Concept Maphttpwikieducator.orgCCNCCCN.docxDatabase Concept Maphttpwikieducator.orgCCNCCCN.docx
Database Concept Maphttpwikieducator.orgCCNCCCN.docx
 
Database Dump Script(Details of project in file)Mac1) O.docx
Database Dump Script(Details of project in file)Mac1) O.docxDatabase Dump Script(Details of project in file)Mac1) O.docx
Database Dump Script(Details of project in file)Mac1) O.docx
 
Database Design 1. What is a data model A. method of sto.docx
Database Design 1.  What is a data model A. method of sto.docxDatabase Design 1.  What is a data model A. method of sto.docx
Database Design 1. What is a data model A. method of sto.docx
 
DataAGEGENDERETHNICMAJORSEMHOUSEGPAHRSNEWSPAPTVHRSSLEEPWEIGHTHEIGH.docx
DataAGEGENDERETHNICMAJORSEMHOUSEGPAHRSNEWSPAPTVHRSSLEEPWEIGHTHEIGH.docxDataAGEGENDERETHNICMAJORSEMHOUSEGPAHRSNEWSPAPTVHRSSLEEPWEIGHTHEIGH.docx
DataAGEGENDERETHNICMAJORSEMHOUSEGPAHRSNEWSPAPTVHRSSLEEPWEIGHTHEIGH.docx
 

Recently uploaded

Accessible design: Minimum effort, maximum impact
Accessible design: Minimum effort, maximum impactAccessible design: Minimum effort, maximum impact
Accessible design: Minimum effort, maximum impactdawncurless
 
POINT- BIOCHEMISTRY SEM 2 ENZYMES UNIT 5.pptx
POINT- BIOCHEMISTRY SEM 2 ENZYMES UNIT 5.pptxPOINT- BIOCHEMISTRY SEM 2 ENZYMES UNIT 5.pptx
POINT- BIOCHEMISTRY SEM 2 ENZYMES UNIT 5.pptxSayali Powar
 
Presentation by Andreas Schleicher Tackling the School Absenteeism Crisis 30 ...
Presentation by Andreas Schleicher Tackling the School Absenteeism Crisis 30 ...Presentation by Andreas Schleicher Tackling the School Absenteeism Crisis 30 ...
Presentation by Andreas Schleicher Tackling the School Absenteeism Crisis 30 ...EduSkills OECD
 
Grant Readiness 101 TechSoup and Remy Consulting
Grant Readiness 101 TechSoup and Remy ConsultingGrant Readiness 101 TechSoup and Remy Consulting
Grant Readiness 101 TechSoup and Remy ConsultingTechSoup
 
Z Score,T Score, Percential Rank and Box Plot Graph
Z Score,T Score, Percential Rank and Box Plot GraphZ Score,T Score, Percential Rank and Box Plot Graph
Z Score,T Score, Percential Rank and Box Plot GraphThiyagu K
 
Introduction to AI in Higher Education_draft.pptx
Introduction to AI in Higher Education_draft.pptxIntroduction to AI in Higher Education_draft.pptx
Introduction to AI in Higher Education_draft.pptxpboyjonauth
 
1029-Danh muc Sach Giao Khoa khoi 6.pdf
1029-Danh muc Sach Giao Khoa khoi  6.pdf1029-Danh muc Sach Giao Khoa khoi  6.pdf
1029-Danh muc Sach Giao Khoa khoi 6.pdfQucHHunhnh
 
Nutritional Needs Presentation - HLTH 104
Nutritional Needs Presentation - HLTH 104Nutritional Needs Presentation - HLTH 104
Nutritional Needs Presentation - HLTH 104misteraugie
 
Paris 2024 Olympic Geographies - an activity
Paris 2024 Olympic Geographies - an activityParis 2024 Olympic Geographies - an activity
Paris 2024 Olympic Geographies - an activityGeoBlogs
 
Web & Social Media Analytics Previous Year Question Paper.pdf
Web & Social Media Analytics Previous Year Question Paper.pdfWeb & Social Media Analytics Previous Year Question Paper.pdf
Web & Social Media Analytics Previous Year Question Paper.pdfJayanti Pande
 
microwave assisted reaction. General introduction
microwave assisted reaction. General introductionmicrowave assisted reaction. General introduction
microwave assisted reaction. General introductionMaksud Ahmed
 
Introduction to ArtificiaI Intelligence in Higher Education
Introduction to ArtificiaI Intelligence in Higher EducationIntroduction to ArtificiaI Intelligence in Higher Education
Introduction to ArtificiaI Intelligence in Higher Educationpboyjonauth
 
Software Engineering Methodologies (overview)
Software Engineering Methodologies (overview)Software Engineering Methodologies (overview)
Software Engineering Methodologies (overview)eniolaolutunde
 
Industrial Policy - 1948, 1956, 1973, 1977, 1980, 1991
Industrial Policy - 1948, 1956, 1973, 1977, 1980, 1991Industrial Policy - 1948, 1956, 1973, 1977, 1980, 1991
Industrial Policy - 1948, 1956, 1973, 1977, 1980, 1991RKavithamani
 
Mastering the Unannounced Regulatory Inspection
Mastering the Unannounced Regulatory InspectionMastering the Unannounced Regulatory Inspection
Mastering the Unannounced Regulatory InspectionSafetyChain Software
 
Q4-W6-Restating Informational Text Grade 3
Q4-W6-Restating Informational Text Grade 3Q4-W6-Restating Informational Text Grade 3
Q4-W6-Restating Informational Text Grade 3JemimahLaneBuaron
 
Organic Name Reactions for the students and aspirants of Chemistry12th.pptx
Organic Name Reactions  for the students and aspirants of Chemistry12th.pptxOrganic Name Reactions  for the students and aspirants of Chemistry12th.pptx
Organic Name Reactions for the students and aspirants of Chemistry12th.pptxVS Mahajan Coaching Centre
 
Call Girls in Dwarka Mor Delhi Contact Us 9654467111
Call Girls in Dwarka Mor Delhi Contact Us 9654467111Call Girls in Dwarka Mor Delhi Contact Us 9654467111
Call Girls in Dwarka Mor Delhi Contact Us 9654467111Sapana Sha
 

Recently uploaded (20)

Accessible design: Minimum effort, maximum impact
Accessible design: Minimum effort, maximum impactAccessible design: Minimum effort, maximum impact
Accessible design: Minimum effort, maximum impact
 
POINT- BIOCHEMISTRY SEM 2 ENZYMES UNIT 5.pptx
POINT- BIOCHEMISTRY SEM 2 ENZYMES UNIT 5.pptxPOINT- BIOCHEMISTRY SEM 2 ENZYMES UNIT 5.pptx
POINT- BIOCHEMISTRY SEM 2 ENZYMES UNIT 5.pptx
 
Presentation by Andreas Schleicher Tackling the School Absenteeism Crisis 30 ...
Presentation by Andreas Schleicher Tackling the School Absenteeism Crisis 30 ...Presentation by Andreas Schleicher Tackling the School Absenteeism Crisis 30 ...
Presentation by Andreas Schleicher Tackling the School Absenteeism Crisis 30 ...
 
Grant Readiness 101 TechSoup and Remy Consulting
Grant Readiness 101 TechSoup and Remy ConsultingGrant Readiness 101 TechSoup and Remy Consulting
Grant Readiness 101 TechSoup and Remy Consulting
 
Z Score,T Score, Percential Rank and Box Plot Graph
Z Score,T Score, Percential Rank and Box Plot GraphZ Score,T Score, Percential Rank and Box Plot Graph
Z Score,T Score, Percential Rank and Box Plot Graph
 
Introduction to AI in Higher Education_draft.pptx
Introduction to AI in Higher Education_draft.pptxIntroduction to AI in Higher Education_draft.pptx
Introduction to AI in Higher Education_draft.pptx
 
1029-Danh muc Sach Giao Khoa khoi 6.pdf
1029-Danh muc Sach Giao Khoa khoi  6.pdf1029-Danh muc Sach Giao Khoa khoi  6.pdf
1029-Danh muc Sach Giao Khoa khoi 6.pdf
 
Nutritional Needs Presentation - HLTH 104
Nutritional Needs Presentation - HLTH 104Nutritional Needs Presentation - HLTH 104
Nutritional Needs Presentation - HLTH 104
 
Paris 2024 Olympic Geographies - an activity
Paris 2024 Olympic Geographies - an activityParis 2024 Olympic Geographies - an activity
Paris 2024 Olympic Geographies - an activity
 
Web & Social Media Analytics Previous Year Question Paper.pdf
Web & Social Media Analytics Previous Year Question Paper.pdfWeb & Social Media Analytics Previous Year Question Paper.pdf
Web & Social Media Analytics Previous Year Question Paper.pdf
 
Staff of Color (SOC) Retention Efforts DDSD
Staff of Color (SOC) Retention Efforts DDSDStaff of Color (SOC) Retention Efforts DDSD
Staff of Color (SOC) Retention Efforts DDSD
 
microwave assisted reaction. General introduction
microwave assisted reaction. General introductionmicrowave assisted reaction. General introduction
microwave assisted reaction. General introduction
 
Introduction to ArtificiaI Intelligence in Higher Education
Introduction to ArtificiaI Intelligence in Higher EducationIntroduction to ArtificiaI Intelligence in Higher Education
Introduction to ArtificiaI Intelligence in Higher Education
 
Software Engineering Methodologies (overview)
Software Engineering Methodologies (overview)Software Engineering Methodologies (overview)
Software Engineering Methodologies (overview)
 
Industrial Policy - 1948, 1956, 1973, 1977, 1980, 1991
Industrial Policy - 1948, 1956, 1973, 1977, 1980, 1991Industrial Policy - 1948, 1956, 1973, 1977, 1980, 1991
Industrial Policy - 1948, 1956, 1973, 1977, 1980, 1991
 
Mattingly "AI & Prompt Design: The Basics of Prompt Design"
Mattingly "AI & Prompt Design: The Basics of Prompt Design"Mattingly "AI & Prompt Design: The Basics of Prompt Design"
Mattingly "AI & Prompt Design: The Basics of Prompt Design"
 
Mastering the Unannounced Regulatory Inspection
Mastering the Unannounced Regulatory InspectionMastering the Unannounced Regulatory Inspection
Mastering the Unannounced Regulatory Inspection
 
Q4-W6-Restating Informational Text Grade 3
Q4-W6-Restating Informational Text Grade 3Q4-W6-Restating Informational Text Grade 3
Q4-W6-Restating Informational Text Grade 3
 
Organic Name Reactions for the students and aspirants of Chemistry12th.pptx
Organic Name Reactions  for the students and aspirants of Chemistry12th.pptxOrganic Name Reactions  for the students and aspirants of Chemistry12th.pptx
Organic Name Reactions for the students and aspirants of Chemistry12th.pptx
 
Call Girls in Dwarka Mor Delhi Contact Us 9654467111
Call Girls in Dwarka Mor Delhi Contact Us 9654467111Call Girls in Dwarka Mor Delhi Contact Us 9654467111
Call Girls in Dwarka Mor Delhi Contact Us 9654467111
 

GROUP PROJECT CLEAR ESSENCE15Group Research Proje.docx

  • 1. GROUP PROJECT: CLEAR ESSENCE 15 Group Research Project Entry of Clear Essence Ethnic Skincare & Cosmetics Brand into the Kenyan Beauty Supply Market Contents Executive Summary……………………………………………………………… ………...……3 PART I: Evaluating Sustainability Business Model Opportunities · Purpose……………………………………………………………… ……………….……4
  • 2. · Environmental Analysis………………………………………………………………. ..…4 · Market Structure Analysis……………………………………………………………… …5 · Market Opportunities………………………………………………………… ………...…6 · Competitor Analysis……………………………………………………………… …….…6 · Key Insights……………………………………………………………… …………….…7 PART II: Evaluating Capability readiness of the · Purpose……………………………………………………………… …………………….7 · Value Analysis……………………………………………………………… …….………8 · Growth Strategy……………………………………………………………… ……...……8 · Collaboration/ Acquisition…………………………………………………………... ……9 · Key Insights……………………………………………………………… …………..….10 PART III:Implementation plan · Purpose……………………………………………………………… …………………...10 · Cage
  • 3. Analysis……………………………………………………………… …….………10 · Stakeholder Analysis………………………………………………………..……1 2 · Business Model………………………………………………………..……… …13 · Key Insights……………………………………………………………..… …….13 Exhibits/ Appendices · STEEP analysis……………………………………………………………… ………..…14 · Five Forces analysis……………………………………………………………… …… · Blue Ocean analysis……………………………………………………………… …… · 9 M analysis……………………………………………………………… …… References…………………………………………………………… ………………………… Executive Summary The Clear Essence Brand is one that has for many decades shown that it has the capabilities and the competencies, as well as tools and offerings, to enter into multiple markets. These entries have all ensured that there has been in place a direct and careful framework established that taps into the needs and openings in markets that have room for the Clear Essence brand to make an entry. The decision to explore the entry into Kenya
  • 4. is a recent move in that same direction. Kenya has a budding and exponentially growing cosmetics and beauty industry that is attracting the attention of local, regional and multinational cosmetics companies and firms. The room is available and the time is right for Clear Essence to make an entrance into this market while there are still many unexplored and untapped segments of the market that can be capitalized off of. Clear Essence can and should take this moment to enter as it has the growth potential and the tools needed, as well as an environment in Kenya that is an aligned match for the products that it has to offer. This is backed up through an extensive look at the operational realities of the Clear Essence brand, as well as the environmental realities of Kenya at this time. Part I – Evaluating Sustainability Business Model Opportunities Purpose The sustainability and the ability for this concept to work in Kenya is the main consideration of this segment. Here there is a push to understand the existing forces that can and will dictate the direction that the company can go in to compete and how its competition is in the first place. This will be accomplished with a breakdown of the existing competencies had and the existing market segments held by the competition which ranges from domestic brands, regional players as well as large multinationals that have all in recent years made a push to enter into the Kenyan beauty market (Situma, 2013). By understanding this, there can be a realistic analysis of the best direction and decisions that Clear Essence can make as it considers its potential into the Kenyan market. Environmental Analysis Social, technological, economic, environmental, and political conditions in Kenya all point to a nation that is a good fit for the expansion of this organization. The nation is one that in many ways has already been tested out over the last 5 years by other nations in terms of the strength and stability of these
  • 5. factors (Situma, 2013). Not only are these conditions stable and positive, they are also growing in terms of the manner in which the environment is able to support and allow for success for new entrants. This is because the as the economy and the political situations stabilize further and more economic investment occurs in East Africa, the more the population is able to support the growing demands amongst the middle and upper classes for luxury items, of which makeup counts towards. This is seen in a recent report that noted that the beauty industry is slated to grow across the board in East Africa specifically: (Odero, 2016) Clear Essence falls directly into these categories and is entering in a time when their products, which are crafted specifically for ethnic skin and hair, can capitalize off the growing trend and push in the cosmetics increases in Kenya. The environment in terms of the social and the economic are therefore very much so open and supportive of the decision to enter. Market structure analysis The Five Forces conditions on their own however do not necessarily seem that positive. This is because mainly the bargaining power of consumers, the threat of new entrants and the threat of substitute products are all quite high. This is because, while in some markets Clear Essence stands out for catering to the minority needs in healthcare/ skincare, in Kenya, this will be the major push and focus of the regional players and the domestic players in a big way already. There is in fact a large trend in Nigerian products making their way into Kenya as well (Beauty Africa, 2016). This leaves the consumers needing a large amount of push in marketing to establish any differentiation in the Clear Essence brand and the existing choices that there are. Market Opportunities for Alternative Business Models This is surely then for Clear Essence a red ocean that they are stepping into. However, they can attempt a blue ocean strategy and find new manners to offer to the population the same products, but under different concepts and with more creative
  • 6. marketing. This may be the manner in which they are able to address the needs of the company in a way that allows for a way to avoid the red and create the blue. This can be in the manner in which the products are gotten to the hands of the consumers, such as home to home Avon methods, or more of a collaborative and exclusive rollout and line to the consumers. There are manners in which they can avoid the red ocean by not entering into the market in the same manner that the existing competition, such as big names like Revlon have been doing since 2013. Competitor Analysis There are many local and regional players in the nation that can be considered as major firms, however, the Revlon brand is by far the largest multinational player in this market. They have entered in the last five years and have been pushing their brand quite hard as they attempt to make a strong cornering of this east African nation. Revlon is an organization that focuses on a centralized HR process that also allows for regional research and considerations so that they are able to be flexible and responsive to needs. They additionally enjoy a solid and organized supply chain that effectively gets items to their end locations with little disturbance. The customer relation strategy of the company is also refined and follows the overall parent company brands of offering integrated and responsive channels to give their consumers a voice. Revlon is additionally known for investment that falls on the side of a budgetary approach. The organization also uses a private-social combination for its stewardship that focuses on CSR as well as shareholder returns. Conduct 9 M analysis of a major firm in the target local market, to understand the functional strategies driving that firm’s success Key insights This market and entering into it has certain risks that must be taken into consideration. The environment and the market are neither fully open and easy and neither are they closed off and too difficult. What is needed is a plan that takes into account
  • 7. the fact that the country is in fact growing its cosmetics industry and is in a position to let far more competitors in during this time when companies are still vying for open segments of the market. However, there is a need to enter in a manner that prepares for the need for differentiation to be able to capture not only new segments, but also some that are already claimed by others. Part II – Evaluating Capability Readiness of the Firm Purpose This segment lays out the many reasons that the Clear Essence brand is ready to further expand and enter into the Kenyan and the East African market. This is shown through a combination of the analysis of not only the company itself, but also the readiness of the Kenyan market itself (Lati, 2014). Through a value analysis as well as a look at possible expansion, growth and collaboration potentials, there can be a manner for Clear Essence to assess itself, and see that it is indeed ready and capable of making this entry now, while there is still considerable room for it to make an entrance. The additional purpose of this segment is to highlight that there is a need to ensure that there is a focus on strategic integration and growth strategies on the part of Clear Essence before it enters, as well as in a continuous manner as it is in this nation. The threats of new entrants will only grow as time goes on, and high-level mergers and acquisitions on the part of multinationals organizations like Revlon can be a serious threat if they are not considered while making growth strategies for the company. Value analysis Clear Essence has a value in its precise and extensive focus on a single area of retail concern. For well over 25 years they have been offering skincare as well as haircare products that cater to a large and core customer base (Clear Essence). They have shown that they have the tools and the capabilities, as well as competencies to carry their model and their products across a
  • 8. variety of nations and continents having to date expanded into multiple parts of the world. They have allowed there to be multiple streams in which the products are available to the consumers which include assigning ambassadors to sell the items, online stores, physical partners and retail store locations. This combination shows that they have the custom solutions and dynamic and extensive capabilities to enter into the Kenyan market using these same tools and approaches. The advantages for Clear Essence can also be seen in the fact that the Kenyan market has related industries and support capabilities that are vital for the Clear Essence brand, such as location, raw supplies and fulfillment partners. The demand conditions also create an environment that allows there to be room for new entrants to come in as well. Growth strategy By entering into this new market, the Clear Essence brans will in fact be growing in a general manner. They can further this by also making an effort to engage with and work with the local brands for brand expansions, or by creating more collaborations and making purchases of local brands to allow it to have more ability in reaching market segments within the cosmetics users in the nation. There is no reason to break from and fail to align with the existing structures of their company process, as this has been one that has worked for them to date in the many nations they have gone into already. The best bet for growth in the integration would be to focus on strategic alliances to save money in the short run, as well as strategic acquisitions that can allow for careful control over well-researched market segments. The major risk for growth will be the existing competition and the real possibility that as this region expands more and more and gains the attention of other organizations, there will be new entrants that will capture more market segments through better alliances and acquisitions/ mergers. Collaboration / Acquisition Strategy The Clear Essence brand should be focused greatly on both of these areas of consideration. Both the idea of collaboration as
  • 9. well as acquisition are imperative if there is to be both growth as well as a securing of market segments for Clear Essence. The motivation should be to preemptively consider the new entrants and the potential for substitutes for the consumer. There should also be the consideration of the need to ensure growth in a dynamic and continuous manner. The collaboration can be with a number of companies and organizations in terms of both actual brands, warehousing and shipping/ fulfillment centers as well as stores. The fact that there are brand ambassadors can mean that local chain stores for beauty supplies can be worked with to create specific lines in a complimentary and related diversification strategy. There can also be special brands created with larger stores to piggyback off their market and foot traffic and increase their exposure and visibility to more consumers. There can also be a consideration of creating with these same larger stores strategic alliances that can be beneficial to them both. The major drawback of these options can be seen in the risk of getting bogged down in what may only be short-term alliances that may not be long-term what the organization needs, and can cost it some autonomy. Key Insights What can be seen and learned in these considerations is that there are many paths that can be open to Clear Essence as far as expansion and collaboration go. Growth needs to be a constant consideration that they are focused on if they are to attempt any long-term viability and competitiveness in this potentially red ocean market. The value analysis shows that Clear Essence is in a god position and that they can in fact make the jump and have many options in front of them for expansion and collaboration. These however, will only be fruitful with a diverse look at multiple options that can be taken advantage of in a way that allows for them to grow using multiple tools. These tools include things such as the focus on creating strategic alliances that can help it to reach more people through relationships, as well as the crafting of creative and new manners of selling and presenting the products that they have in their brand.
  • 10. Part III – Implementation plan Purpose This segment endeavors to assess the cultural, economic, administrative and geographical differences that can be found in this nation and how that will create opportunities for adjustment on the part of Clear Essence in terms of incorporating these norms into its business practices, its operations as well as its overall product pricing and offering. CAGE analysis The major considerations in terms of government, geography and economic differences can be seen in this organization and its intended market as not being hard to bridge. Again, this is because the company has already entered into, and in actuality started in, markets in Africa, the Caribbean and so on. They are therefore well aware of the implications and the needs of these markets. The cultural angles that most affect the offerings are in particular already addressed as the Clear Essence brand is focused on offering items custom crafted and created to be offered to the ethnic communities that are dominant in Kenya. The target market is therefore already in line with the goals and the realities of the Clear Essence company. Additionally, as the nation’s company is labeled as a lower middle income by the World Bank, the price ranges of the offerings fall in line with the economic abilities and realities of Kenya (Euromonitor International, 2017). Additionally, in terms of the economic and the administrative angles of doing business and expanding business, Kenya is ranked as participating in reform that is making doing business easier and more fluid (The World Bank). The major area that do need to be addressed will be the operational manners in which the company addresses itself and others. This means ensuring to know that in Kenya there are cultural norms in business that intersect at a line in which there is a need and push for casual relationships as well as formal business ones at the same time. The conditions however overall
  • 11. are conducive and line up well enough with the Clear Essence brand that is already a multinational company that is sold across many continents. The Kenyan CAGE variables also allow for the company to enjoy many commonalities with the anticipated market with only some considerations needed for the cultural business realities and operational realities once the market has been entered into. Stakeholder analysis There will be a variety of stakeholders in this expansion into Kenya scenario. The largest and most obvious will be the shareholders of the Clear Essence company. These individuals will be able to decide ultimately if there is going to be any entry at all as they may not find it to be a prudent or profitable decision to make at all. These stakeholders are the ones who will make the decisions and the only manner to manage them and their power is to be prepared with answers, figures and data that shows that this is a viable and lucrative endeavor to embark upon. This can be done with transparency at the highest levels. Another stakeholder will be the employees at all levels of this organization. These individuals will have a good amount of power themselves because they will be needed to fill a variety of functions as this organization embarks on their path towards this entry into Kenya. Their power needs to be managed as well through transparency and inclusion so that they are aware of the goals and the reasons for the expansion so that they do not push against any change and internally slow down the process. This will also include the new employees of the company in Kenya directly, who will also have power and need to be treated in an equitable and balanced manner to control and manage their power. Another stakeholder will be the consumers themselves as well as those who are connected to the company through proximity of chipping methods, store locations, etc. These individuals have power in that they can affect support for, and thereby survival of the company the latter group has much less power than the actual consumers. Both can be managed through
  • 12. systems that offer them transparency, fairness and cooperation as well as listening to their needs in constructive manners. Business model The business models that should be used is a collaborative one. This means that they should focus at first on entering with strategic alliances that sees them working with existing brands and stores to sell the items through their brick and mortar locations. This can save the Clear Essence brans considerable money and energy as they find their footing and also gives them access to larger segments of the market right from the start. The market selection process itself has identified Kenya as a nation that has a large growth and focus on the beauty industry and is increasing exponentially on a yearly basis. Key insights This analysis has shown that once again Clear Essence is in a strong position to enter this market and has in its capabilities the tools needed to create a multipronged approach to entering into the Kenyan market, and can choose to use multiple of them to start with, or it can choose to focus on one business strategy in full. The existing stakeholders in the company’s activities can also be managed in a way that allows for the regional realities to be addressed and focused on as well. These make the implementation plan of the company one that can very easily be put into action with a number of strengths and tools in favor of Clear Essence and its desired activities in offering their products inside of Kenya. Exhibits STEEP Analysis Content Five Forces Analysis Content Blue Ocean Analysis Content 9 M Analysis
  • 13. Content References Clear Essence Company Homepage. Retrieved from: https://www.clearessence.com/Euromonitor International (2017). Beauty and Personal Care in Kenya. http://www.euromonitor.com/beauty-and-personal-care-in- kenya/reportLati, M. (2014). Nigerian entrepreneur enters Kenya’s cosmetics market. Business Daily Africa. Retrieved from: http://www.businessdailyafrica.com/Corporate- News/Nigerian-enters-Kenya-cosmetics-market/- /539550/2537306/-/bp1wjpz/-/index.htmlBeauty Africa. (2016). Beauty Industry: Growth Spots in East Africa. http://beauty- africa.com/beauty-industry-growth-spots-in-the-greater-east- africa-region/Odero, C. (2016). The rise of the Kenya beauty industry. http://www.nation.co.ke/lifestyle/lifestyle/The-rise-of- the-Kenya-beauty-industry/1214-2928452- i3stlwz/index.htmlSituma,E. (2013). Cosmetics brands battling for Kenyan market. Business Daily Africa. Retrieved from: http://www.businessdailyafrica.com/Cosmetics-brands-battling- for-Kenyan-market/-/1248928/1745578/-/10k9g37/- /index.htmlThe World Bank. Doing Business in Kenya. Retrieved from: http://www.doingbusiness.org/data/exploreeconomies/kenya 1 Differences and the CAGE Distance Framework 1 Pankaj Ghemawat
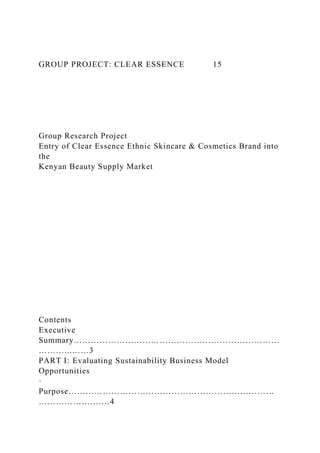
  • 14. After analyzing the cases in section 1, the reality of semiglobalization and the importance of cross-country differences should be clear. This section introduces the CAGE distance framework, which is used to identify and prioritize the differences between countries that companies must address when developing cross-border strategies. 2 Begin by considering the example summarized in exhibit 2-1, which plots Walmart’s operating margin by country in 2004 against the distance between each country’s capital and Walmart’s headquarters in Bentonville, Arkansas. The impact of geographic distance is obvious, but what other types of difference or distance can you identify that separated the markets that were profitable for Walmart from those that weren’t?
  • 15. Exhibit 2-1 Walmart International’s Operating Margin by Country (2004 estimates) Figure 2-1: Wal-Mart International’s Operating Margin by Country, 2004 (Estimated) 2
  • 16. The CAGE distance framework disaggregates distance or difference into four major categories: Cultural, Administrative, Geographic, and Economic. Differences along these dimensions generally have a negative effect on many cross-border interactions, although in some cases, differences along a limited subset of CAGE dimensions can actually encourage rather than discourage such interactions. 3 Each of these broad types of difference or distance is illustrated by the Walmart example. beliefs, values, and social norms—the unwritten, unspoken rules of the game—that shape the behavior of individuals and organizations. Cultural distance encompasses differences in religious beliefs, race/ethnicity, language, and social norms and values. Societies even differ in their social attitudes toward market power and globalization in ways that have important
  • 17. effects, both formally via regulation and informally, on how businesses operate. 4 Interestingly, Walmart’s four profitable markets share linguistic, religious and ethnic similarities or, at least, ties through large diaspora. distance: Historical and political associations between countries—colonial links, free trade agreements, the tenor of current relationships—profoundly affect economic exchange between them—which is the same as saying that differences along these dimensions matter a great deal. So, of course, do administrative attributes specific to a particular country such as autarchic policies or weak institutions and high levels of corruption. In the Walmart example, note that two of the profitable countries, Canada and Mexico, partner with the United States in a regional free trade agreement, the North American Free Trade Agreement (NAFTA). And a third profitable ―country‖
  • 18. as classified by Walmart, Puerto Rico, is officially an unincorporated territory of the United States. involves more than just how far two countries are from each other: other attributes to be considered include contiguity, a country’s physical size, within-country distances to borders, 3 access to the ocean, topography, and even time zones. Exhibit 2- 1 makes it clear that the capital city of each of Walmart’s four profitable ―countries‖ is geographically closer to Walmart’s headquarters than the capitals of any of the unprofitable ones; in addition, Canada and Mexico share a common land border with the United States. of labor are the most obvious (and related) determinants of
  • 19. economic distance between countries. Others include differences in availability (or lack) of resources, inputs, infrastructure and complements, and organizational capabilities. It seems a bit harder for Walmart to do well in poorer countries—although the number of data points is very limited. Note, however, that economic distance has not been entirely or even primarily a liability for Walmart. The company saves more money by procuring merchandise from China—exploiting economic distance, particularly in terms of labor costs—than it makes from its entire international store network. We will return to such strategies in section 5, which discusses arbitrage. What the Numbers Tell Us International economists have adapted Newton’s law of universal gravitation to describe trade and other international economic interactions. Thus, the simplest gravity model of international trade
  • 20. between two countries predicts that trade will be directly related to their economic sizes (a unilateral attribute of each country) and inversely related to the physical distance between them (a bilateral or country-pair attribute). Augmented gravity models add measures of other types of differences as well as unilateral attributes. Exhibit 2-2 shows the results of one such analysis that evaluated cultural, administrative, geographic, and economic effects on trade. 4 Exhibit 2-2 Effects of Similarities Versus Differences on Bilateral Trade
  • 21. Dimensions of Distance/Proximity Determinant Change in Trade Cultural Administrative Geographic Economic Common language Common regional trading bloc Colony/colonizer links Common currency Differences in corruption
  • 22. Physical distance: 1% increase Physical size: 1% increase Landlockedness Common land border Economic size: GDP (1% increase) Income level: GDP per capita (1% increase) +42% +47% +188% +114% –11% –1.1% –0.2% –48% +125%
  • 23. +0.8% +0.7% Source: Pankaj Ghemawat and Rajiv Mallick, “The Industry- Level Structure of International Trade Networks: A Gravity-Based Approach,” working paper, Harvard Business School Boston, February 2003. The estimates correct for unobserved thresholds for participation in trade and are all significant at the 1% level but are, in a number of cases, smaller than those reported in many other studies, apparently due to the correction The signs on most of the estimates in the table probably accord with your intuitions (although they cannot be reconciled with a fully globalized ―flat‖ world). What are probably more surprising are the magnitudes of some of the effects—for example, that countries with colonial ties are apt to trade almost three times as much as countries
  • 24. without them, or even more if one also accounts for the role of colonial ties in generating cultural similarities! The persistence of such large effects decades and, in some instances, more than a century after the original colonial relationships were dissolved reinforce the conclusion that complete globalization—as in the disappearance of the effects of such considerations—is extremely unlikely anytime soon. Similarities versus differences along many of the same dimensions also help explain foreign direct investment or companies’ foreign presence. Thus, for U.S. companies that operate in just one foreign country, that 5 country is Canada 60 percent of the time (and 10 percent of the time it is
  • 25. the United Kingdom). 5 Gravity models have also been adapted to explain cross-border interactions as diverse as equity trading, e- commerce transactions, patent citations, immigrant flows, air traffic, phone calls, and even the incidence of wars! The basic conclusion from this literature is that differences between countries—and differences in differences— matter in significant, predictable ways. Identifying and Prioritizing Differences Having highlighted the persistent impact of cross-country differences or distances, the rest of this section focuses on using the CAGE distance framework to identify and prioritize the differences that must be accounted for in developing global strategies. Exhibit 2-3 helps in this regard by identifying bilateral and unilateral factors to consider for each
  • 26. of the CAGE categories. Exhibit 2-3 The CAGE Framework at the Country Level Cultural Distance Administrative Distance Geographic Distance Economic Distance Country pairs (bilateral) languages t ethnicities; lack of connective
  • 28. time zones climates / disease environments differences differences in cost or quality of natural resources, financial resources, human resources, infrastructure, and information or knowledge
  • 29. Countries (unilateral) economy (home bias vs. foreign bias) membership in international organizations navigability remoteness transportation
  • 30. income 6 corruption or communication links The most distinctive feature of the CAGE framework is that it encompasses the bilateral attributes of country pairs as well as the unilateral attributes of individual countries. Most of the other frameworks that have been proposed for thinking about the differences across countries (or locations) focus on just unilateral attributes; that is, they assume that countries can be assessed one by one against a common
  • 31. set of yardsticks. Note that this characterization applies not only to cardinal indices such as the World Economic Forum’s Global Competitiveness Index or Transparency International’s Corruption Perceptions Index but also to ordinal ranking schemes such as Michael Porter’s ―diamond‖ framework for diagnosing the (relative) international competitiveness of different countries as home bases in specific industries. But indexicality of this sort is restrictive since it can’t deal with ideas such as ―The U.S. is closer to Canada than it is to Indonesia.‖ More generally, indexicality is incapable of capturing bilateral differences of the sort necessary to envision countries as existing in (and even occupying) space in relation to each other, that is, as nodes in a network instead of as an array along a common yardstick. 6 Having drawn that distinction between unilateral and bilateral
  • 32. influences, it is useful to add that they can be fitted together into the same overall structure. Specifically, unilateral measures of isolation (or integration) capturing country-specific attributes that generally decrease (or increase) a country’s involvement in cross-border economic activities can be treated as a common component of that country’s distances along various dimensions from all other countries. For example, really isolated countries (characterized by unique, ingrown cultures, closed administrative policies, physical remoteness, or extremely high or low incomes) can be thought of as being relatively distant from everywhere else. That said, one needs to add bilateral indicators to such unilateral conceptions to capture the idea that a company’s home base affects which countries are close and which ones are farther away.
  • 33. The other point worthy of even more emphasis is that different types of distance matter to different extents in different industries. For instance, 7 since geographic distance affects the costs of transportation, it is of particular importance to companies dealing in heavy or bulky products. Cultural distance, on the other hand, shapes consumers’ product preferences and should be a crucial consideration for a consumer goods or media company—but is much less important for a cement or steel business. Exhibit 2-4 provides a summary of the characteristics that are likely to make an industry particularly sensitive to a particular kind of distance. Exhibit 2-4 The CAGE Framework at the Industry Level
  • 34. Cultural Distance Administrative Distance Geographic Distance Economic Distance Cultural differences matter the most when: linguistic content (TV programs) cultural or national identity (foods) vary in terms of
  • 35. size (cars) or standards (electrical equipment) country-specific quality associations (wines) Government involvement is high in industries that are: goods (electricity) ―entitlements‖ (drugs) (farming) government (mass transportation)
  • 36. (aerospace) security (telecommunications) resources (oil, mining) costs (infrastructure) Geography plays a more important role when: value-to-weight or bulk ratio (cement) or perishable (glass, fruit) and operational requirements are
  • 37. high (services) Economic differences make the biggest impact when: varies with income (cars) standardization or scale are limited (cement) factor cost differences are salient (garments) or business systems are different (insurance) be responsive and
  • 38. agile (home appliances) Applications of the CAGE Distance Framework The CAGE framework, once it is taken down to the industry level, lends itself to a very broad array of applications. Let’s focus here on four of the most important ones. 8 Making Differences Visible One application of the CAGE distance framework is to make key differences visible. While this application may seem too obvious to be worth belaboring, most notable international business debacles
  • 39. can be traced back to a failure to appreciate a key type of cross-country difference or distance. Furthermore, in a very diverse world, managers cannot simply fall back on personal experience to ensure adequate sensitivity to differences. Checklists of the sort embedded in exhibits 2-3 and 2-4 can help even experienced people avoid errors due to forgetfulness and cognitive overload in a complex environment. Understanding the Liability of Foreignness A second application of the CAGE framework is to pinpoint the differences across countries that might handicap multinational companies relative to local competitors—the so-called liability of foreignness—or more generally affect their relative positions. This can be a useful exercise for both multinationals and their local competitors. When there are substantial liabilities of foreignness, multinationals often
  • 40. look to acquire or set up joint ventures with local firms to overcome these barriers. Assessing Natural Owners and Comparing Foreign Competitors Even if multinationals can be confident that they are going to prevail over local competitors in a particular market, the CAGE framework can be used at a finer level of resolution to shed light on the relative position of multinationals from different countries. For example, CAGE analysis can help explain why Spanish firms do well in many industries across Latin America, but also why success in Mexico has proved comparatively easier for U.S. firms. 7 Again, such analysis is most valuable when conducted at the industry level and is indicative rather than decisive. Thus, particularly good or bad global strategies
  • 41. can matter more than ―natural ownership‖ advantages. 9 Comparing Markets and Discounting by Distance The CAGE framework can also be used to compare markets from the perspective of a particular company. One method to conduct quantitative analysis of this type is to discount (specifically, divide) raw measures of market size or potential with measures of distance, broadly defined. While such discounting involves numerous approximations, making some adjustments of market potential for distance is a better idea, given how much distance matters, than refraining from making any
  • 42. adjustments at all. Some companies do formally use methods of this sort in deciding to enter or exit markets (as described in the first case in this section, on Grolsch). Conclusion The CAGE framework helps identify the most important cross- country differences and their implications for strategy. However, understanding differences is not a sufficient basis for setting global strategy. Think back to the ADDING value scorecard from the previous section and ask yourself how each type of difference or distance affects the six levers for value addition and subtraction. Is it a challenge that must be accounted for and addressed? Or does it offer an opportunity to improve economic profitability? The next three sections help address these questions by
  • 43. introducing three types of strategies for creating and claiming value in the presence of cross-border differences: adaptation, aggregation, and arbitrage. 1 Pan kaj Gh em aw at An d Jord an I. Siegel, ― Cases on Redefining Global Strategy‖ , (H arv ard Bu sin ess Review Press, 2011):59-69 2 For a more extended treatment of this material, see Pankaj Ghemawat, ―Distance Still Matters: The Hard Reality of Global Expansion,‖ Harvard Business Review, September 2001. This topic is also addressed at substantially greater length in chapter 2 of Pankaj Ghemawat, Redefining Global Strategy (Harvard Business School Press, 2007), and chapter 3 of Pankaj Ghemawat, World 3.0: Global Prosperity and How to Achieve It (Harvard Business Review Press, 2011). For a collection of maps
  • 44. that highlight distance effects, see www.ghemawat.com. 10 3 For further discussion of the ways in which CAGE differences can encourage rather than discourage cross-border activity, see the discussion of arbitrage in section 5 and the references cited therein. 4 For an original discussion of cultural distance and how it affects foreign direct investment, see Jordan Siegel, Amir Licht, and Shalom Schwartz, ―Egalitarianism, Cultural Distance, and FDI: A New Approach,‖ working paper, Harvard Business School, Boston, October 2008. 5 Su san E. Fein berg, ―Th e Exp an sion an d Location Patter n s of U.S. Mu ltin ation als,‖ u n p u blish ed w orkin g p ap er, Ru tgers Un iversity, 2005.
  • 45. 6 For a more extended discussion of indexicality in a broader social science context, see Andrew Abbott, Chaos of Disciplines (Chicago: University of Chicago Press, 2001). 7 Subramanian Rangan and Aldemir Drummond, ―Explaining Outcomes in Competition among Foreign Multinationals in a Focal Host Market,‖ Strategic Management Journal 25, no. 3: 285–293.