Ejercicio markowitz dos activos
•Download as XLS, PDF•
1 like•583 views

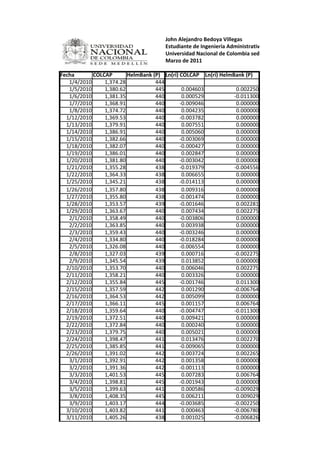
The document appears to be a table containing daily stock price data for two Colombian companies, COLCAP and HelmBank, from January 4, 2010 to July 8, 2010. It includes the stock price and logarithmic return for each day.

Recommended
More Related Content
Viewers also liked
Similar to Ejercicio markowitz dos activos
Similar to Ejercicio markowitz dos activos (20)
Recently uploaded
Recently uploaded (20)
Ejercicio markowitz dos activos
- 1. John Alejandro Bedoya Villegas Estudiante de Ingeniería Administrativa Universidad Nacional de Colombia sede Medellín Marzo de 2011 Fecha COLCAP HelmBank (P) Ln(ri) COLCAP Ln(ri) HelmBank (P) 1/4/2010 1,374.28 444 1/5/2010 1,380.62 445 0.004603 0.002250 1/6/2010 1,381.35 440 0.000529 -0.011300 1/7/2010 1,368.91 440 -0.009046 0.000000 1/8/2010 1,374.72 440 0.004235 0.000000 1/12/2010 1,369.53 440 -0.003782 0.000000 1/13/2010 1,379.91 440 0.007551 0.000000 1/14/2010 1,386.91 440 0.005060 0.000000 1/15/2010 1,382.66 440 -0.003069 0.000000 1/18/2010 1,382.07 440 -0.000427 0.000000 1/19/2010 1,386.01 440 0.002847 0.000000 1/20/2010 1,381.80 440 -0.003042 0.000000 1/21/2010 1,355.28 438 -0.019379 -0.004556 1/22/2010 1,364.33 438 0.006655 0.000000 1/25/2010 1,345.21 438 -0.014113 0.000000 1/26/2010 1,357.80 438 0.009316 0.000000 1/27/2010 1,355.80 438 -0.001474 0.000000 1/28/2010 1,353.57 439 -0.001646 0.002281 1/29/2010 1,363.67 440 0.007434 0.002275 2/1/2010 1,358.49 440 -0.003806 0.000000 2/2/2010 1,363.85 440 0.003938 0.000000 2/3/2010 1,359.43 440 -0.003246 0.000000 2/4/2010 1,334.80 440 -0.018284 0.000000 2/5/2010 1,326.08 440 -0.006554 0.000000 2/8/2010 1,327.03 439 0.000716 -0.002275 2/9/2010 1,345.54 439 0.013852 0.000000 2/10/2010 1,353.70 440 0.006046 0.002275 2/11/2010 1,358.21 440 0.003326 0.000000 2/12/2010 1,355.84 445 -0.001746 0.011300 2/15/2010 1,357.59 442 0.001290 -0.006764 2/16/2010 1,364.53 442 0.005099 0.000000 2/17/2010 1,366.11 445 0.001157 0.006764 2/18/2010 1,359.64 440 -0.004747 -0.011300 2/19/2010 1,372.51 440 0.009421 0.000000 2/22/2010 1,372.84 440 0.000240 0.000000 2/23/2010 1,379.75 440 0.005021 0.000000 2/24/2010 1,398.47 441 0.013476 0.002270 2/25/2010 1,385.85 441 -0.009065 0.000000 2/26/2010 1,391.02 442 0.003724 0.002265 3/1/2010 1,392.91 442 0.001358 0.000000 3/2/2010 1,391.36 442 -0.001113 0.000000 3/3/2010 1,401.53 445 0.007283 0.006764 3/4/2010 1,398.81 445 -0.001943 0.000000 3/5/2010 1,399.63 441 0.000586 -0.009029 3/8/2010 1,408.35 445 0.006211 0.009029 3/9/2010 1,403.17 444 -0.003685 -0.002250 3/10/2010 1,403.82 441 0.000463 -0.006780 3/11/2010 1,405.26 438 0.001025 -0.006826
- 2. 3/12/2010 1,406.49 435 0.000875 -0.006873 3/15/2010 1,404.42 435 -0.001473 0.000000 3/16/2010 1,411.71 435 0.005177 0.000000 3/17/2010 1,429.40 436 0.012453 0.002296 3/18/2010 1,432.30 436 0.002027 0.000000 3/19/2010 1,414.10 438 -0.012788 0.004577 3/23/2010 1,426.74 438 0.008899 0.000000 3/24/2010 1,422.69 438 -0.002843 0.000000 3/25/2010 1,427.24 440 0.003193 0.004556 3/26/2010 1,423.02 435 -0.002961 -0.011429 3/29/2010 1,429.29 435 0.004396 0.000000 3/30/2010 1,430.71 435 0.000993 0.000000 3/31/2010 1,440.58 435 0.006875 0.000000 4/5/2010 1,450.93 435 0.007159 0.000000 4/6/2010 1,460.30 435 0.006437 0.000000 4/7/2010 1,472.19 435 0.008109 0.000000 4/8/2010 1,472.76 435 0.000387 0.000000 4/9/2010 1,468.95 439 -0.002590 0.009153 4/12/2010 1,470.70 438 0.001191 -0.002281 4/13/2010 1,470.91 438 0.000143 0.000000 4/14/2010 1,478.40 435 0.005079 -0.006873 4/15/2010 1,481.14 440 0.001852 0.011429 4/16/2010 1,463.27 440 -0.012138 0.000000 4/19/2010 1,453.14 442 -0.006947 0.004535 4/20/2010 1,467.76 442 0.010011 0.000000 4/21/2010 1,475.06 442 0.004961 0.000000 4/22/2010 1,478.51 435 0.002336 -0.015964 4/23/2010 1,488.05 436 0.006432 0.002296 4/26/2010 1,484.44 440 -0.002429 0.009132 4/27/2010 1,472.11 435 -0.008341 -0.011429 4/28/2010 1,457.28 442 -0.010125 0.015964 4/29/2010 1,469.22 440 0.008160 -0.004535 4/30/2010 1,467.26 440 -0.001335 0.000000 5/3/2010 1,490.16 440 0.015487 0.000000 5/4/2010 1,481.63 440 -0.005741 0.000000 5/5/2010 1,446.55 435 -0.023961 -0.011429 5/6/2010 1,403.06 435 -0.030526 0.000000 5/7/2010 1,412.80 435 0.006918 0.000000 5/10/2010 1,438.18 424 0.017805 -0.025613 5/11/2010 1,442.63 424 0.003089 0.000000 5/12/2010 1,451.06 434 0.005826 0.023311 5/13/2010 1,454.93 435 0.002663 0.002301 5/14/2010 1,444.27 434 -0.007354 -0.002301 5/18/2010 1,429.49 434 -0.010286 0.000000 5/19/2010 1,406.37 434 -0.016306 0.000000 5/20/2010 1,395.99 434 -0.007408 0.000000 5/21/2010 1,397.39 434 0.001002 0.000000 5/24/2010 1,410.93 438 0.009643 0.009174 5/25/2010 1,399.25 438 -0.008313 0.000000 5/26/2010 1,432.82 438 0.023708 0.000000 5/27/2010 1,428.47 437 -0.003041 -0.002286 5/28/2010 1,446.48 437 0.012529 0.000000 5/31/2010 1,444.54 441 -0.001342 0.009112 6/1/2010 1,447.26 441 0.001881 0.000000 6/2/2010 1,451.91 441 0.003208 0.000000
- 3. 6/3/2010 1,453.36 430 0.000998 -0.025260 6/4/2010 1,430.30 430 -0.015994 0.000000 6/8/2010 1,433.27 430 0.002074 0.000000 6/9/2010 1,445.53 430 0.008517 0.000000 6/10/2010 1,446.34 435 0.000560 0.011561 6/11/2010 1,448.08 434 0.001202 -0.002301 6/15/2010 1,450.71 430 0.001815 -0.009259 6/16/2010 1,461.39 429 0.007335 -0.002328 6/17/2010 1,460.56 429 -0.000568 0.000000 6/18/2010 1,472.41 420 0.008081 -0.021202 6/21/2010 1,466.78 425 -0.003831 0.011834 6/22/2010 1,467.67 420 0.000607 -0.011834 6/23/2010 1,471.95 420 0.002912 0.000000 6/24/2010 1,468.73 415 -0.002190 -0.011976 6/25/2010 1,475.04 420 0.004287 0.011976 6/28/2010 1,472.02 420 -0.002050 0.000000 6/29/2010 1,453.60 415 -0.012592 -0.011976 6/30/2010 1,466.78 425 0.009026 0.023811 7/1/2010 1,459.01 420 -0.005311 -0.011834 7/2/2010 1,455.04 420 -0.002725 0.000000 7/6/2010 1,463.82 420 0.006016 0.000000 7/7/2010 1,462.31 420 -0.001032 0.000000 7/8/2010 1,474.59 415 0.008363 -0.011976 7/9/2010 1,478.49 415 0.002641 0.000000 7/12/2010 1,496.79 415 0.012302 0.000000 7/13/2010 1,507.16 413 0.006904 -0.004831 7/14/2010 1,521.17 411 0.009253 -0.004854 7/15/2010 1,532.45 411 0.007388 0.000000 7/16/2010 1,526.67 411 -0.003779 0.000000 7/19/2010 1,528.75 408 0.001362 -0.007326 7/21/2010 1,565.50 413 0.023755 0.012180 7/22/2010 1,566.33 413 0.000530 0.000000 7/23/2010 1,569.86 410 0.002251 -0.007290 7/26/2010 1,596.49 410 0.016821 0.000000 7/27/2010 1,602.61 408 0.003826 -0.004890 7/28/2010 1,591.33 410 -0.007063 0.004890 7/29/2010 1,562.05 410 -0.018571 0.000000 7/30/2010 1,571.62 415 0.006108 0.012121 8/2/2010 1,575.01 410 0.002155 -0.012121 8/3/2010 1,586.92 414 0.007533 0.009709 8/4/2010 1,595.41 412 0.005336 -0.004843 8/5/2010 1,601.01 415 0.003504 0.007255 8/6/2010 1,580.41 410 -0.012950 -0.012121 8/9/2010 1,582.51 443 0.001328 0.077413 8/10/2010 1,577.34 464 -0.003272 0.046315 8/11/2010 1,558.12 456 -0.012260 -0.017392 8/12/2010 1,557.42 441 -0.000449 -0.033448 8/13/2010 1,567.78 447 0.006630 0.013514 8/17/2010 1,575.02 439 0.004607 -0.018059 8/18/2010 1,581.48 445 0.004093 0.013575 8/19/2010 1,586.73 442 0.003314 -0.006764 8/20/2010 1,585.60 448 -0.000712 0.013483 8/23/2010 1,606.82 441 0.013294 -0.015748 8/24/2010 1,605.58 454 -0.000772 0.029052 8/25/2010 1,602.95 454 -0.001639 0.000000
- 4. 8/26/2010 1,616.93 451 0.008684 -0.006630 8/27/2010 1,639.89 456 0.014100 0.011025 8/30/2010 1,642.91 459 0.001840 0.006557 8/31/2010 1,664.18 466 0.012863 0.015135 9/1/2010 1,713.81 480 0.029386 0.029600 9/2/2010 1,681.03 480 -0.019312 0.000000 9/3/2010 1,687.24 475 0.003687 -0.010471 9/6/2010 1,719.62 486 0.019009 0.022894 9/7/2010 1,715.27 487 -0.002533 0.002055 9/8/2010 1,735.68 504 0.011829 0.034312 9/9/2010 1,730.15 495 -0.003191 -0.018019 9/10/2010 1,699.91 500 -0.017633 0.010050 9/13/2010 1,695.47 507 -0.002615 0.013903 9/14/2010 1,703.11 502 0.004496 -0.009911 9/15/2010 1,693.44 499 -0.005694 -0.005994 9/16/2010 1,691.32 490 -0.001253 -0.018201 9/17/2010 1,691.24 485 -0.000047 -0.010257 9/20/2010 1,709.46 487 0.010716 0.004115 9/21/2010 1,716.15 494 0.003906 0.014271 9/22/2010 1,707.34 488 -0.005147 -0.012220 9/23/2010 1,693.47 480 -0.008157 -0.016529 9/24/2010 1,697.26 476 0.002236 -0.008368 9/27/2010 1,711.46 481 0.008332 0.010449 9/28/2010 1,744.84 477 0.019316 -0.008351 9/29/2010 1,766.22 489 0.012179 0.024846 9/30/2010 1,769.50 485 0.001855 -0.008214 10/1/2010 1,766.79 490 -0.001533 0.010257 10/4/2010 1,766.42 483 -0.000209 -0.014389 10/5/2010 1,794.73 495 0.015900 0.024541 10/6/2010 1,825.05 500 0.016753 0.010050 10/7/2010 1,808.89 499 -0.008894 -0.002002 10/8/2010 1,826.38 490 0.009622 -0.018201 10/11/2010 1,845.91 494 0.010637 0.008130 10/12/2010 1,842.54 495 -0.001827 0.002022 10/13/2010 1,873.50 500 0.016663 0.010050 10/14/2010 1,855.43 499 -0.009692 -0.002002 10/15/2010 1,833.59 494 -0.011841 -0.010071 10/19/2010 1,857.75 496 0.013090 0.004040 10/20/2010 1,860.52 498 0.001490 0.004024 10/21/2010 1,877.98 485 0.009341 -0.026451 10/22/2010 1,906.66 490 0.015156 0.010257 10/25/2010 1,900.10 489 -0.003447 -0.002043 10/26/2010 1,870.75 480 -0.015567 -0.018576 10/27/2010 1,862.84 475 -0.004237 -0.010471 10/28/2010 1,871.21 470 0.004483 -0.010582 10/29/2010 1,901.83 478 0.016231 0.016878 11/2/2010 1,913.88 475 0.006316 -0.006296 11/3/2010 1,923.28 484 0.004899 0.018770 11/4/2010 1,942.37 488 0.009877 0.008230 11/5/2010 1,940.38 480 -0.001025 -0.016529 11/8/2010 1,939.96 475 -0.000216 -0.010471 11/9/2010 1,938.49 468 -0.000758 -0.014847 11/10/2010 1,889.62 449 -0.025534 -0.041445 11/11/2010 1,841.69 440 -0.025692 -0.020248 11/12/2010 1,795.09 448 -0.025628 0.018019
- 5. 11/16/2010 1,729.16 435 -0.037419 -0.029447 11/17/2010 1,786.89 440 0.032841 0.011429 11/18/2010 1,814.13 440 0.015129 0.000000 11/19/2010 1,778.83 436 -0.019650 -0.009132 11/22/2010 1,775.45 428 -0.001902 -0.018519 11/23/2010 1,750.36 428 -0.014232 0.000000 11/24/2010 1,790.15 435 0.022478 0.016223 11/25/2010 1,784.80 435 -0.002993 0.000000 11/26/2010 1,770.59 432 -0.007994 -0.006920 11/29/2010 1,762.11 427 -0.004801 -0.011642 11/30/2010 1,779.94 430 0.010068 0.007001 12/1/2010 1,793.55 427 0.007617 -0.007001 12/2/2010 1,825.55 438 0.017684 0.025435 12/3/2010 1,830.26 440 0.002577 0.004556 12/6/2010 1,841.85 440 0.006312 0.000000 12/7/2010 1,837.18 440 -0.002539 0.000000 12/9/2010 1,826.70 440 -0.005721 0.000000 12/10/2010 1,830.86 440 0.002275 0.000000 12/13/2010 1,841.24 436 0.005653 -0.009132 12/14/2010 1,845.71 442 0.002425 0.013668 12/15/2010 1,823.61 447 -0.012046 0.011249 12/16/2010 1,826.74 455 0.001715 0.017739 12/17/2010 1,823.10 461 -0.001995 0.013101 12/20/2010 1,815.55 458 -0.004150 -0.006529 12/21/2010 1,824.82 455 0.005093 -0.006572 12/22/2010 1,839.59 465 0.008061 0.021740 12/23/2010 1,846.50 470 0.003749 0.010695 12/24/2010 1,853.24 465 0.003644 -0.010695 12/27/2010 1,866.12 464 0.006926 -0.002153 12/28/2010 1,849.51 458 -0.008941 -0.013015 12/29/2010 1,839.72 457 -0.005307 -0.002186 12/30/2010 1,823.70 458 -0.008746 0.002186 1/3/2011 1,803.00 458 -0.011415 0.000000 1/4/2011 1,810.27 451 0.004024 -0.015402 1/5/2011 1,790.57 445 -0.010942 -0.013393 1/6/2011 1,766.77 445 -0.013381 0.000000 1/7/2011 1,781.71 450 0.008421 0.011173 1/11/2011 1,763.08 450 -0.010511 0.000000 1/12/2011 1,784.10 445 0.011852 -0.011173 1/13/2011 1,801.86 443 0.009905 -0.004505 1/14/2011 1,796.05 450 -0.003230 0.015678 1/17/2011 1,801.66 445 0.003119 -0.011173 1/18/2011 1,790.41 446 -0.006264 0.002245 1/19/2011 1,766.21 444 -0.013609 -0.004494 1/20/2011 1,741.61 435 -0.014026 -0.020479 1/21/2011 1,756.48 435 0.008502 0.000000 1/24/2011 1,759.99 437 0.001996 0.004587 1/25/2011 1,754.92 437 -0.002885 0.000000 1/26/2011 1,771.55 440 0.009432 0.006842 1/27/2011 1,773.04 453 0.000841 0.029117 1/28/2011 1,768.13 446 -0.002773 -0.015573 1/31/2011 1,762.43 446 -0.003229 0.000000 2/1/2011 1,759.61 446 -0.001601 0.000000 2/2/2011 1,745.24 450 -0.008200 0.008929 2/3/2011 1,735.96 448 -0.005332 -0.004454
- 6. 2/4/2011 1,709.06 440 -0.015617 -0.018019 2/7/2011 1,691.87 440 -0.010109 0.000000 2/8/2011 1,710.54 430 0.010975 -0.022990 2/9/2011 1,696.85 427 -0.008036 -0.007001 2/10/2011 1,687.92 425 -0.005277 -0.004695 2/11/2011 1,694.51 417 0.003897 -0.019003 2/14/2011 1,701.65 415 0.004205 -0.004808 2/15/2011 1,692.43 415 -0.005433 0.000000 2/16/2011 1,689.95 411 -0.001466 -0.009685 2/17/2011 1,666.93 408 -0.013715 -0.007326 2/18/2011 1,644.66 406 -0.013450 -0.004914 2/21/2011 1,658.33 422 0.008277 0.038652 2/22/2011 1,661.43 421 0.001868 -0.002372 2/23/2011 1,698.63 418 0.022143 -0.007151 2/24/2011 1,699.17 420 0.000318 0.004773 2/25/2011 1,713.40 420 0.008340 0.000000 2/28/2011 1,750.97 416 0.021690 -0.009569
- 7. dministrativa olombia sede Medellín 285 Indice-Accion Media Varianza Desv. Estandar (1) COLCAP 0.00085 0.000095 0.009737 (2) HelmBank (P) -0.00023 0.000149 0.012202 Matriz de Covarianza Ln(ri) COLCAP Ln(ri) HelmBank (P) (1) Ln(ri) COLCAP 0 0 (2) Ln(ri) HelmBank (P) 0 0 Matriz de Correlacion Ln(ri) COLCAP Ln(ri) HelmBank (P) (1) Ln(ri) COLCAP 1 0.26 (2) Ln(ri) HelmBank (P) 0.26 1 Datos tomados de http://www.grupoaval.com/portal/page?_pageid=33,54994&_dad=portal&_schema=PORTAL Resultados W* Optimo W* = (W1) (1-W*) = (W2) Ecuacion 10 0.649 0.351 Ecuacion 12 0.649 0.351 Varianza y volatilidad optima del portafolio Varianza Volatilidad Ecuacion 13 - 17 7.3E-05 8.5E-03 Ecuacion 13 - 17 7.3E-05 8.5E-03 Rendimiento medio del Portafolio Up Ecuacion 16 0.000473 Variasiones w no optimos Rentabilidad W1 W2 esperada 1 0 0.00085 0.9 0.1 0.00074 0.8 0.2 0.00064 0.7 0.3 0.00053 0.6 0.4 0.00042 0.5 0.5 0.00031 0.4 0.6 0.00020 0.3 0.7 0.00010 0.2 0.8 -0.00001 0.1 0.9 -0.00012 0 1 -0.00023 Puntos optimos 0.000473
- 8. Combinacion portafolios Portafolio optimo Frontera de portafolios 0.001000 0.00085 0.000800 0.00074 0.00064 Combinacion porta 0.000600 0.00053 0.000473 0.000400 0.00042 0.00031 Rentabilidad 0.000200 0.00020 media 0.00010 0.000000 -0.00001 -0.0 -0.000200 -0.000400 reduccion0.00700 0.00800 0.13 0.00900 Volatilidad 0.01000 0.01100
- 13. &_schema=PORTAL Desviación estandar 0.00974 0.00916 0.00875 0.00854 0.00854 0.00875 0.00915 0.00973 0.01044 0.01128 0.01220 0.00852
- 14. de portafolios Combinacion portafolios Portafolio optimo -0.00001 -0.00012 -0.00023 0 0.01100 0.01200 0.01300 0.01400