Download as PDF, PPTX
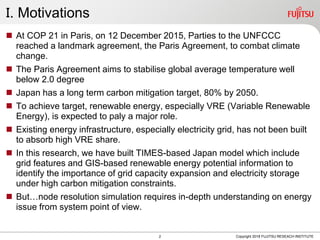

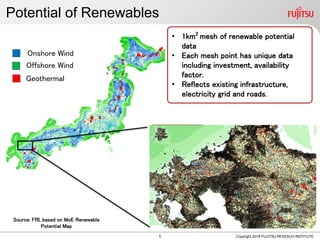
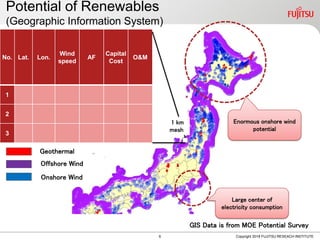
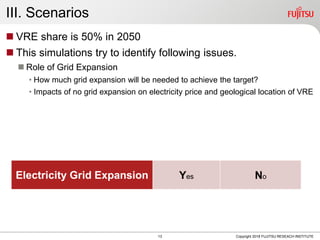

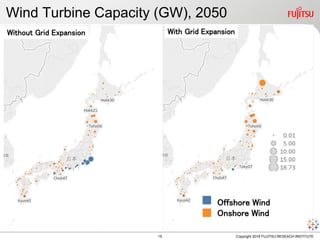
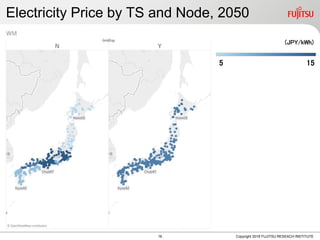
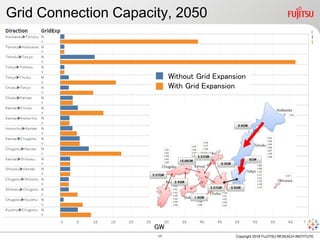
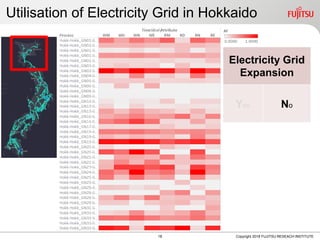
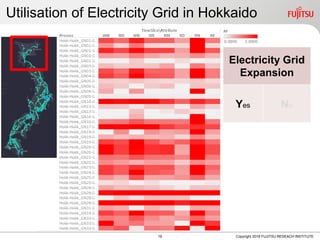
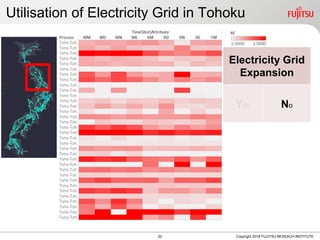
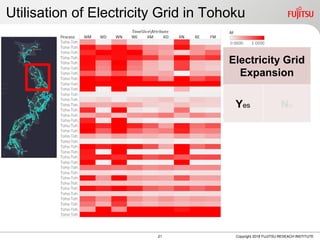

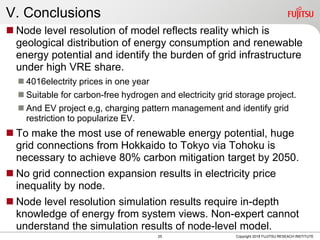

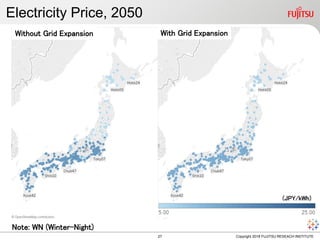
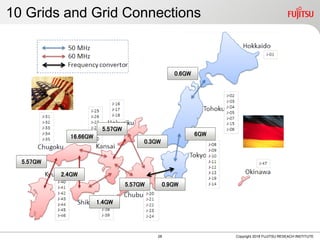


1) The document discusses a Japan TIMES-based energy system model that includes grid features and renewable energy potential data at a high node resolution to analyze the role of grid expansion under high renewable energy penetration. 2) Simulation results show that without grid expansion, renewable energy capacity is lower and electricity prices vary more across regions. 3) Achieving Japan's long term carbon target of 80% reduction by 2050 would require significant grid connections from Hokkaido to Tokyo via Tohoku to enable optimal use of renewable resources.


