grey relational analysis of Multi objective problem
1. M-, Manufacturing division,
Mechanical Dept, SRMIST, KTR
Grey Relation Analysis (GRA)
Calculations
1
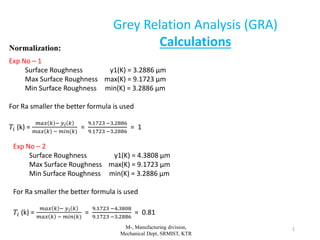
Normalization:
Exp No – 1
Surface Roughness y1(K) = 3.2886 µm
Max Surface Roughness max(K) = 9.1723 µm
Min Surface Roughness min(K) = 3.2886 µm
For Ra smaller the better formula is used
𝑇𝑖 (k) =
𝑚𝑎𝑥 𝑘 − 𝑦𝑖 𝑘
𝑚𝑎𝑥 𝑘 − 𝑚𝑖𝑛(𝑘)
=
9.1723 −3.2886
9.1723 −3.2886
= 1
Exp No – 2
Surface Roughness y1(K) = 4.3808 µm
Max Surface Roughness max(K) = 9.1723 µm
Min Surface Roughness min(K) = 3.2886 µm
For Ra smaller the better formula is used
𝑇𝑖 (k) =
𝑚𝑎𝑥 𝑘 − 𝑦𝑖 𝑘
𝑚𝑎𝑥 𝑘 − 𝑚𝑖𝑛(𝑘)
=
9.1723 −4.3808
9.1723 −3.2886
= 0.81
2. M-, Manufacturing division,
Mechanical Dept, SRMIST, KTR
Grey Relation Analysis
(GRA)
2
In Normalization, we have 3 options in which we have to decide whether we need Smaller
the better or Larger the better so for Surface Roughness (Ra) Smaller the better, Thrust
Force (Fz) Smaller the better, and Material removal rate (MRR) Higher the better is the
best option so by the help of MRR formula we calculated MRR and all other options are
calculated and Each experimental result is normalized and tabulated below.
2. Grey relational Co-efficient and grey relational grade
The next step is to find Grey relational co-efficient of the normalized values. The formula
which is used to find co-efficient is given below
𝐺𝑅𝐶𝑗 =
∆ 𝑚𝑖𝑛 + 𝛿∆𝑚𝑎𝑥
(∆ 𝑚𝑎𝑥 −∆𝑗)+𝛿∆𝑚𝑎𝑥
Where
𝐺𝑅𝐶𝑛𝑗 – Grey Relational Co-efficient for a corresponding value
∆𝑚𝑖𝑛 – Minimum value of corresponding parameters ∆𝑚𝑖𝑛= 0
∆𝑚𝑎𝑥 – Maximum value of corresponding parameters ∆𝑚𝑎𝑥= 1
𝛿 - The quality loss factor,
3. M-, Manufacturing division,
Mechanical Dept, SRMIST, KTR
3
Grey Relation Analysis (GRA)
Calculations
Grey relational Co-efficient and grey
relational grade:
∆𝑚𝑖𝑛 – Minimum value of corresponding parameters ∆𝑚𝑖𝑛= 0
∆𝑚𝑎𝑥 – Maximum value of corresponding parameters ∆𝑚𝑎𝑥= 1
In this project value is considered as 0.4 for Ra, 0.3 for Fz and MRR
𝐺𝑅𝐶1 =
∆ 𝑚𝑖𝑛 + 𝛿∆𝑚𝑎𝑥
(∆ 𝑚𝑎𝑥 −∆𝑗)+𝛿∆𝑚𝑎𝑥
=
0 +0.4∗1
1−∆𝑗 +0.4∗1
=
0.4
1−∆𝑗 +0.4
Exp No – 1
Normalized value ∆𝑗 = 1
𝐺𝑅𝐶1 =
0.4
1−1 +0.4
= 1
Exp No – 2
Normalized value ∆𝑗 = 0.81
𝐺𝑅𝐶1 =
0.4
1−0.81 +0.4
= 0.68
4. M-, Manufacturing division,
Mechanical Dept, SRMIST, KTR
4
Grey Relation Analysis (GRA)
Calculations
Grey relational grade:
for GRA Grade we take the average of 3 terms i.e. (Ra + Fz + MRR) /3
Grade =
𝑅𝑎+𝐹𝑧+𝑀𝑅𝑅
3
Exp No. 1
Grade =
1+0.42+0.26
3
= 0.56
Exp No. 1
Grade =
0.68+0.29+0.35
3
= 0.44
After getting Grade for all the 18 experiment ranking was done which is shown in next slide
table
5. M-, Manufacturing division,
Mechanical Dept, SRMIST, KTR
Grey Relation Analysis
(GRA)
5
In this, The Value of 𝛿 is 0.4 for Ra, 0.3 for Fz, and 0.3 for MRR. After this, the
average is taken out to find the Grade i.e. (Ra + Fz + MRR). After that Rank is
Calculated. Which is shown in below table
NORMALIZATION GREY REALTION CO-EFFICIENT
Exp No. Ra Fz MRR Ra Fz MRR Grade Rank
1 1.00 0.58 0.15 1.00 0.42 0.26 0.56 5
2 0.81 0.26 0.45 0.68 0.29 0.35 0.44 13
3 0.32 0.00 0.71 0.37 0.23 0.51 0.37 18
4 0.46 0.95 0.00 0.43 0.87 0.23 0.51 8
5 0.49 0.83 0.57 0.44 0.64 0.41 0.50 9
6 0.00 0.46 0.71 0.29 0.36 0.51 0.38 17
7 0.44 0.95 0.08 0.42 0.87 0.25 0.51 7
8 0.68 0.77 0.32 0.55 0.56 0.31 0.47 12
9 0.88 0.61 0.64 0.78 0.43 0.45 0.55 6
10 0.65 0.74 0.15 0.53 0.53 0.26 0.44 14
11 0.26 0.60 0.51 0.35 0.43 0.38 0.39 16
12 0.74 0.64 0.89 0.61 0.46 0.73 0.60 3
13 0.25 0.84 0.28 0.35 0.65 0.29 0.43 15
14 0.40 1.00 0.71 0.40 1.00 0.51 0.64 2
15 0.29 0.54 0.89 0.36 0.39 0.73 0.50 10
16 0.53 0.99 0.28 0.46 0.95 0.29 0.57 4
17 0.47 0.83 0.57 0.43 0.65 0.41 0.49 11
18 0.87 0.77 1.00 0.76 0.56 1.00 0.77 1
Normalization and Grey relation co-efficient table
6. M-, Manufacturing division,
Mechanical Dept, SRMIST, KTR
Results
6
Control Parameter Results Rank
Tool Point Angle 135
Spindle Speed 3500 1
Feed Rate 350
Pecking Depth 1.5
Input Para level
1
level
2
level
3
Delta Rank
Spindle
Speed
0.467 0.492 0.563 0.096 1
Feed Rate 0.504 0.488 0.530 0.042 3
Pecking
Depth
0.475 0.515 0.530 0.055 2
Optimized combination of parameters
Response Table for Grey Relational Grade
With the help of the ranking system, we get our
optimum combination of parameters with the
method GRA
The Response table for Grey relational Garde is
also shown in side table which shows that the
spindle speed most affecting the Hole quality
and Surface roughness.
7. M-, Manufacturing division,
Mechanical Dept, SRMIST, KTR
Data Envelopment Analysis based
Ranking (DEAR) Method
7
The DEAR method means Data Envelopment Analysis Based Ranking which is the
optimization technique of machined process, to do optimization with this technique
there are 3 steps which are as follows
• In the first step, we have to find out Normalized values, and also in this, we have 2
options “Larger the better” and “Smaller the better”. The formula of both the option
is given below.
Options Larger the Better Smaller the Better
Formulas 𝐍𝐢𝐣 =
𝐎𝐢𝐣
𝐢=𝟏
𝐧𝐬 𝐎𝐢𝐣 𝐍𝐢𝐣 =
𝟏
𝐎𝐢𝐣
𝟏
𝐢=𝟏
𝐧𝐬 𝐎𝐢𝐣
• After getting the normalized value we need to transform it to the weighted response
by multiplication of objective data and normalized data as given in the formula
𝐴𝑖𝑗 = 𝑁𝑖𝑗 * 𝑂𝑖𝑗
8. M-, Manufacturing division,
Mechanical Dept, SRMIST, KTR
Data Envelopment Analysis based
Ranking (DEAR) Method
8
• In the third step, we need to find out the sum of the objective weighted response,
since we have only one output to maximize that is MRR so 𝐴𝑚𝑎𝑥 = 𝐴𝑀𝑅𝑅 and two
output to minimize and that is Ra, Fz so 𝐴𝑚𝑖𝑛 = 𝐴𝑅𝑎 + 𝐴𝐹𝑧.
Calculations for DEAR method
Normalization
Ex No. 1
Step 1
For Surface Roughness Smaller the better formula is used to find out Normalized value
𝑁𝑅𝑎1 =
1
𝑂𝑖𝑗
1
𝑖=1
𝑛𝑠 𝑂𝑖𝑗
=
1
3.2886
1
108.889
= 33.11
Where
𝑂𝑖𝑗 = Objective Matrix
𝑁𝑖𝑗 = Normalized value of 𝑂𝑖𝑗
9. M-, Manufacturing division,
Mechanical Dept, SRMIST, KTR
Data Envelopment Analysis based
Ranking (DEAR) Method
9
For Thrust Force Fz Smaller the better formula is used to find out Normalized value
𝑁𝐹𝑧1 =
1
𝑂𝑖𝑗
1
𝑖=1
𝑛𝑠 𝑂𝑖𝑗
=
1
667.4
1
10367.7
= 15.53446
For Material Removal Rate (MRR) Larger the better formula is used to find out Normalized
value
𝑁𝑀𝑅𝑅1 =
𝑂𝑖𝑗
𝑖=1
𝑛𝑠
𝑂𝑖𝑗
=
162.49
4190.873
= 0.038772
12. M-, Manufacturing division,
Mechanical Dept, SRMIST, KTR
Data Envelopment Analysis based
Ranking (DEAR) Method
12
Step 3
After this we have To determine the ratio between the sum of maximum objective
weighted responses to sum of minimum objective responses which is also known as
Multiple Response Performance Index (MRPI).
In this step we need to find out Amax and Amin.
From 3 outputs we have to maximize MRR and Minimize Ra and Fz, So values are
𝐴𝑚𝑎𝑥 = 𝐴𝑀𝑅𝑅 and 𝐴𝑚𝑖𝑛 = 𝐴𝑅𝑎 + 𝐴𝐹𝑧.
𝐴𝑚𝑎𝑥1 = 𝐴𝑀𝑅𝑅1 = 6.30
𝐴𝑚𝑖𝑛1 = 𝐴𝑅𝑎1 + 𝐴𝐹𝑧1 = 108.889 + 10367.7 = 10476.59
MRPI =
𝐴𝑚𝑎𝑥
𝐴𝑚𝑖𝑛
14. M-, Manufacturing division,
Mechanical Dept, SRMIST, KTR
Results
14
Control Parameter Results Rank
Tool Point Angle 135
Spindle Speed 3500 1
Feed Rate 350
Pecking Depth 1.5
Optimized combination of parameters
Response Table for MRPI
With the help of the ranking system, we get our
optimum combination of parameters with the
DEAR method
The Response table for MRPI is also shown in
side table which shows that the Pecking depth
is most affecting the Hole quality and Surface
roughness.
Input Para level
1
level
2
level
3
Delta Rank
Spindle
Speed
0.001
269
0.001
391
0.001
287
0.000
122
3
Feed Rate 0.000
618
0.001
307
0.002
023
0.000
141
2
Pecking
Depth
0.001
247
0.001
292
0.001
409
0.000
162
1