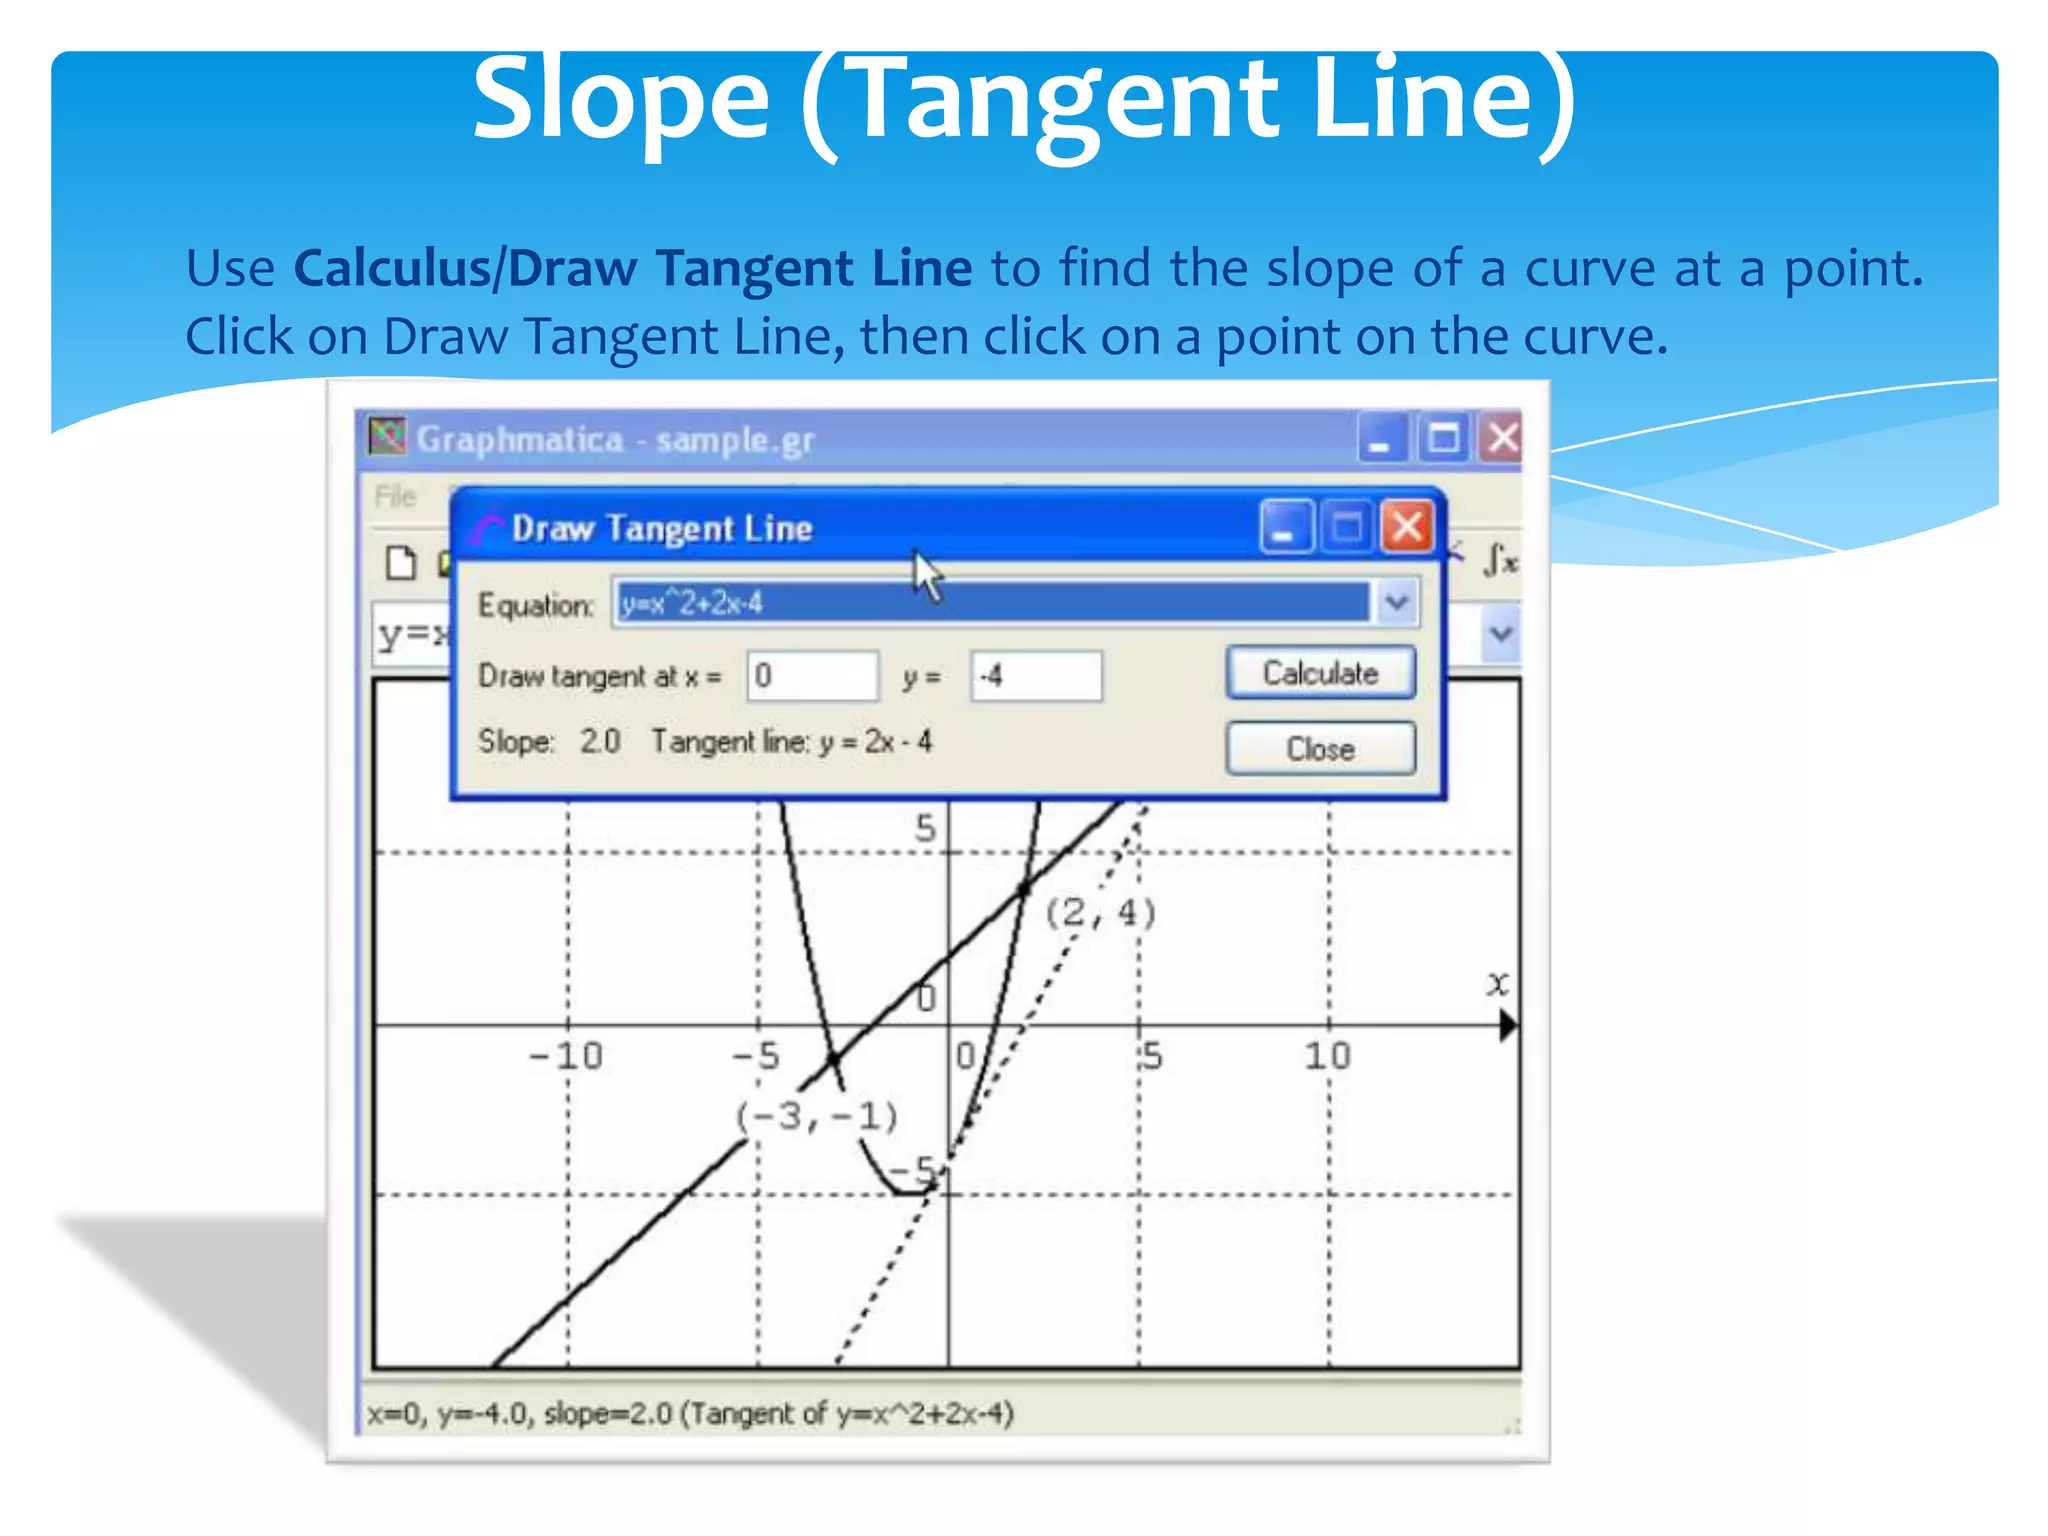
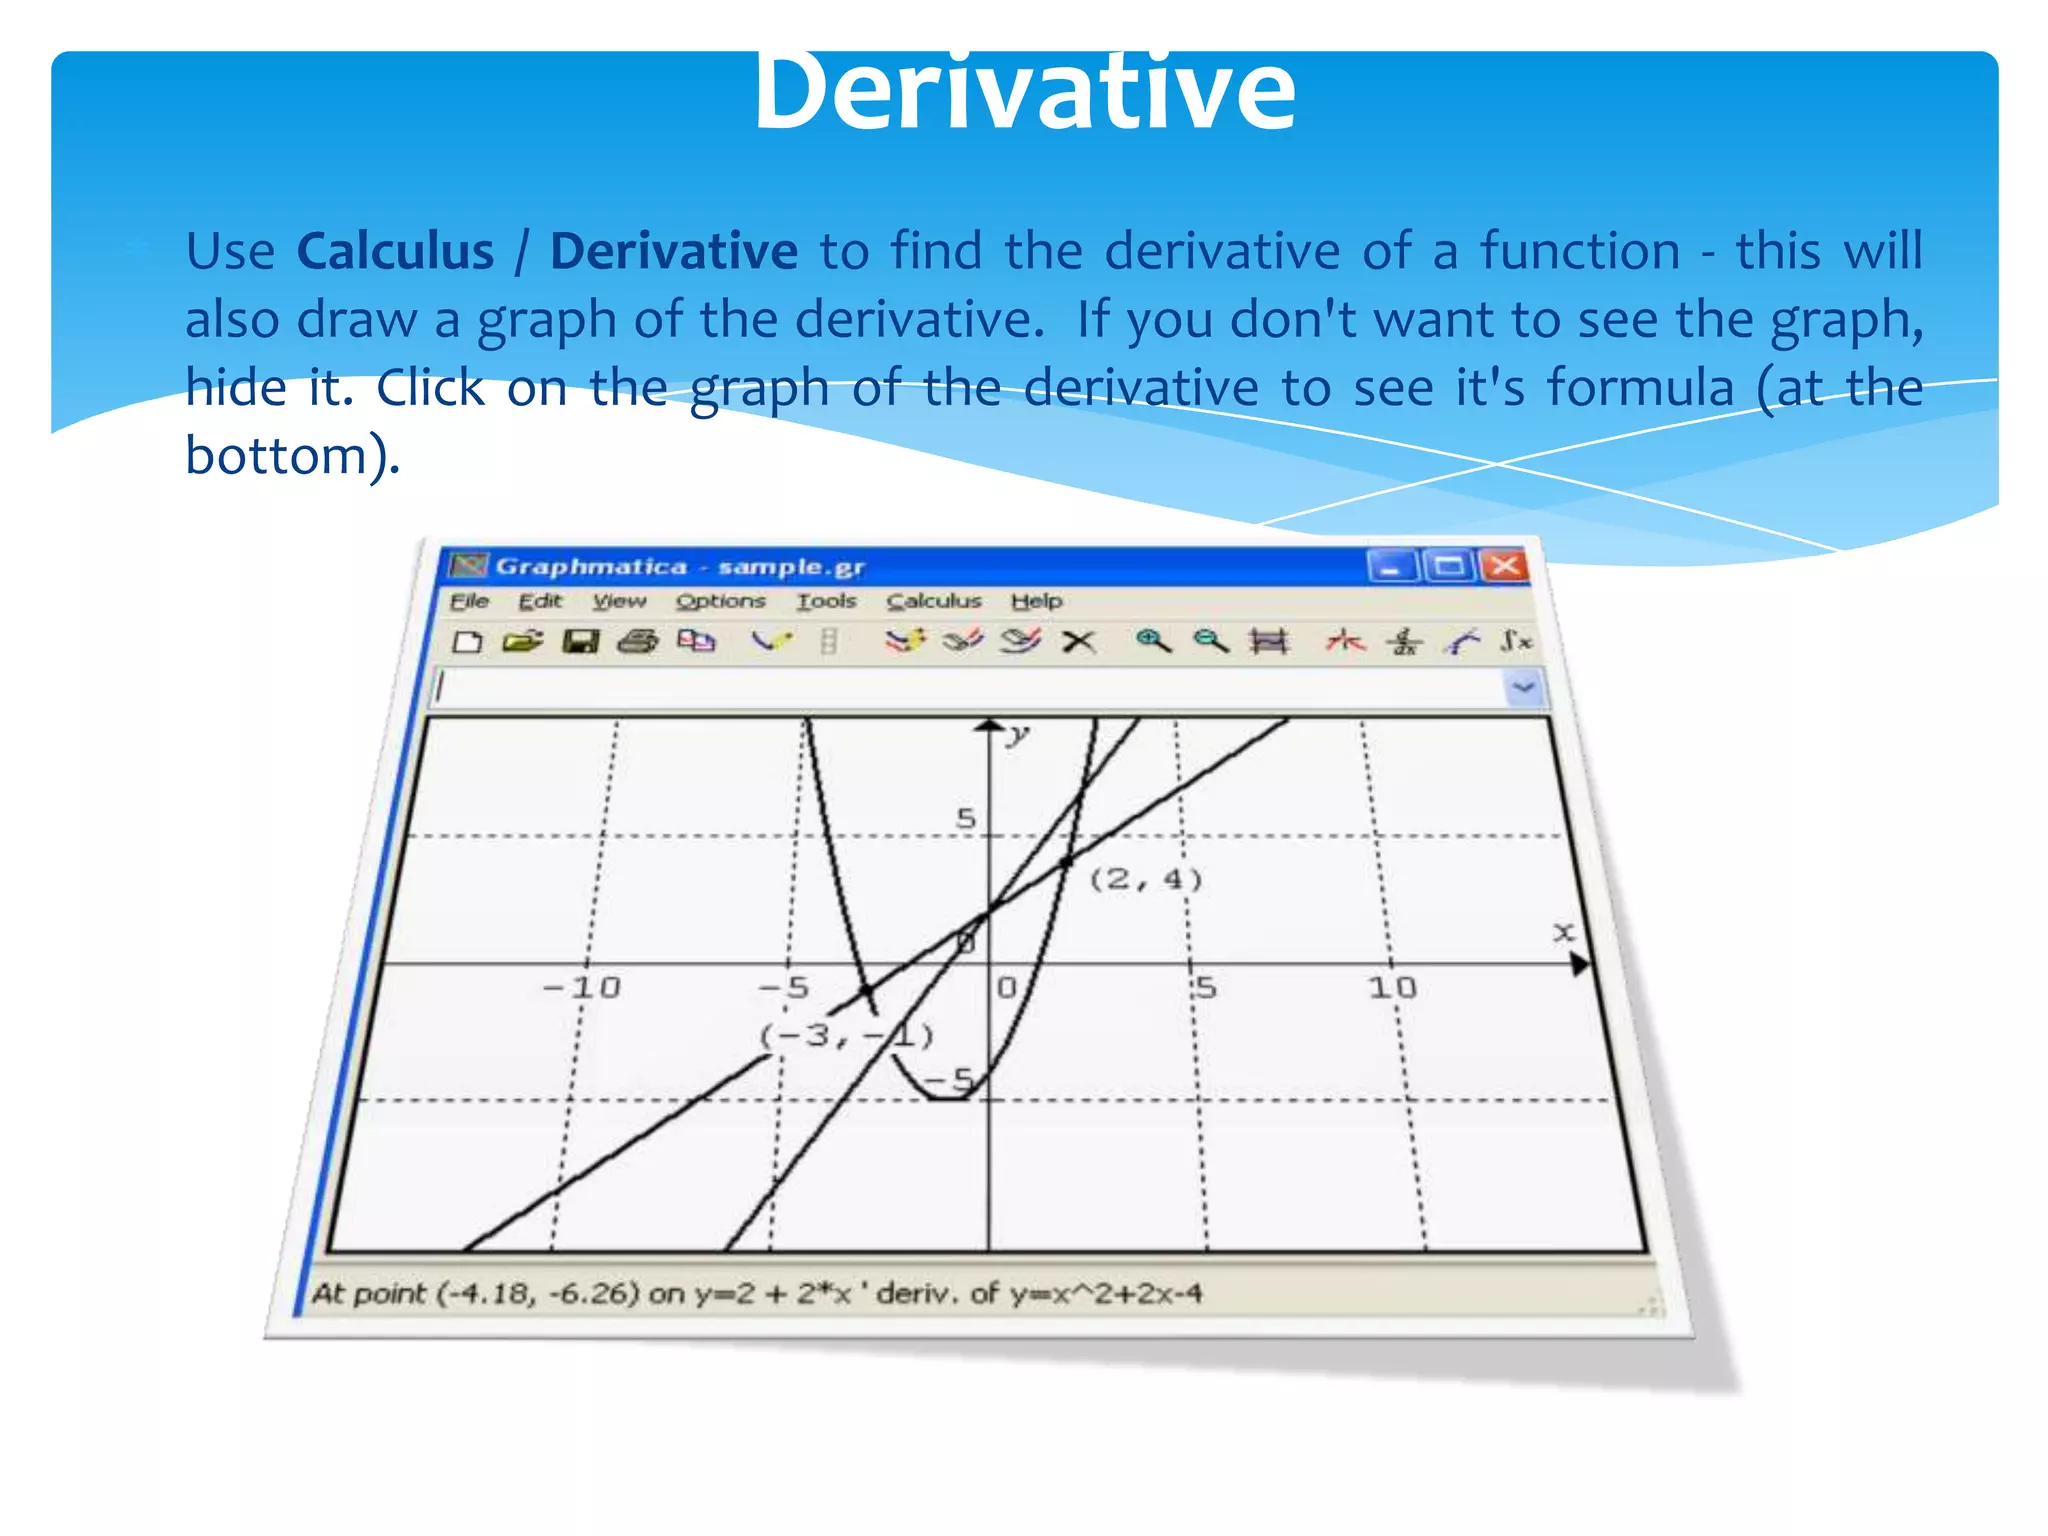
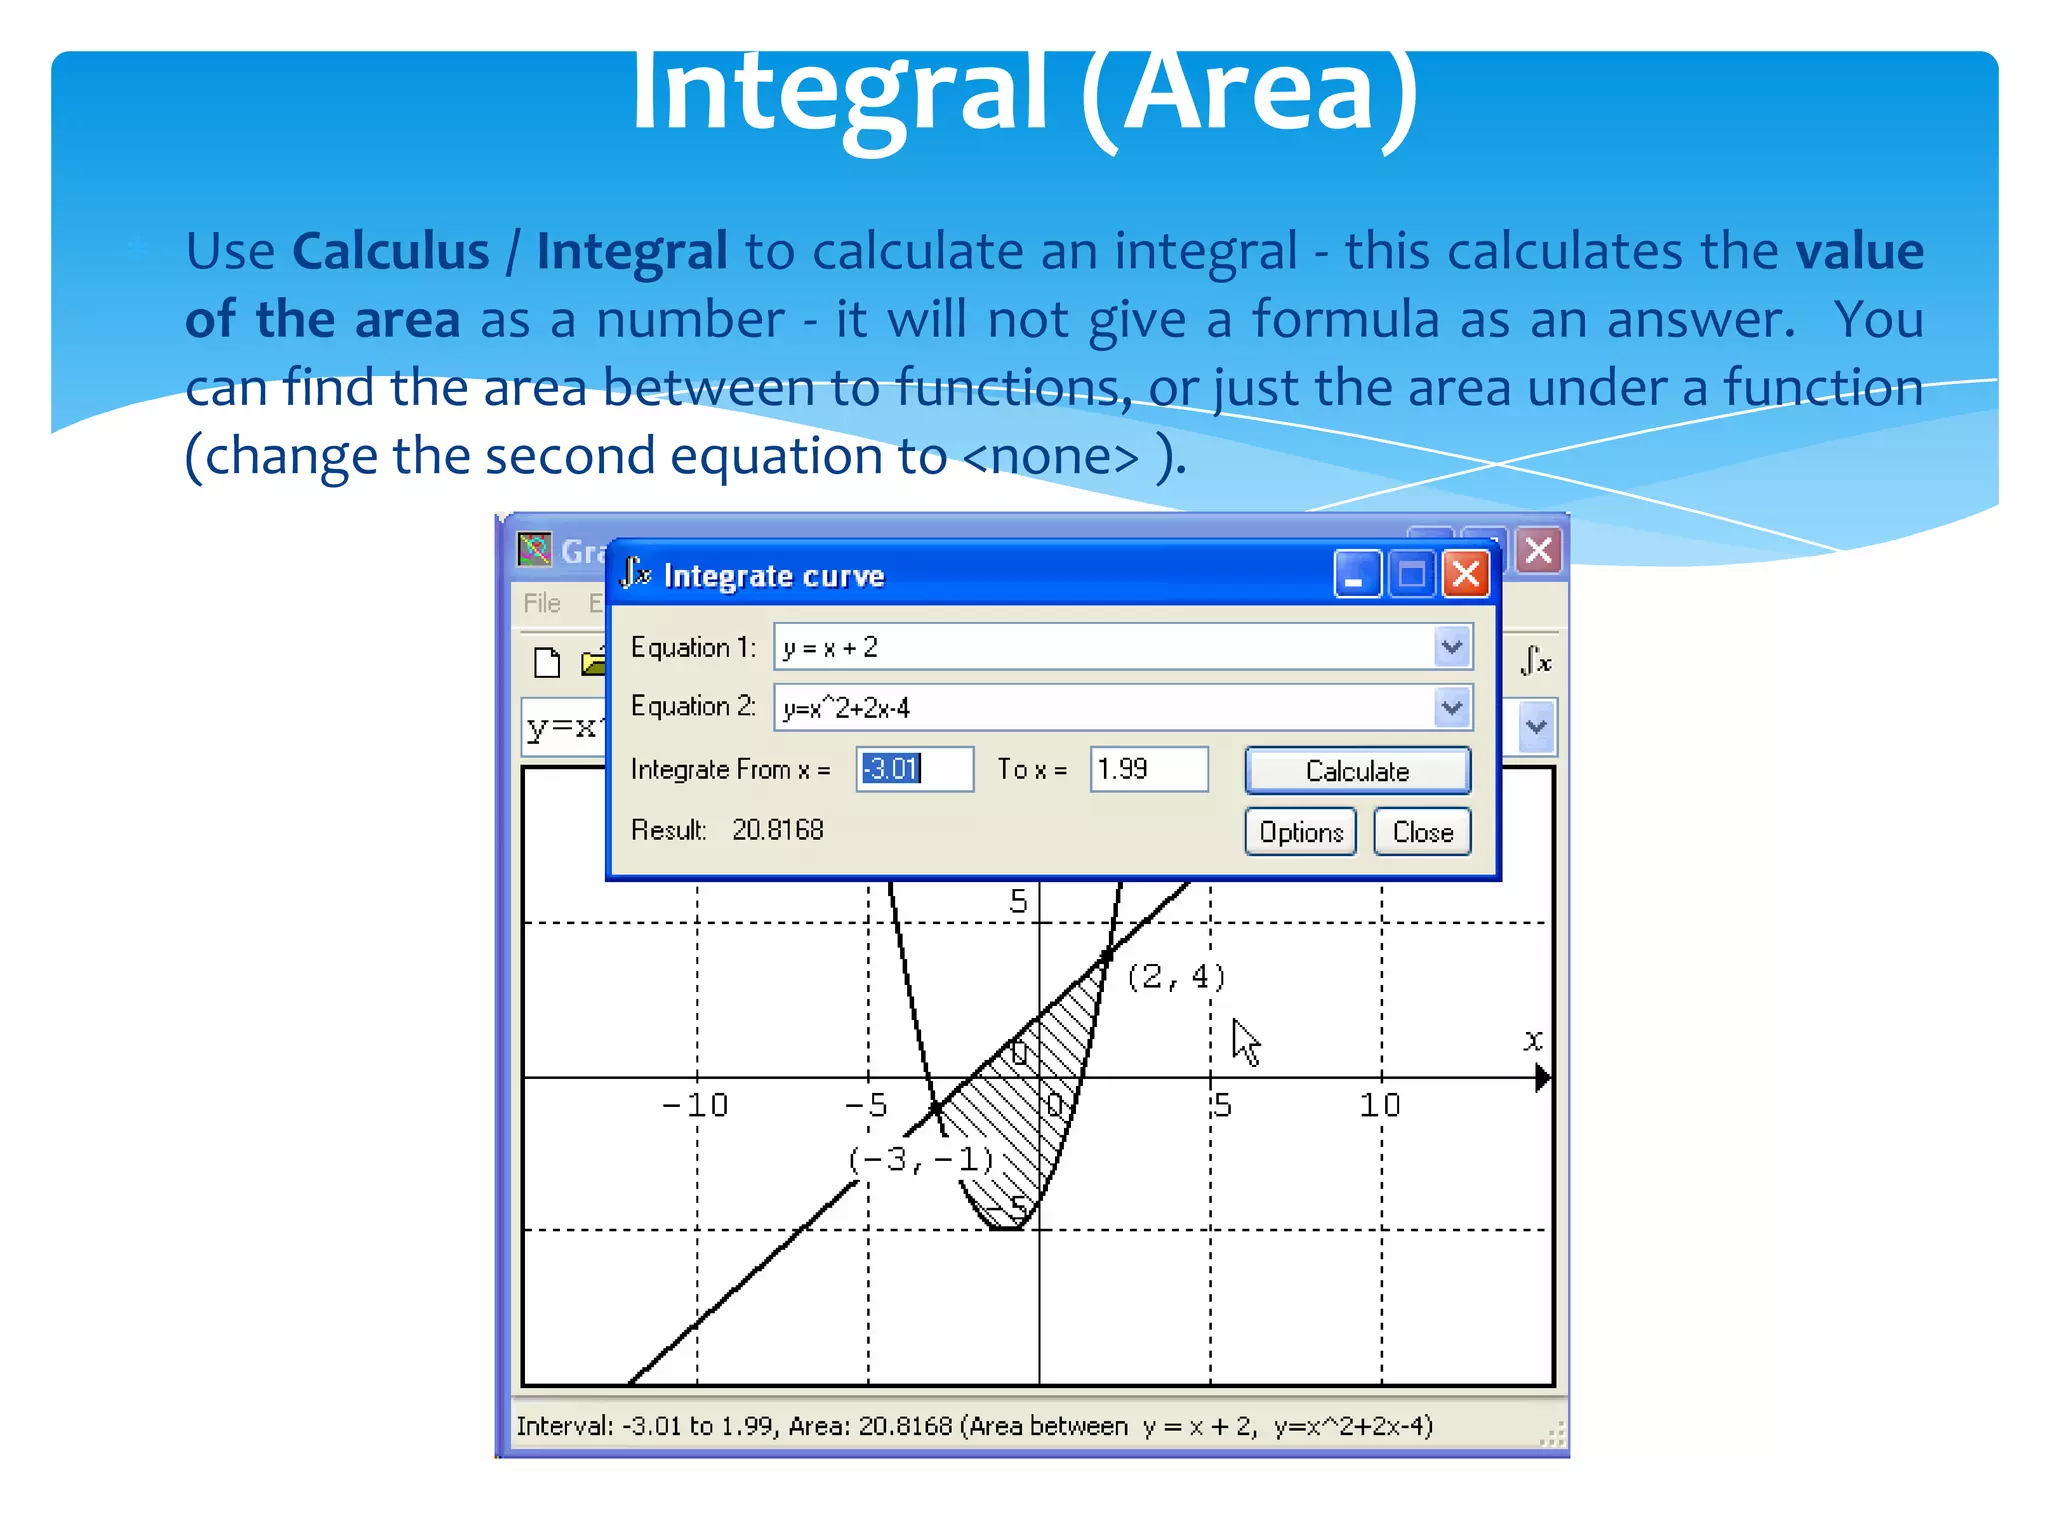
GRAPHMATICA
A Quick Start
By
Muhammad Muddassir
Khan
Muhammad Muddassir Khan
MBA (MIS) – Institute Of Business Management
MCS (SE) – SZABIST
M.Phil (In progress with Karachi University)
PMP – Shall certified by end of this year
Primavera Trainer
12 year as “Free lance IT Trainer” / The Facilitator
Aisha Bawany Academy as “HOD – Computers & Mathematics”
Trainer Profile
Graphmatica draws mathematical graphs like,
y = x2 - 6x + 5
A powerful, easy-to-use, equation plotter with numerical and calculus features:
Graph Cartesian functions, relations, and inequalities, plus polar, parametric, and ordinary
differential equations.
Up to 25 graphs on screen at once.
New data plotting and curve-fitting features.
Numerically solve and graphically display tangent lines and integrals.
Find critical points, solutions to equations, and intersections between Cartesian functions.
Print your graphs or copy to clipboard in black-and-white or color.
About Graphmatica
When you start Graphmatica the first time, you might not
like the layout - funny colors, small numbers
Starting
Change the numbers (scale) with View/Grid Range
Change Scale
Choose better colors with Options/Graph Paper/
Colors (choose White):
Better Colors
Now you will have white paper with colored lines, and you can
draw your first graph.
In the formula-box, type : y = x^2 + 2x - 4
(The ^ symbol stands for power, so x^2 means x2 .
Draw First Graph
To add another graph, type the formula in the formula box
and press [Enter].
Draw Another Graph
Find the coordinates of the point of intersection by moving
the cursor to that point (trace the graph), and then read the
coordinates at the bottom of the screen.
Tracing Coordinates
There are two ways to zoom in and out :
- View/Grid Range - change the grid-range by typing limits for x and y
- Mark and Zoom - hi-light an area then click the zoom button. Use
the Default Grid button to return to the normal view.
Zoom
Use Tools/Find Intersection to automatically find the points of intersection.
This gives better results than tracing, as tracing only finds approximate
coordinates - e.g. 1.995 instead of 2.0 .
Automatically Find Intersection
You can mark points on the graph - for example, the points of
intersection, by using View/Data Plot Editor. Type the coordinates of
the points you want to mark with dots.
Marking Points
This will squash your graph to
make room for the data table.
After typing the points, you
can hide the data-table again
but the dots will stay.
You can label points or add other annotations (notes) to your graph.
Use Edit/Annotations. If you want to move the annotation later, double-
click on it, click the [Place] button, then click on the graph to place that
annotation.
Adding Labels (annotations)
Use Edit/Copy (BMP) to copy your graph. Then you can paste it into a
document. Copy using EMF might work better for some word-
processors, but BMP probably works for most normal applications.
Copying the Picture
Before copying, you might want to resize the Graphmatica window, as
resizing in a word-processor might make the picture ugly.
Use File/Save or Save as to save your graphs. You might also
want to use File/Save Setup Info to save your color and size
settings, so these will stay the same for new graphs.
Be aware that this doesn't actually save your picture, but
rather saves all the formulae you wrote. If you drew lots of
graphs and erased them, they will all appear again when
you open the file next time.
Saving your Work
There are two ways to erase a graph. Right-click on the graph then choose:
- hide - makes the graph disappear, but keeps the formula
- delete - makes the graph disappear and throws away the formula.
Erasing
You must use Graphmatica notation to define functions. Here
is a summary of common symbols. More details available
in Graphmatica Help / Graphing Equations / Operator Table.
Summary of Symbols
Graphmatica contains some
advanced features for
investigating graphs.
Advanced Functions (Calculus)
Click on the curve you want to investigate. Then use Calculus /Find
Critical Points to find the zeroes (roots) of the function. For the
parabola, this also finds the vertex.
Roots (Zeroes)
Use Calculus/Draw Tangent Line to find the slope of a curve at a point.
Click on Draw Tangent Line, then click on a point on the curve.
Slope (Tangent Line)
Use Calculus / Derivative to find the derivative of a function - this will
also draw a graph of the derivative. If you don't want to see the graph,
hide it. Click on the graph of the derivative to see it's formula (at the
bottom).
Derivative
Use Calculus / Integral to calculate an integral - this calculates the value
of the area as a number - it will not give a formula as an answer. You
can find the area between to functions, or just the area under a function
(change the second equation to <none> ).
Integral (Area)
Thank Yu

Graphmatica an overview

  • 1.
  • 2.
    Muhammad Muddassir Khan MBA(MIS) – Institute Of Business Management MCS (SE) – SZABIST M.Phil (In progress with Karachi University) PMP – Shall certified by end of this year Primavera Trainer 12 year as “Free lance IT Trainer” / The Facilitator Aisha Bawany Academy as “HOD – Computers & Mathematics” Trainer Profile
  • 3.
    Graphmatica draws mathematicalgraphs like, y = x2 - 6x + 5 A powerful, easy-to-use, equation plotter with numerical and calculus features: Graph Cartesian functions, relations, and inequalities, plus polar, parametric, and ordinary differential equations. Up to 25 graphs on screen at once. New data plotting and curve-fitting features. Numerically solve and graphically display tangent lines and integrals. Find critical points, solutions to equations, and intersections between Cartesian functions. Print your graphs or copy to clipboard in black-and-white or color. About Graphmatica
  • 4.
    When you startGraphmatica the first time, you might not like the layout - funny colors, small numbers Starting
  • 5.
    Change the numbers(scale) with View/Grid Range Change Scale
  • 6.
    Choose better colorswith Options/Graph Paper/ Colors (choose White): Better Colors
  • 7.
    Now you willhave white paper with colored lines, and you can draw your first graph. In the formula-box, type : y = x^2 + 2x - 4 (The ^ symbol stands for power, so x^2 means x2 . Draw First Graph
  • 8.
    To add anothergraph, type the formula in the formula box and press [Enter]. Draw Another Graph
  • 9.
    Find the coordinatesof the point of intersection by moving the cursor to that point (trace the graph), and then read the coordinates at the bottom of the screen. Tracing Coordinates
  • 10.
    There are twoways to zoom in and out : - View/Grid Range - change the grid-range by typing limits for x and y - Mark and Zoom - hi-light an area then click the zoom button. Use the Default Grid button to return to the normal view. Zoom
  • 11.
    Use Tools/Find Intersectionto automatically find the points of intersection. This gives better results than tracing, as tracing only finds approximate coordinates - e.g. 1.995 instead of 2.0 . Automatically Find Intersection
  • 12.
    You can markpoints on the graph - for example, the points of intersection, by using View/Data Plot Editor. Type the coordinates of the points you want to mark with dots. Marking Points This will squash your graph to make room for the data table. After typing the points, you can hide the data-table again but the dots will stay.
  • 13.
    You can labelpoints or add other annotations (notes) to your graph. Use Edit/Annotations. If you want to move the annotation later, double- click on it, click the [Place] button, then click on the graph to place that annotation. Adding Labels (annotations)
  • 14.
    Use Edit/Copy (BMP)to copy your graph. Then you can paste it into a document. Copy using EMF might work better for some word- processors, but BMP probably works for most normal applications. Copying the Picture
  • 15.
    Before copying, youmight want to resize the Graphmatica window, as resizing in a word-processor might make the picture ugly.
  • 16.
    Use File/Save orSave as to save your graphs. You might also want to use File/Save Setup Info to save your color and size settings, so these will stay the same for new graphs. Be aware that this doesn't actually save your picture, but rather saves all the formulae you wrote. If you drew lots of graphs and erased them, they will all appear again when you open the file next time. Saving your Work
  • 17.
    There are twoways to erase a graph. Right-click on the graph then choose: - hide - makes the graph disappear, but keeps the formula - delete - makes the graph disappear and throws away the formula. Erasing
  • 18.
    You must useGraphmatica notation to define functions. Here is a summary of common symbols. More details available in Graphmatica Help / Graphing Equations / Operator Table. Summary of Symbols
  • 20.
    Graphmatica contains some advancedfeatures for investigating graphs. Advanced Functions (Calculus)
  • 21.
    Click on thecurve you want to investigate. Then use Calculus /Find Critical Points to find the zeroes (roots) of the function. For the parabola, this also finds the vertex. Roots (Zeroes)
  • 22.
    Use Calculus/Draw TangentLine to find the slope of a curve at a point. Click on Draw Tangent Line, then click on a point on the curve. Slope (Tangent Line)
  • 23.
    Use Calculus /Derivative to find the derivative of a function - this will also draw a graph of the derivative. If you don't want to see the graph, hide it. Click on the graph of the derivative to see it's formula (at the bottom). Derivative
  • 24.
    Use Calculus /Integral to calculate an integral - this calculates the value of the area as a number - it will not give a formula as an answer. You can find the area between to functions, or just the area under a function (change the second equation to <none> ). Integral (Area)
  • 25.