Graficos 1 im
•
0 likes•260 views

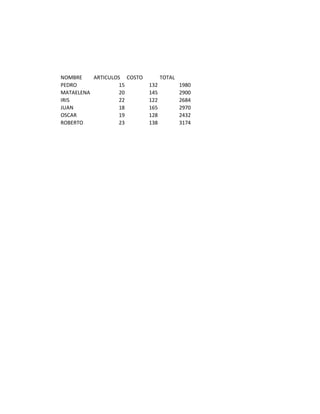
A table lists 6 people's names, number of articles purchased, cost per article, and total cost. A bar graph shows two data series, likely the number of articles and total cost for the 6 people, with values ranging from 0 to 200 for each series. The document appears to be a sales report including tabular data and a bar graph.

Recommended
More Related Content
Viewers also liked
More from KateRamos5
More from KateRamos5 (20)
Recently uploaded
Recently uploaded (20)
Graficos 1 im
- 1. NOMBRE ARTICULOS COSTO TOTAL PEDRO 15 132 1980 MATAELENA 20 145 2900 IRIS 22 122 2684 JUAN 18 165 2970 OSCAR 19 128 2432 ROBERTO 23 138 3174
- 2. Graficos Jimenez Ramos Kate Yakira Cano Torres Jesus Josue juarez martinez leslie yahaira 13/Otc/15 Series1 Series2 0 50 100 150 200 Series1 Series2