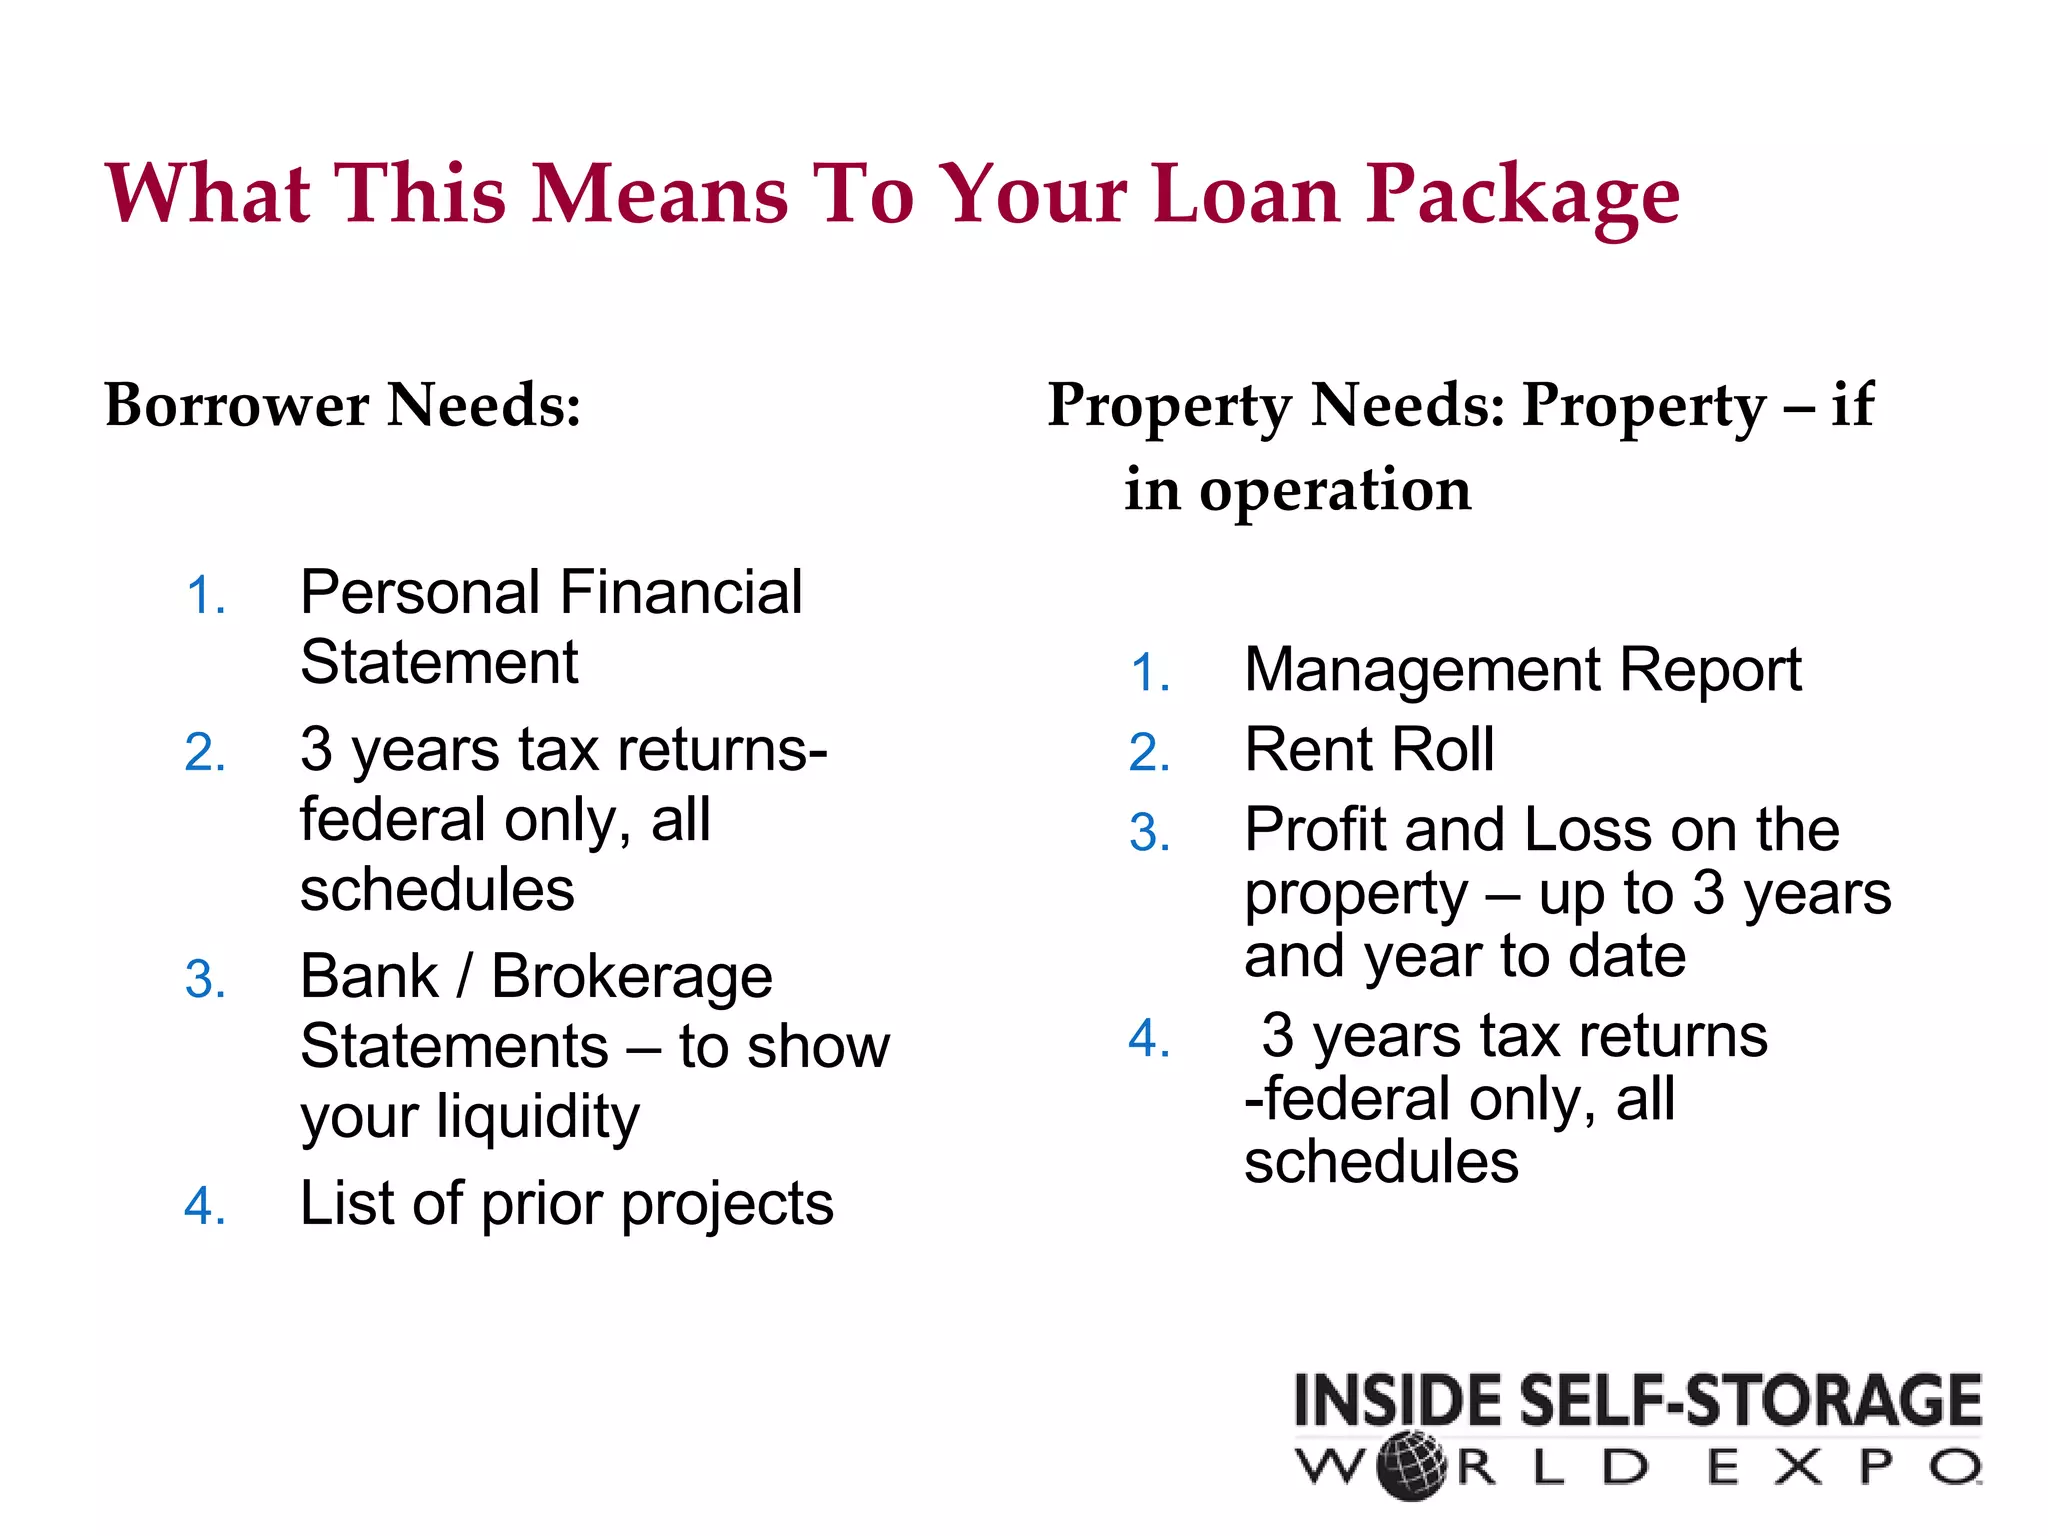
This document summarizes the current state of the commercial real estate lending market and provides tips for assembling a successful loan package. Key points include:
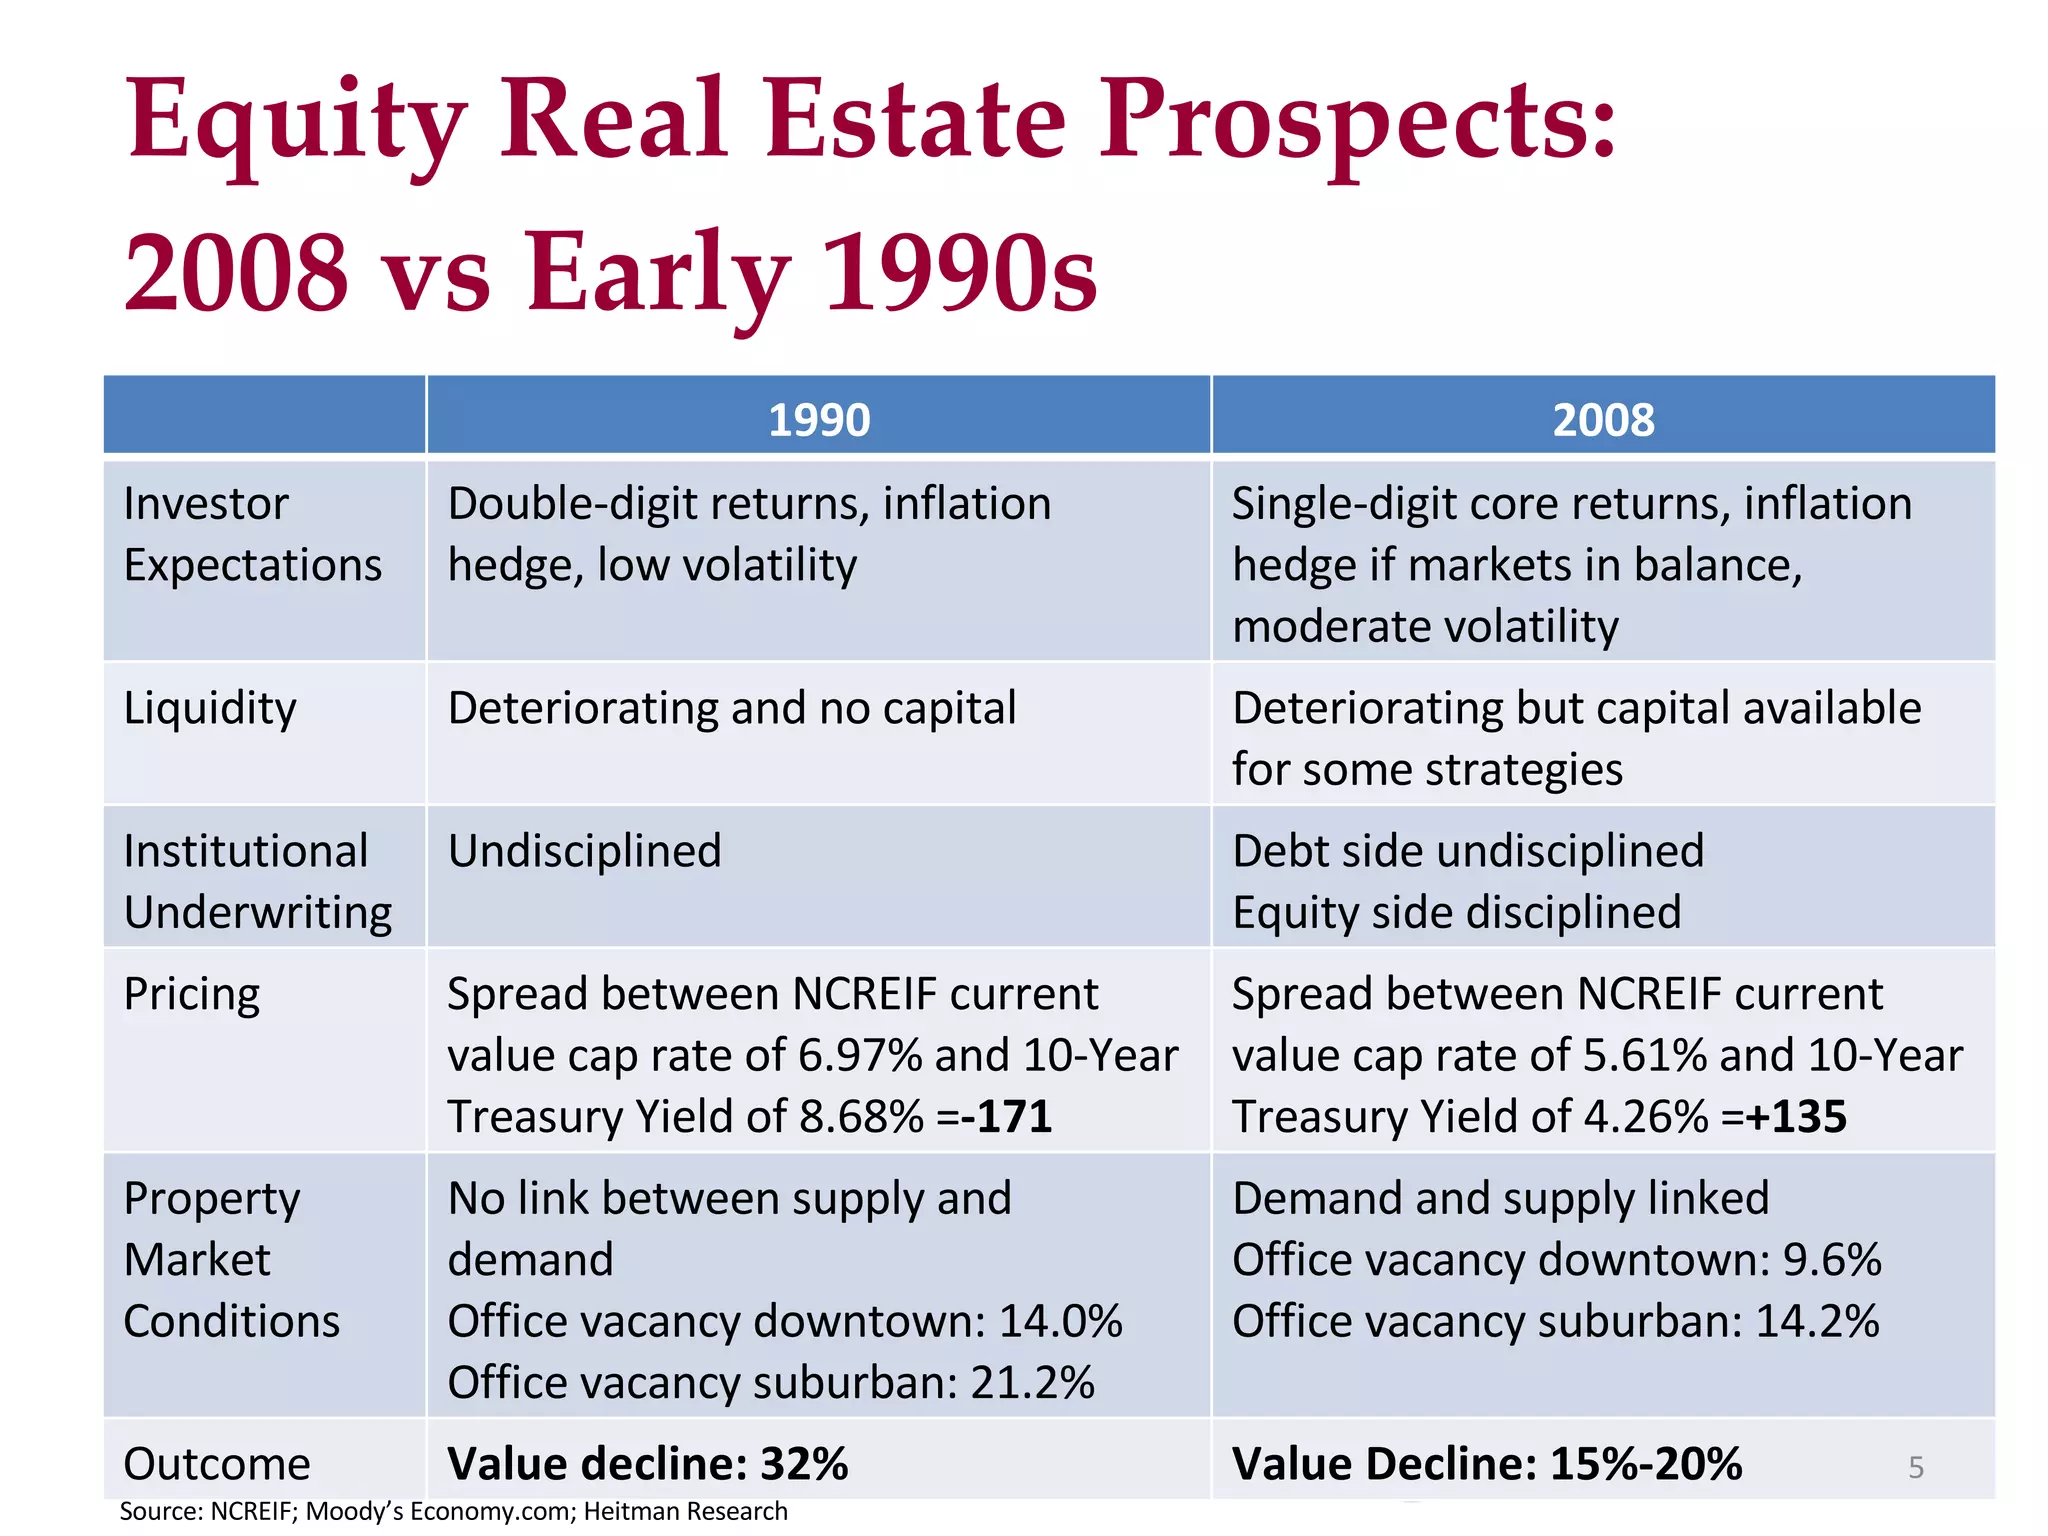
- Lenders are taking a more conservative and disciplined approach to underwriting with tighter standards for borrower experience, cash reserves, and property financials.
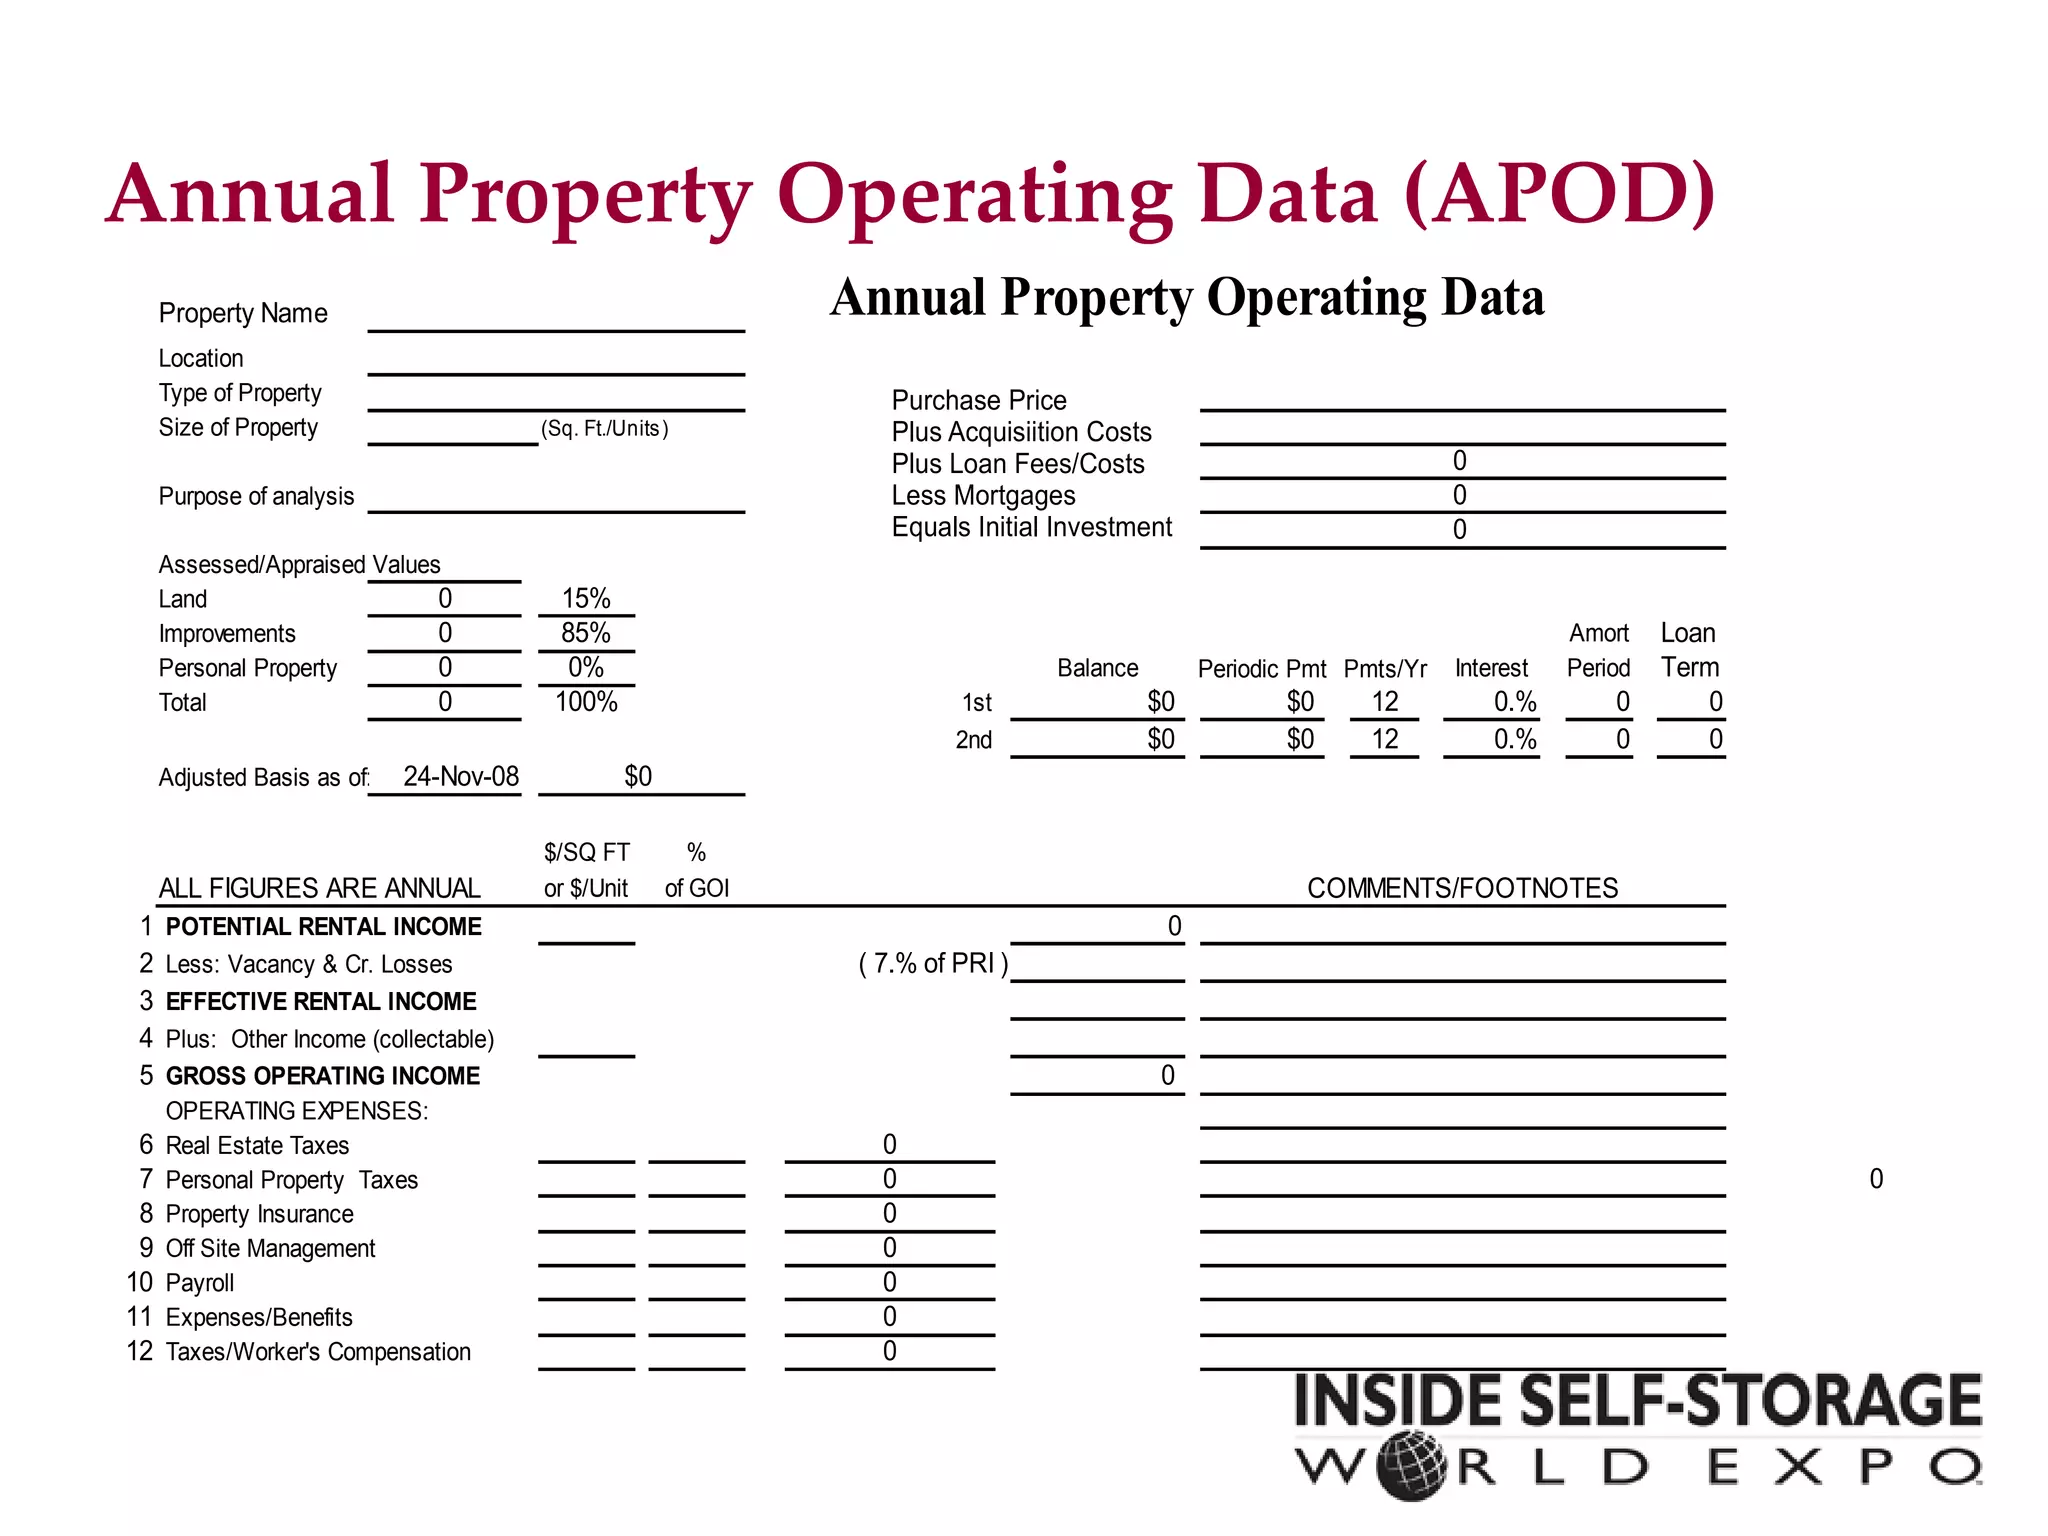
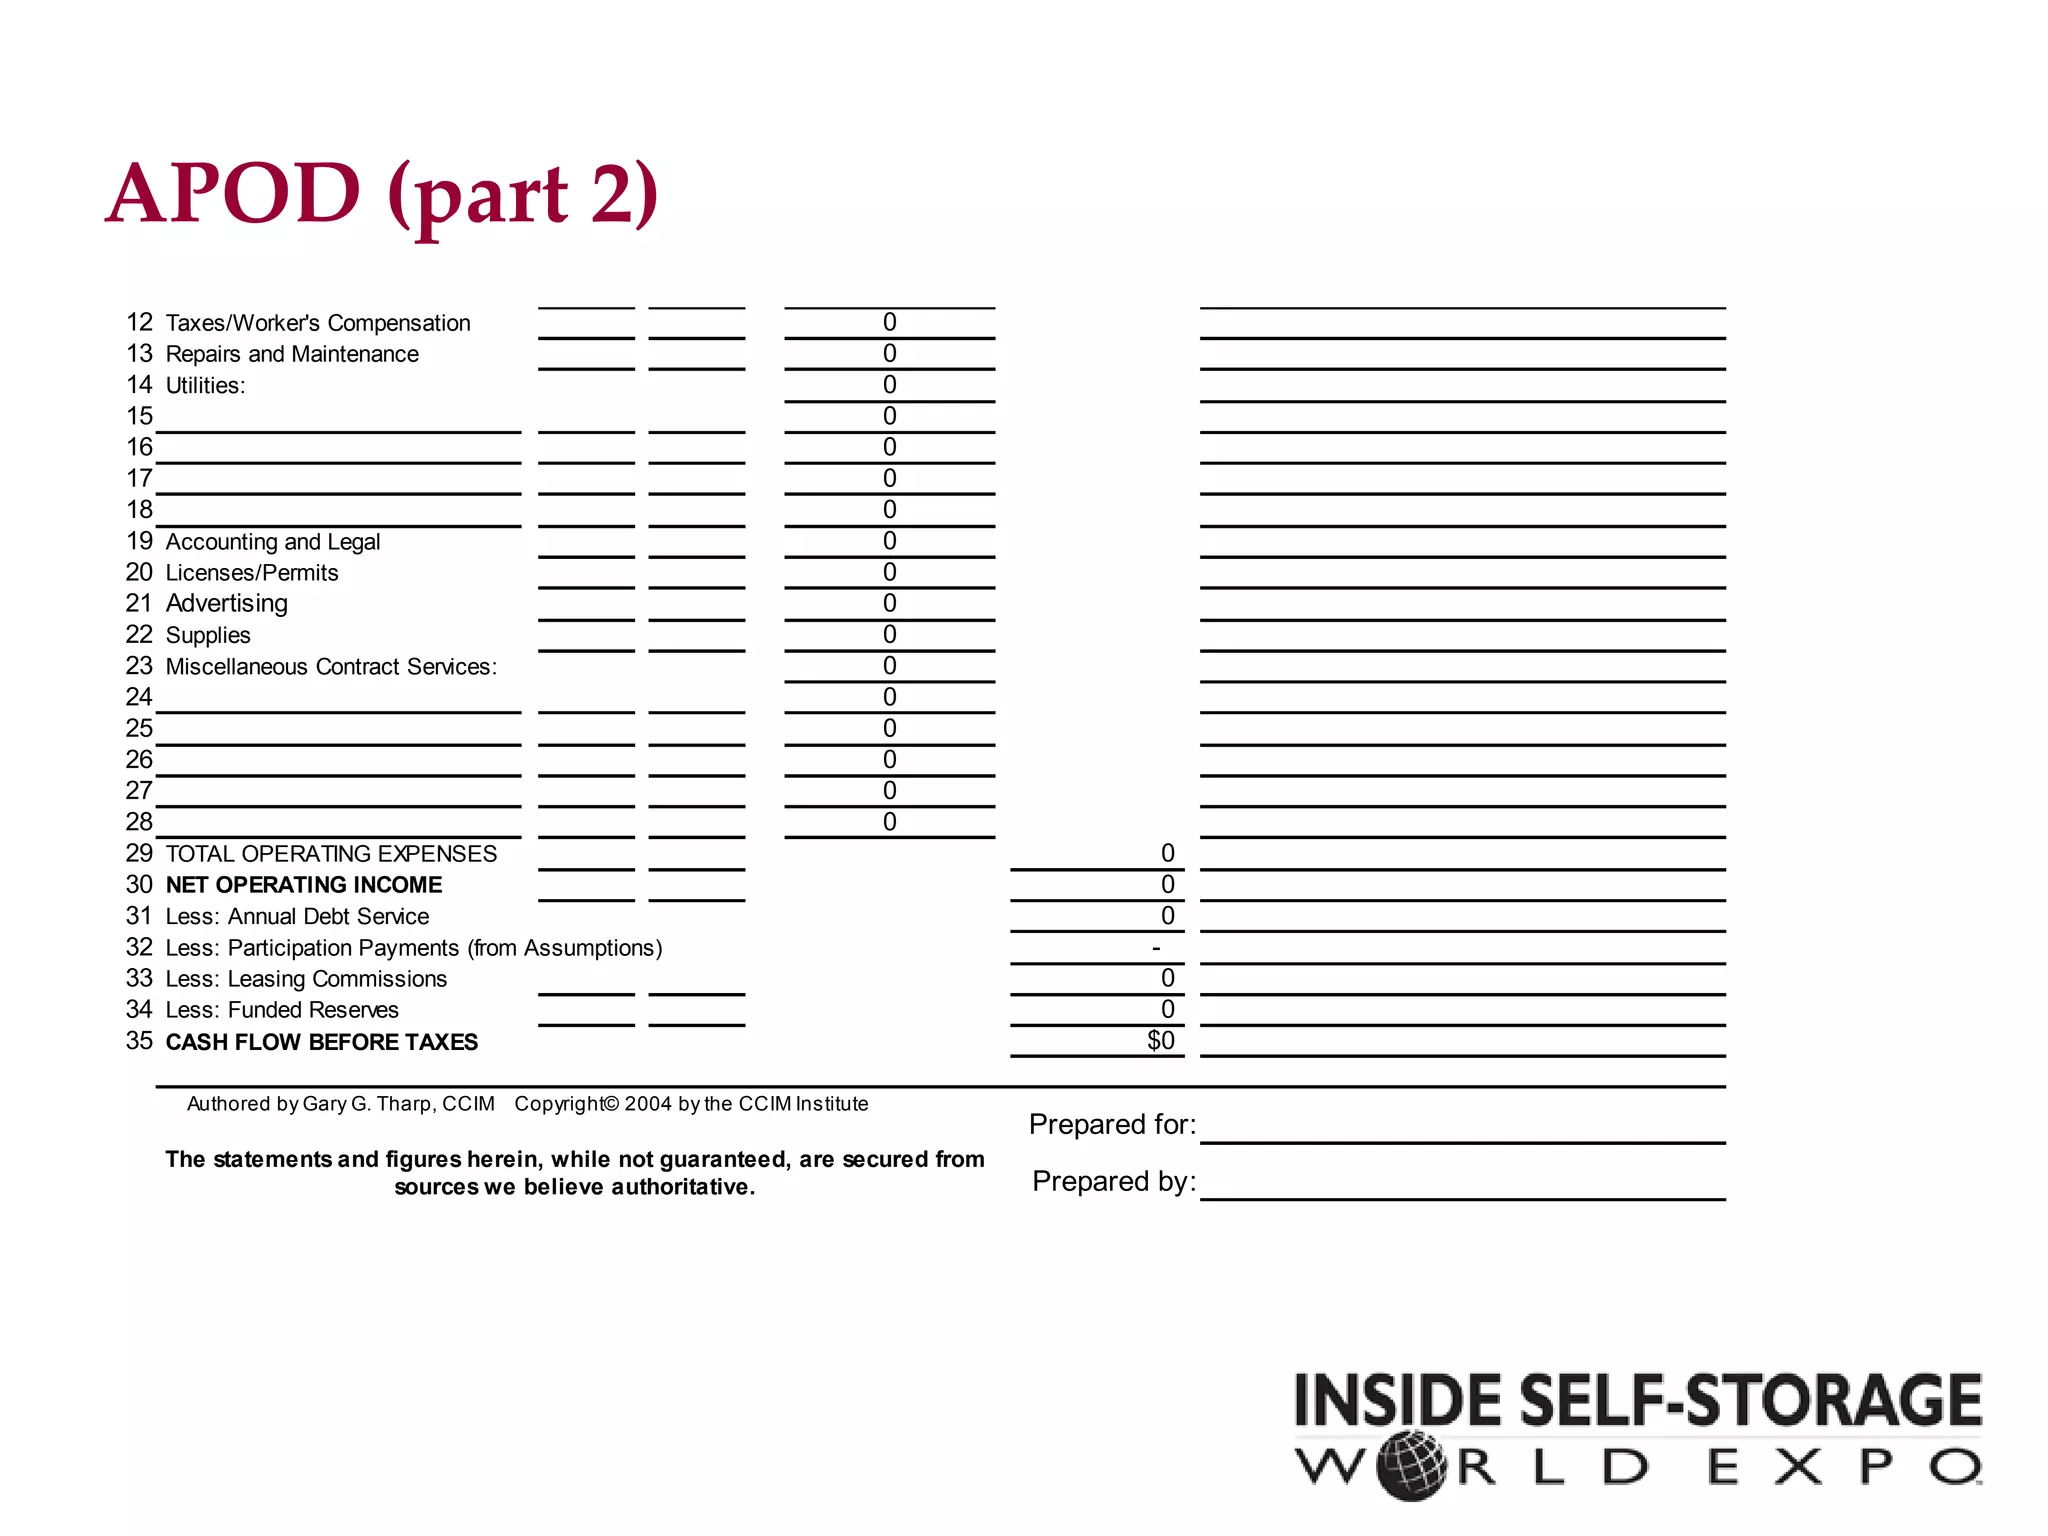
- It is important to provide accurate and up-to-date property operating data and financial projections, and be prepared to justify assumptions to skeptical lenders.
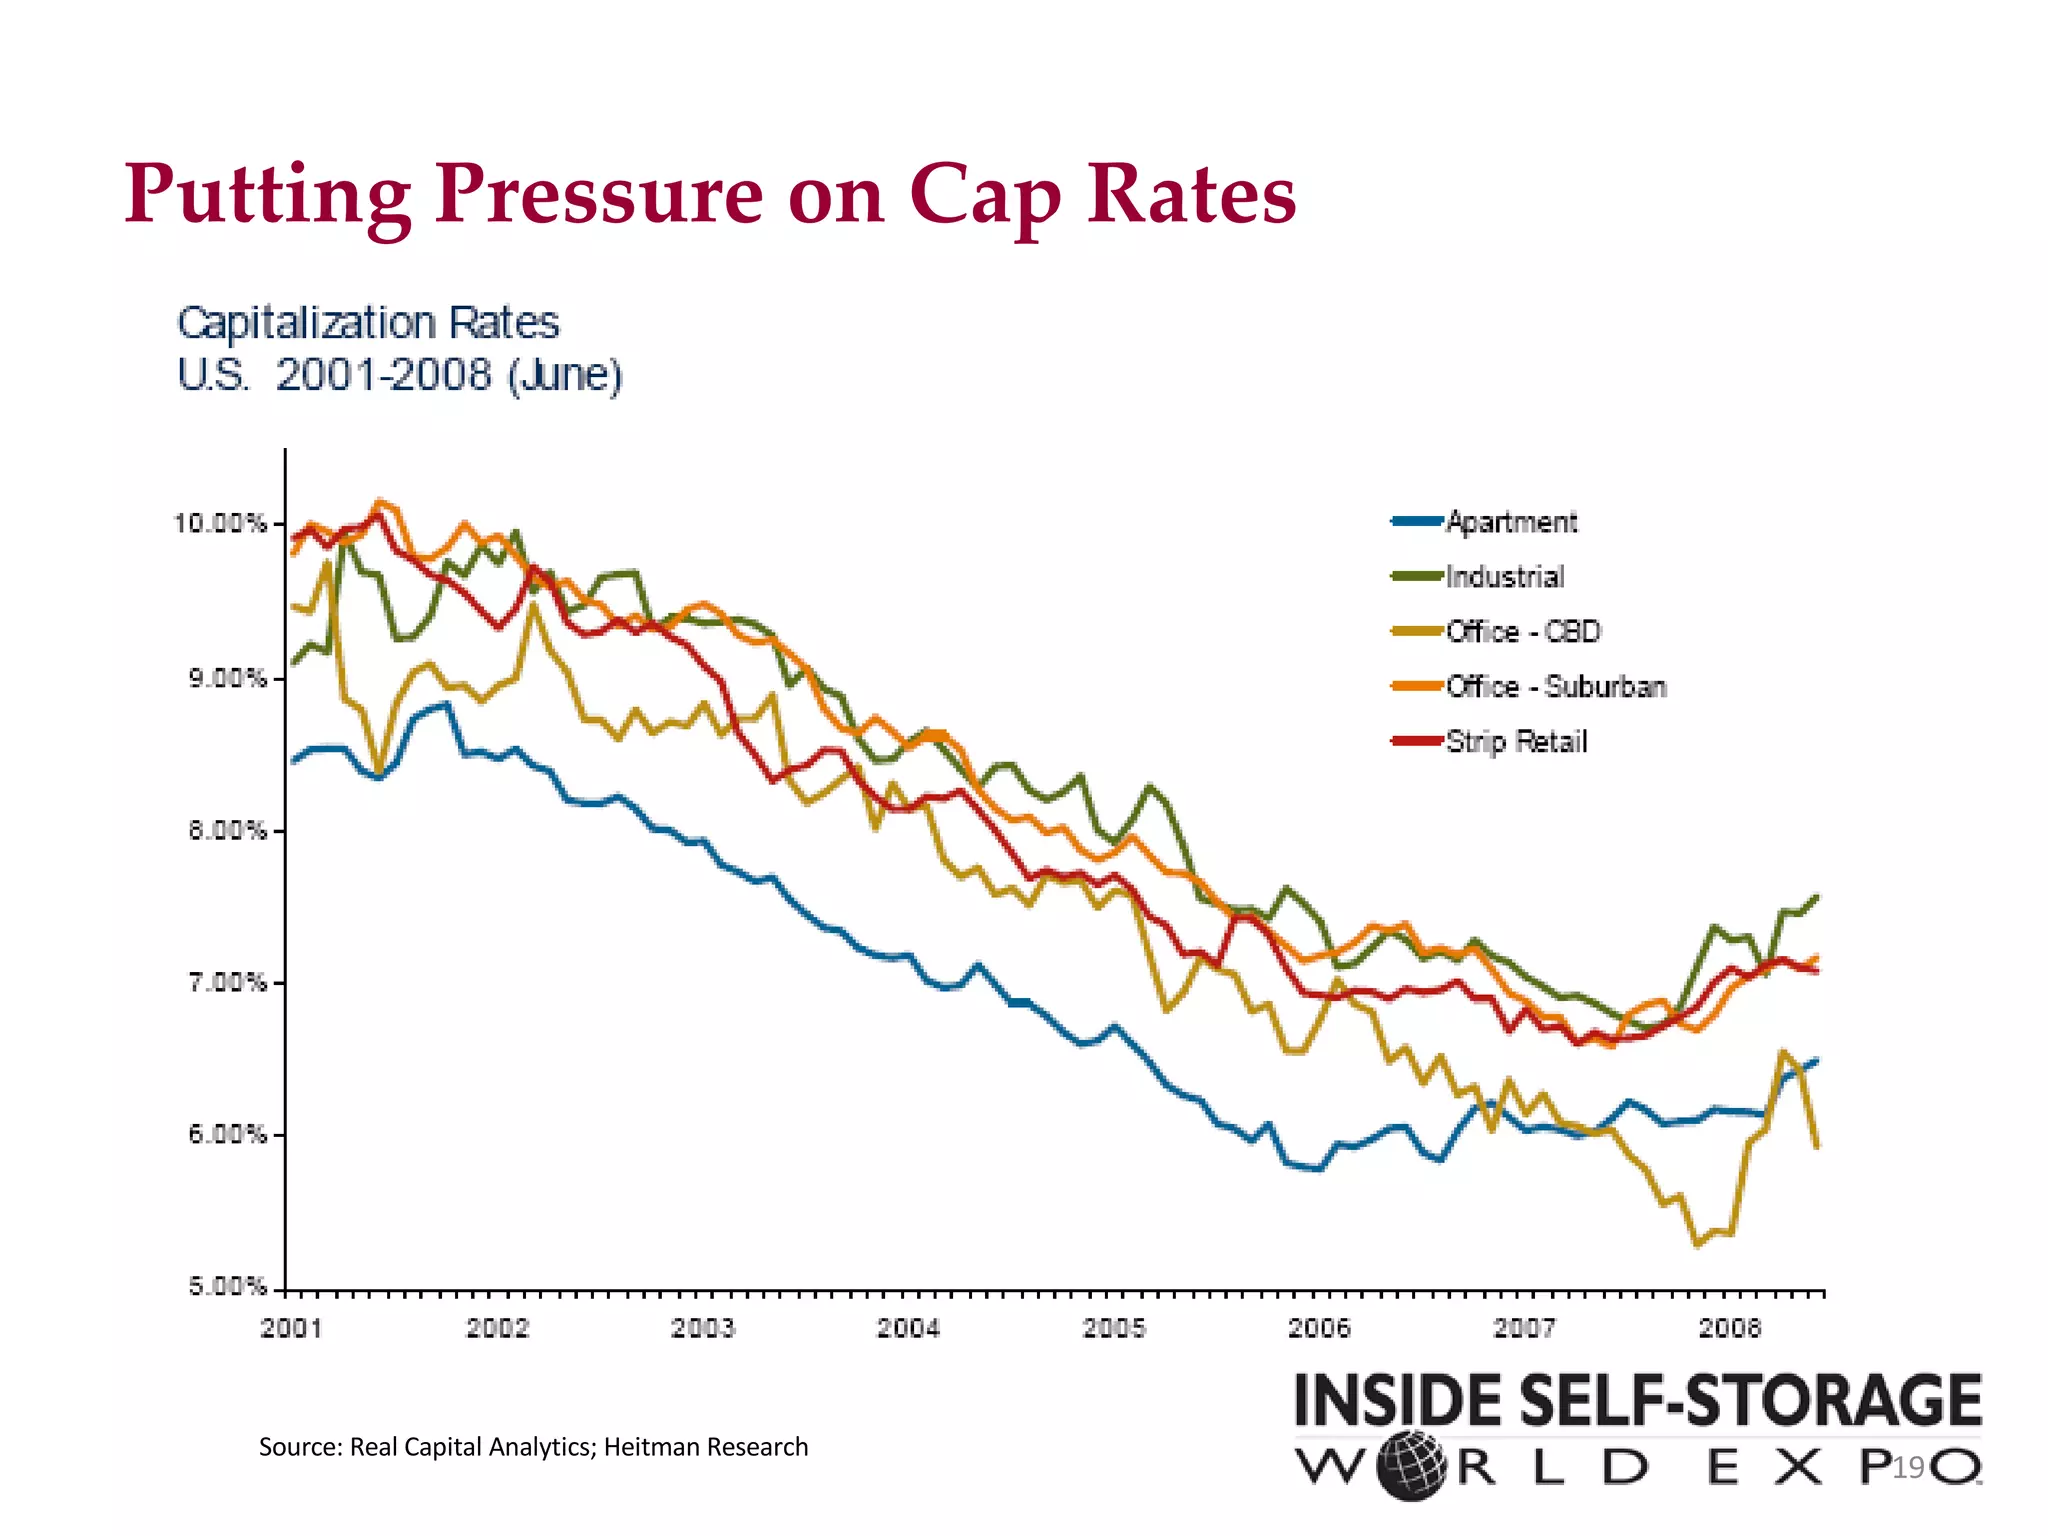
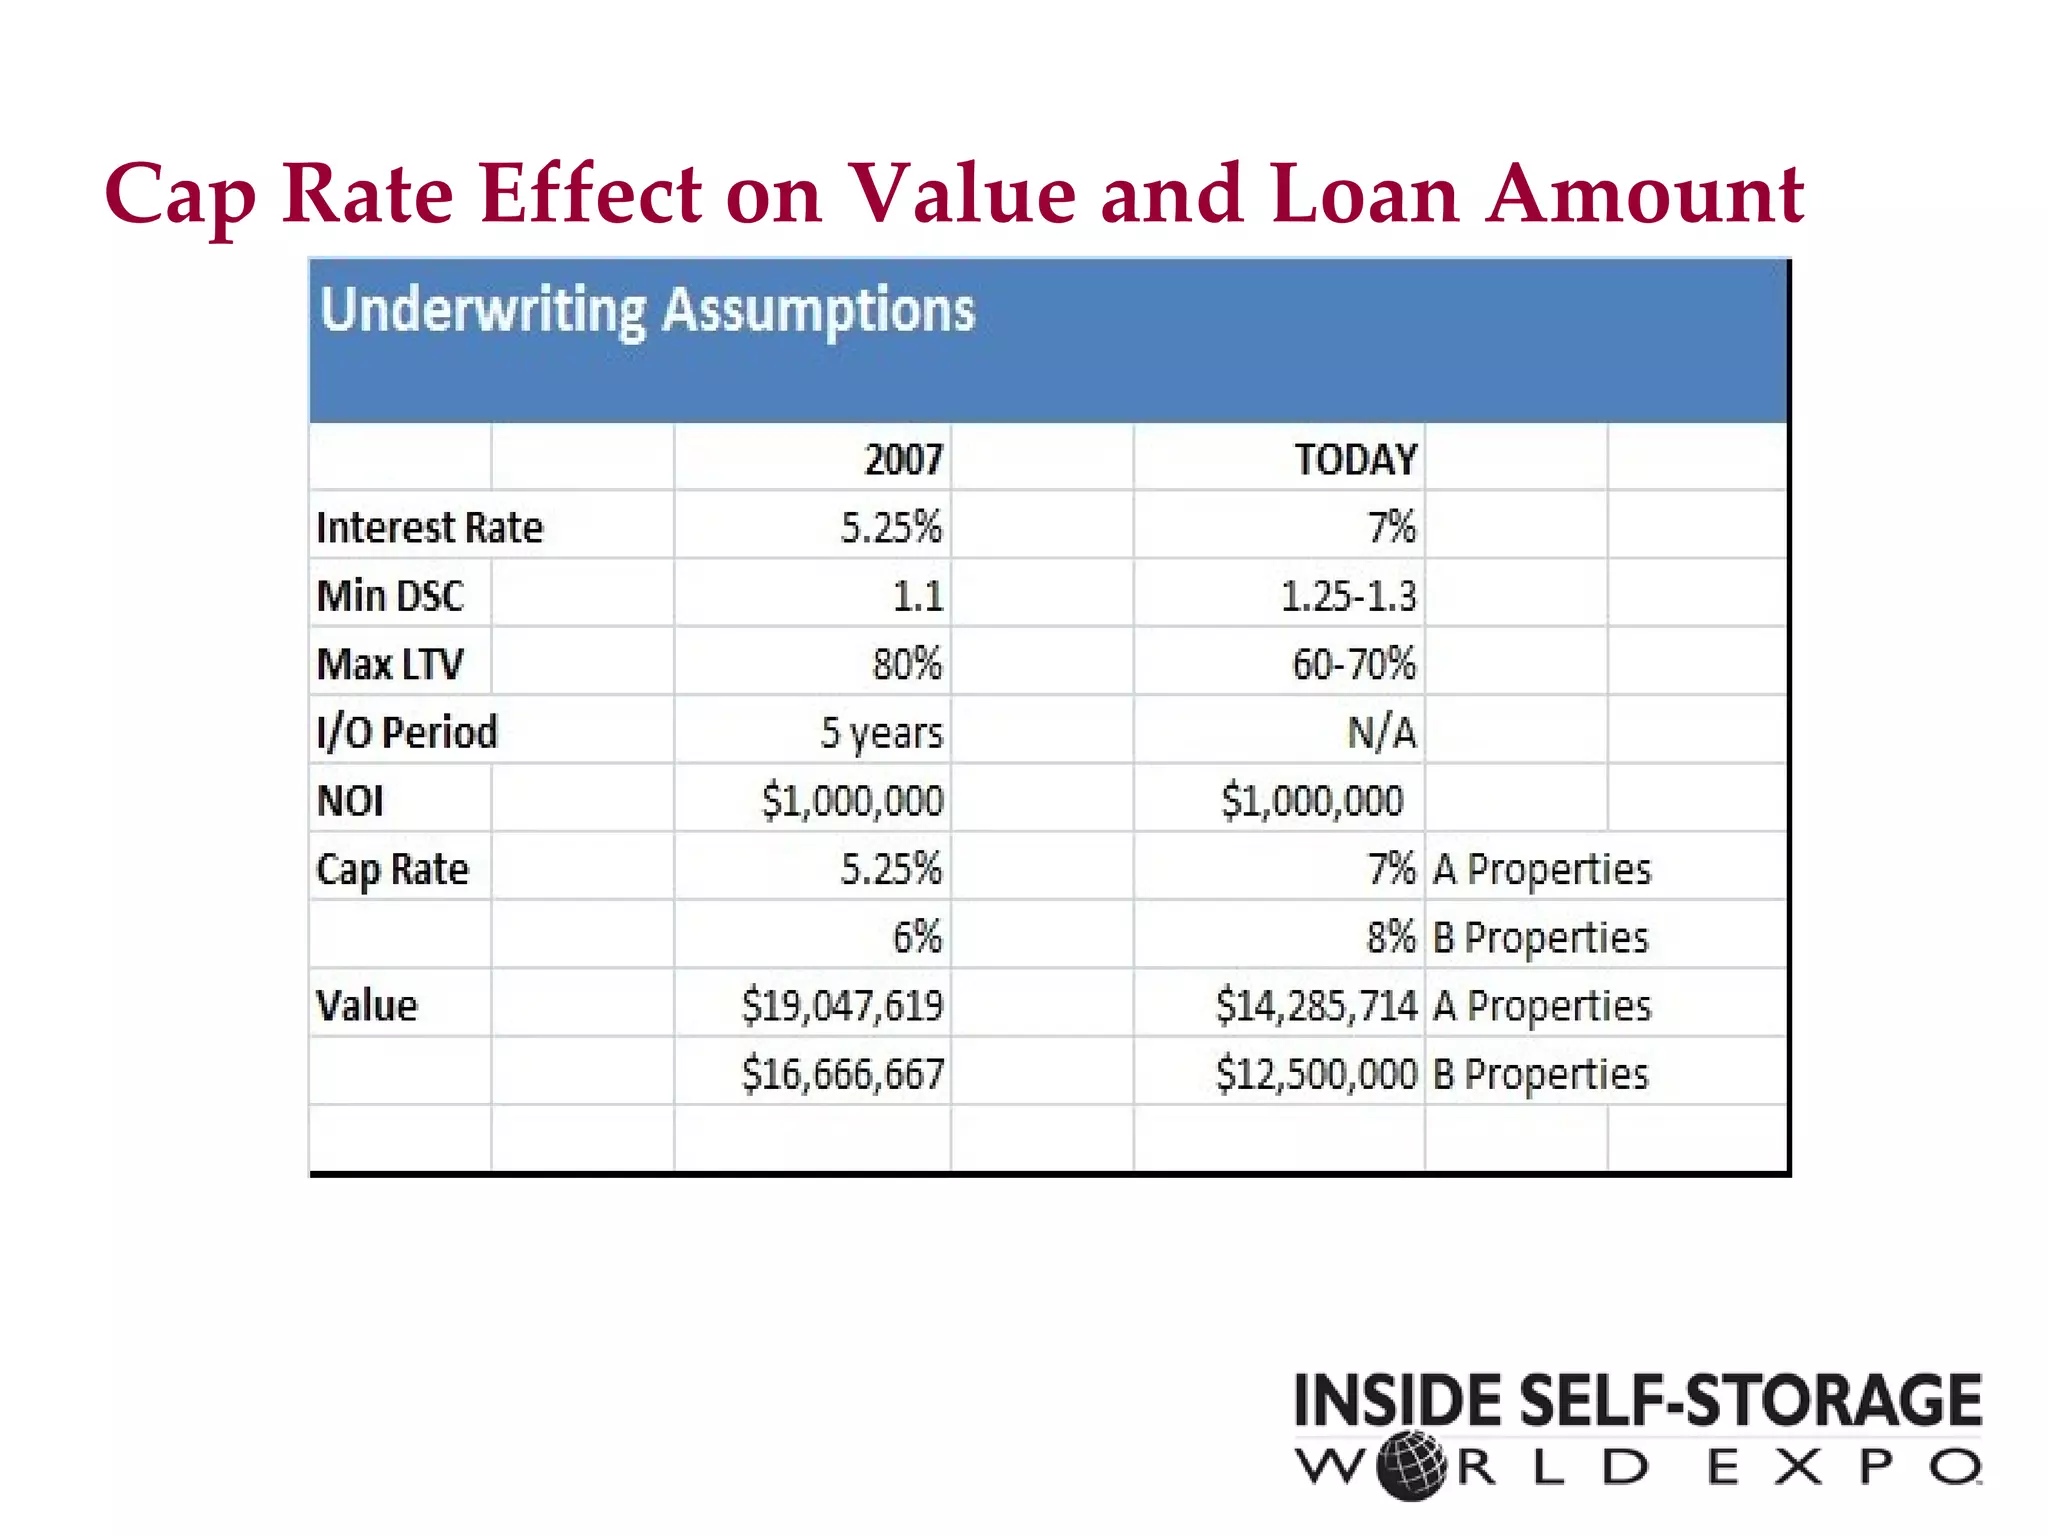
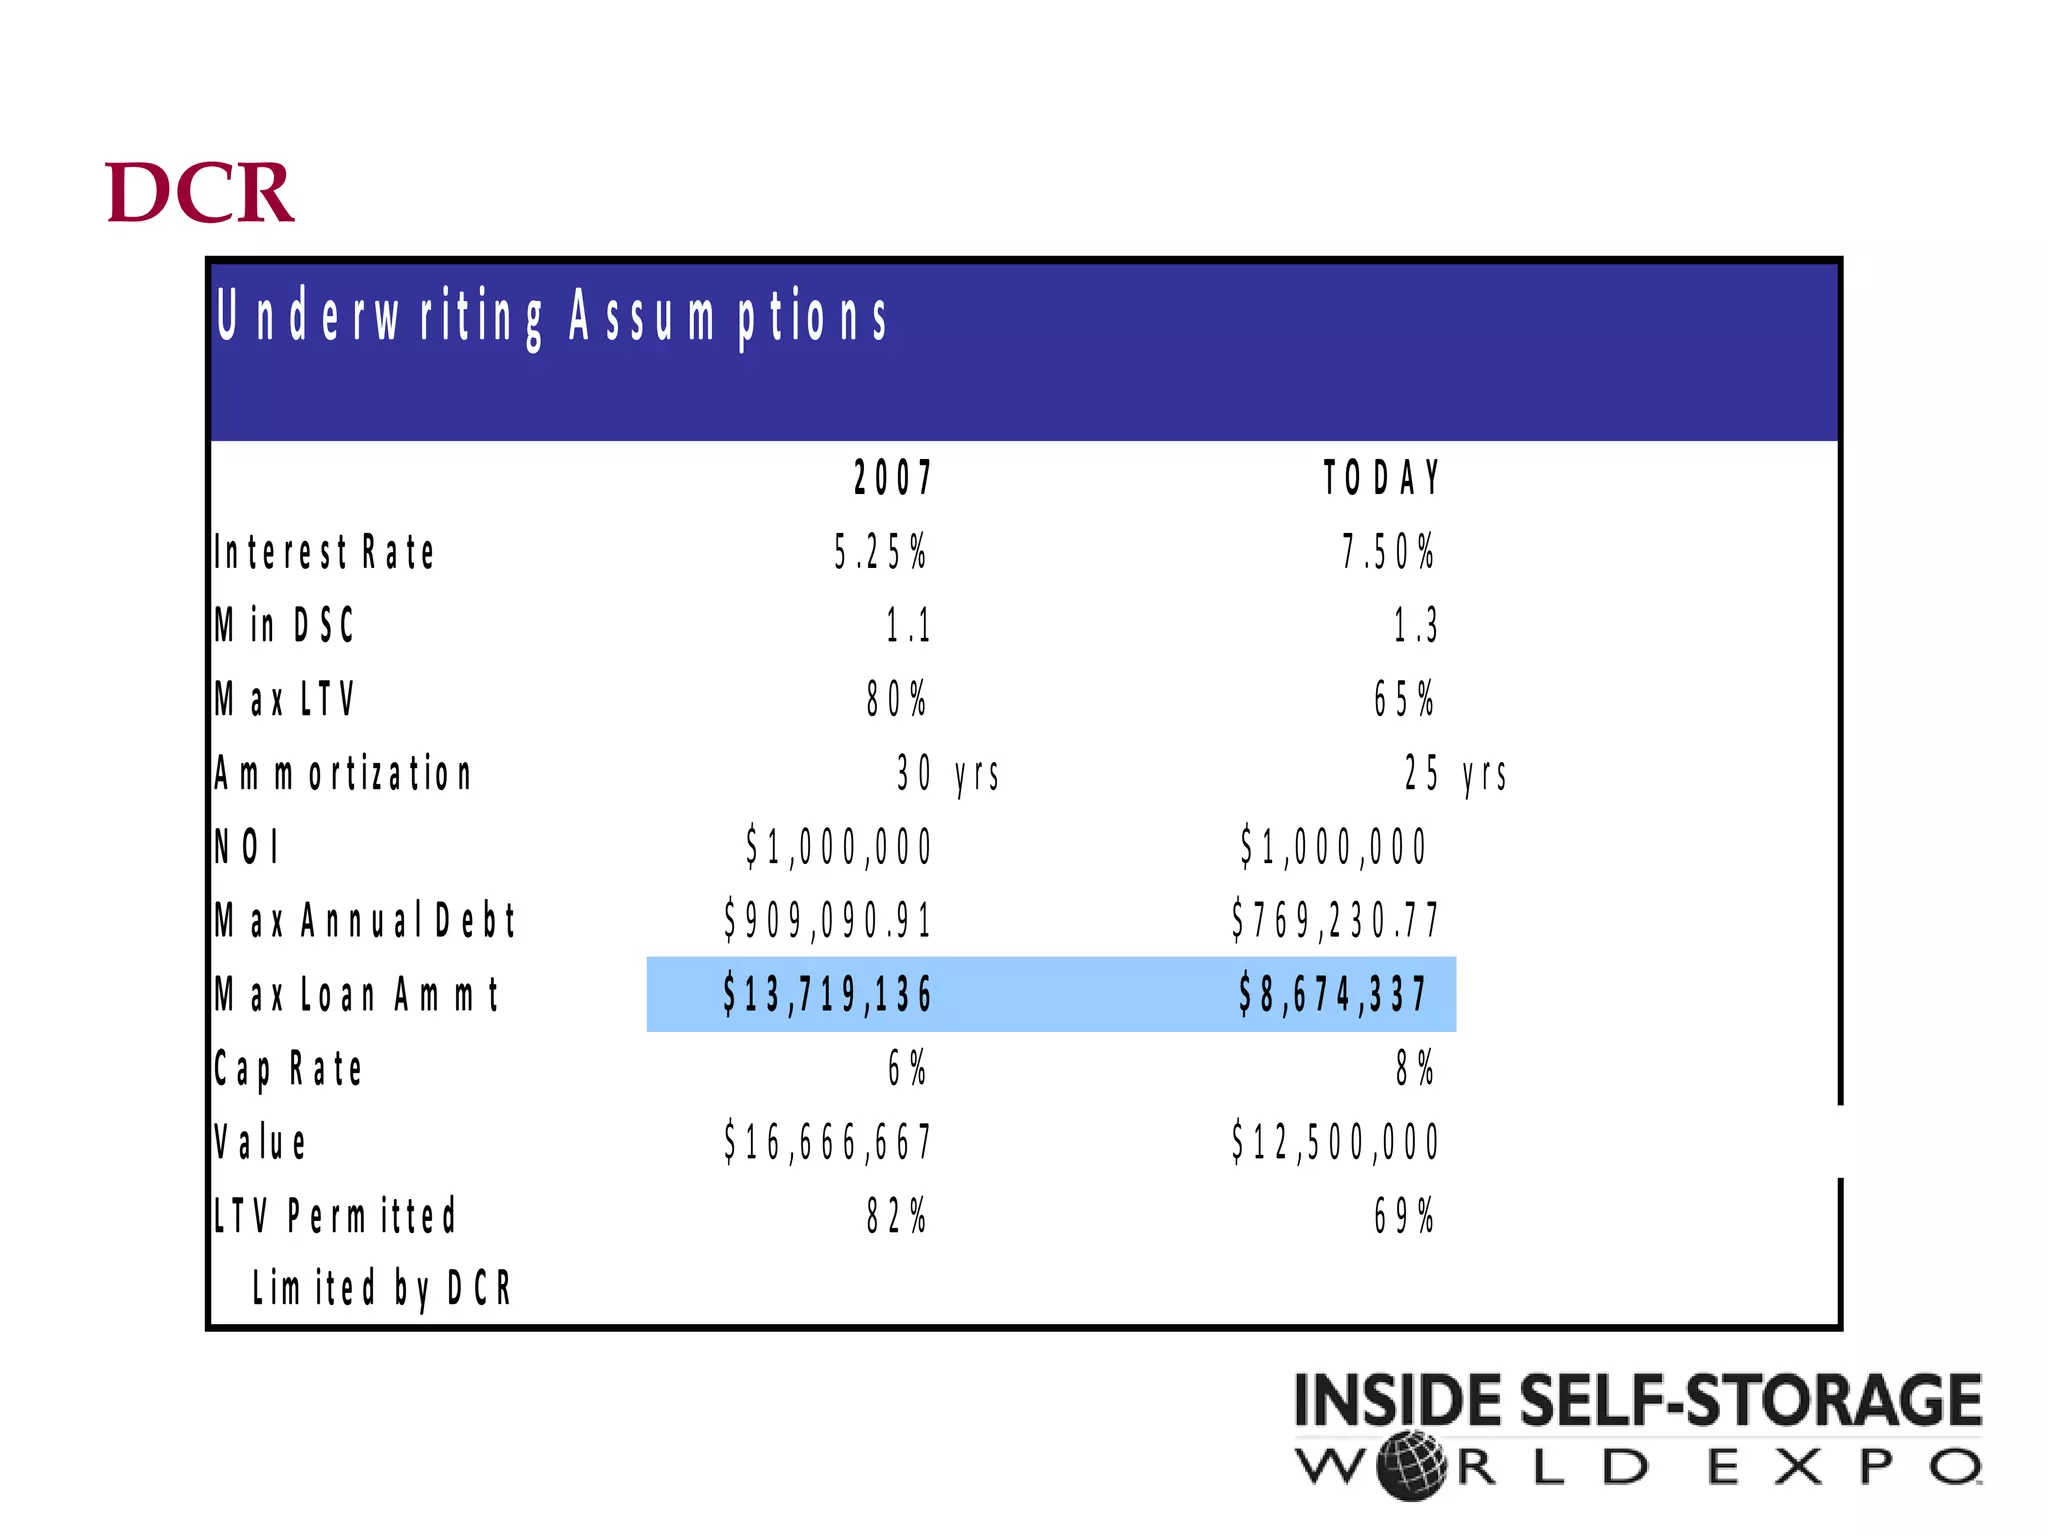
- Additional tools like debt coverage ratios and market studies are now often required to supplement traditional metrics like capitalization rates.


![Watermark Financial Georgia Ragsdale, CEO 11150 W. Olympic Blvd. #150 Los Angeles, CA 90046 [email_address] www.watermarkfinancialgroup.com Office: 310-479-1260](https://image.slidesharecdn.com/grisspresentationfinal2009-124231898867-phpapp02/75/Gr-Iss-Presentation-Final-2009-35-2048.jpg)


![Session3 4-5-6 investment planning [autosaved]](https://cdn.slidesharecdn.com/ss_thumbnails/session3-4-5-6investmentplanningautosaved-150317040013-conversion-gate01-thumbnail.jpg?width=640&height=640&fit=bounds)