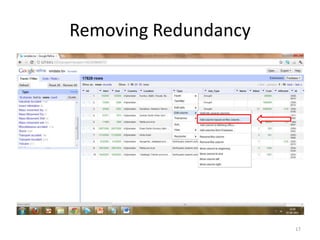
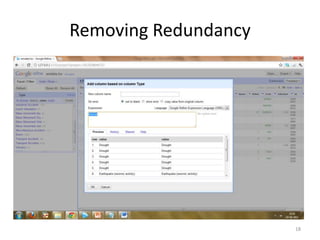
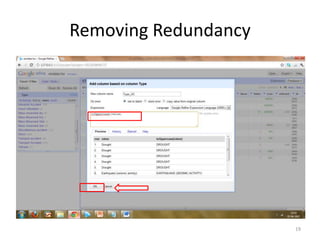
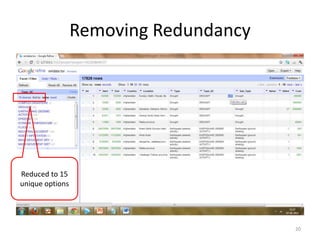
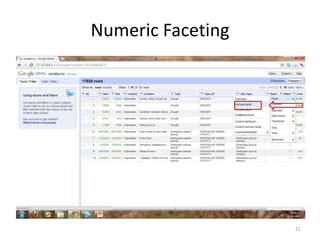
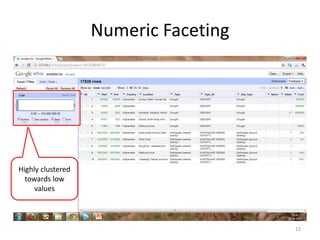
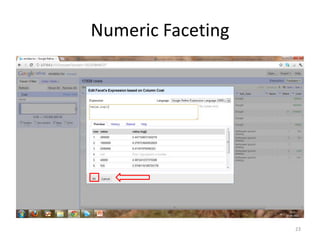
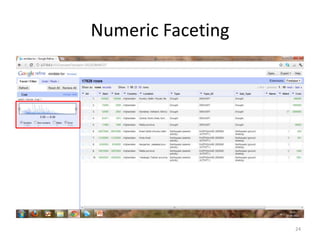
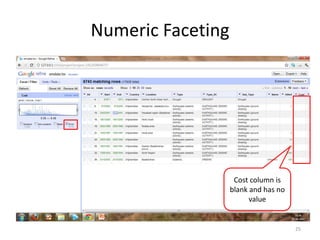
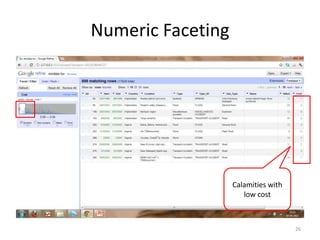
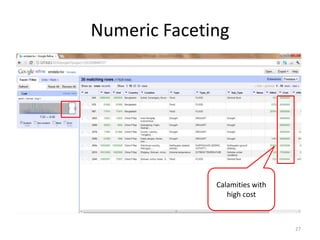
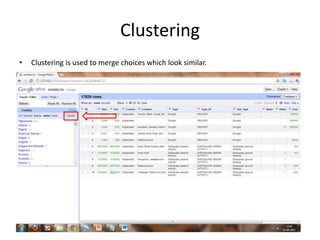
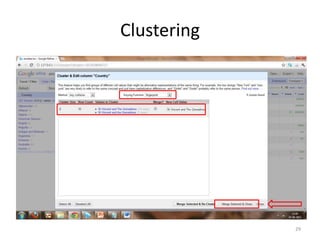
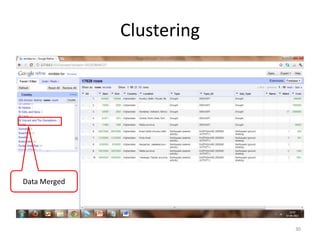
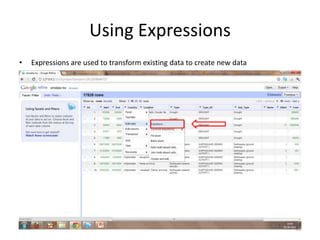
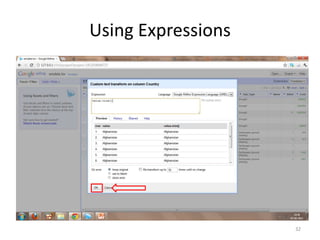
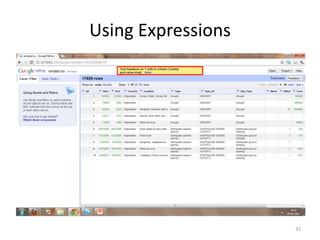
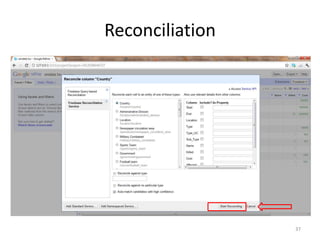
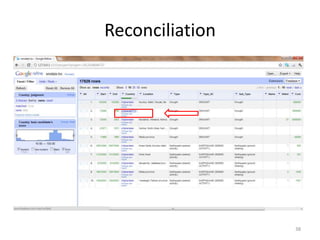
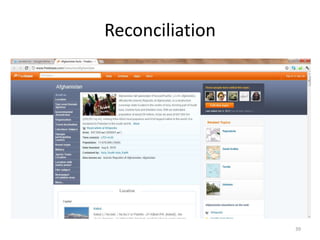
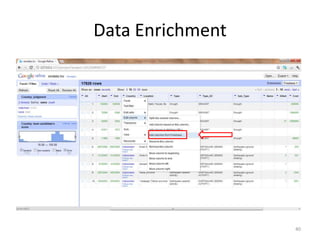
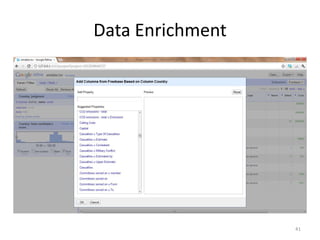
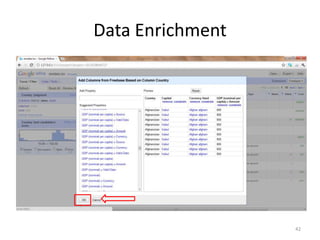
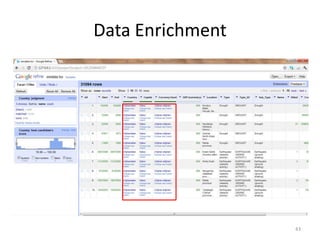
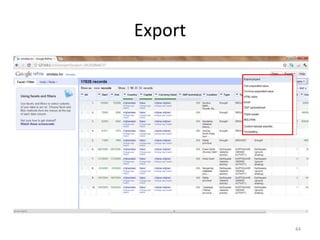
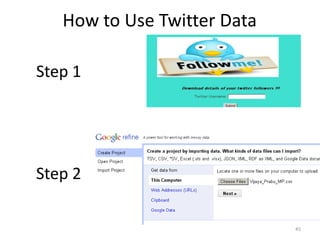
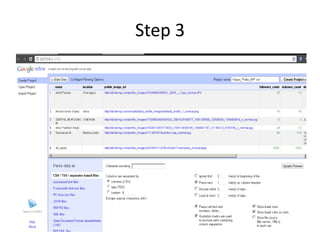
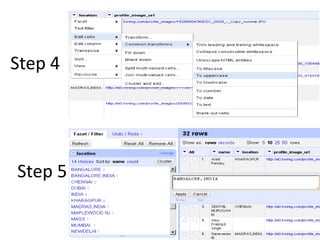
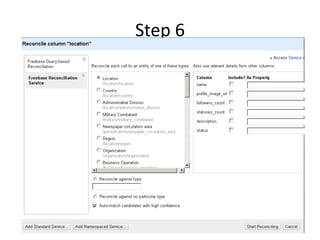
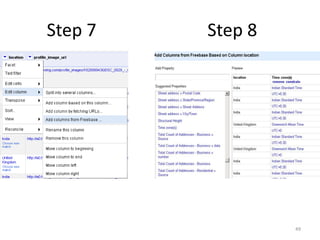
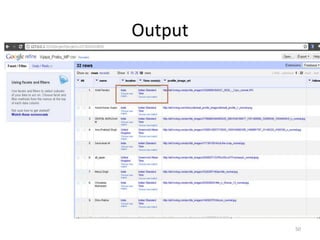
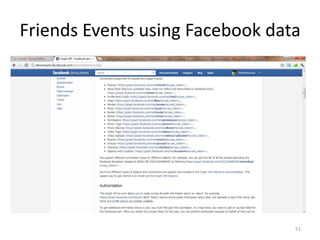
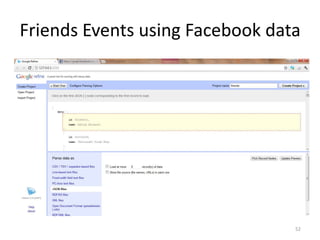
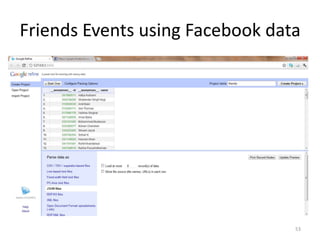
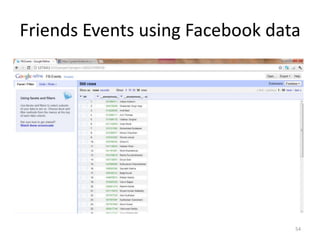
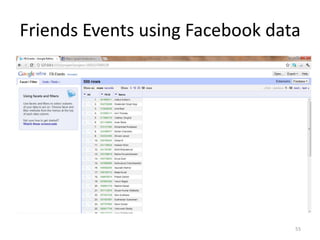
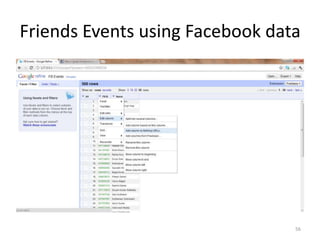
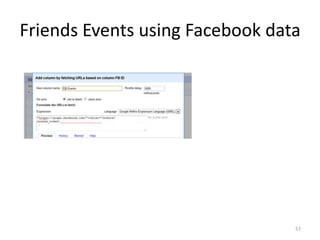
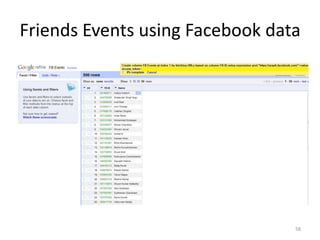
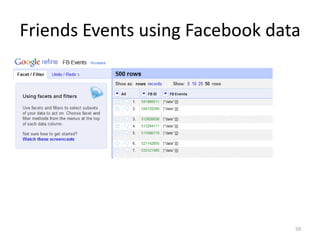
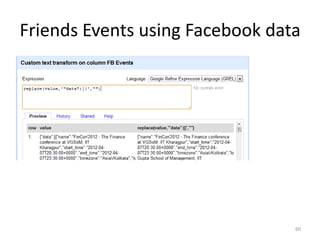
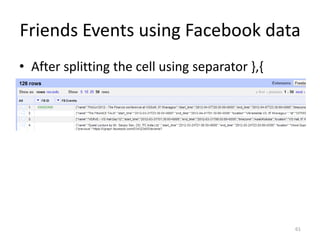
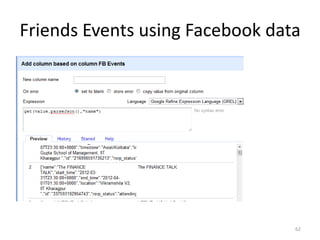
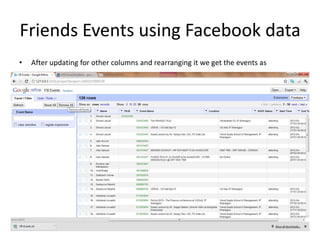
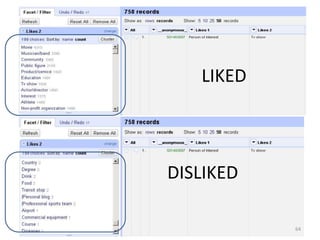
This tutorial demonstrates how to use Google Refine for data cleansing and enrichment. It shows how to import data, perform faceting to identify issues, remove redundancies, cluster similar values, use expressions to transform data, link data to external sources for augmentation, and export the refined data. Functions like numeric faceting, text faceting, and timeline faceting are covered. The tutorial also provides examples of using Refine to extract and structure information from Twitter and Facebook data.
General overview of the Big Data Concept.
Presentation of the Hierarchical Linear Subspace Indexing Method to perform exact similarity search in high dimensional data
Large-Scale Data Extraction, Structuring and Matching using Python and SparkDeep Kayal
Matching data collections with the aim to augment and integrate the information for any available data point that lies in two or more of these collections, is a problem that nowadays arises often. Notable examples of such data points are scientific publications for which metadata and data are kept in various repositories, and users’ profiles, whose metadata and data exist in several social networks or platforms.
In our case, collections were as follows: (1) A large dump of compressed data files on s3 containing archives in the form of zips, tars, bzips and gzips, which were expected to contain published papers in the form of xmls and pdfs, amongst other files, and (2) A large store of xmls in the form of xmls, some of which are to be matched to Collection 1.
The problems, then, are: (1) How to best unzip the compressed archives and extract the relevant files? (2) How to extract meta-information from the xml or pdf files? (3) How to match the meta-information from the two different collections? And all of these must be done in a big-data environment.
The presentation will describe the solution process and the use of python and Spark in the large-scale unzipping and extraction of files from archives, and how metadata was then extracted from the files to perform the matches on.
Big Data Day LA 2015 - Scalable and High-Performance Analytics with Distribut...Data Con LA
"R is the most popular language in the data-science community with 2+ million users and 6000+ R packages. R’s adoption evolved along with its easy-to-use statistical language, graphics, packages, tools and active community. In this session we will introduce Distributed R, a new open-source technology that solves the scalability and performance limitations of vanilla R. Since R is single-threaded and does not scale to accommodate large datasets, Distributed R addresses many of R’s limitations. Distributed R efficiently shares sparse structured data, leverages multi-cores, and dynamically partitions data to mitigate load imbalance.
In this talk, we will show the promise of this approach by demonstrating how important machine learning and graph algorithms can be expressed in a single framework and are substantially faster under Distributed R. Additionally, we will show how Distributed R complements Vertica, a state-of-the-art columnar analytics database, to deliver a full-cycle, fully integrated, data “prep-analyze-deploy” solution."
Risk Analytics Using Knowledge Graphs / FIBO with Deep LearningCambridge Semantics
This EDM Council webinar, sponsored by Cambridge Semantics Inc. and featuring FI Consulting, explores the challenges common to a risk analytics pipeline, application of graph analytics to mortgage loan data and use cases in adjacent areas including customer service, collections, fraud and AML.
Finding The Perfect Donor Database In An Imperfect World4Good.org
There are hundreds of donor databases on the market. Each has its own strengths and weaknesses, fans and foes. The challenge is to find a system with strengths that meet your needs, weaknesses that won’t get in your way, at a price you can afford.
This workshop will cover the basic concepts you will need to evaluate your options and make an informed decision.
Kubernetes & AI - Beauty and the Beast !?! @KCD Istanbul 2024Tobias Schneck
As AI technology is pushing into IT I was wondering myself, as an “infrastructure container kubernetes guy”, how get this fancy AI technology get managed from an infrastructure operational view? Is it possible to apply our lovely cloud native principals as well? What benefit’s both technologies could bring to each other?
Let me take this questions and provide you a short journey through existing deployment models and use cases for AI software. On practical examples, we discuss what cloud/on-premise strategy we may need for applying it to our own infrastructure to get it to work from an enterprise perspective. I want to give an overview about infrastructure requirements and technologies, what could be beneficial or limiting your AI use cases in an enterprise environment. An interactive Demo will give you some insides, what approaches I got already working for real.
Epistemic Interaction - tuning interfaces to provide information for AI supportAlan Dix
Paper presented at SYNERGY workshop at AVI 2024, Genoa, Italy. 3rd June 2024
https://alandix.com/academic/papers/synergy2024-epistemic/
As machine learning integrates deeper into human-computer interactions, the concept of epistemic interaction emerges, aiming to refine these interactions to enhance system adaptability. This approach encourages minor, intentional adjustments in user behaviour to enrich the data available for system learning. This paper introduces epistemic interaction within the context of human-system communication, illustrating how deliberate interaction design can improve system understanding and adaptation. Through concrete examples, we demonstrate the potential of epistemic interaction to significantly advance human-computer interaction by leveraging intuitive human communication strategies to inform system design and functionality, offering a novel pathway for enriching user-system engagements.
Neuro-symbolic is not enough, we need neuro-*semantic*Frank van Harmelen
Neuro-symbolic (NeSy) AI is on the rise. However, simply machine learning on just any symbolic structure is not sufficient to really harvest the gains of NeSy. These will only be gained when the symbolic structures have an actual semantics. I give an operational definition of semantics as “predictable inference”.
All of this illustrated with link prediction over knowledge graphs, but the argument is general.
Key Trends Shaping the Future of Infrastructure.pdfCheryl Hung
Keynote at DIGIT West Expo, Glasgow on 29 May 2024.
Cheryl Hung, ochery.com
Sr Director, Infrastructure Ecosystem, Arm.
The key trends across hardware, cloud and open-source; exploring how these areas are likely to mature and develop over the short and long-term, and then considering how organisations can position themselves to adapt and thrive.
PHP Frameworks: I want to break free (IPC Berlin 2024)Ralf Eggert
In this presentation, we examine the challenges and limitations of relying too heavily on PHP frameworks in web development. We discuss the history of PHP and its frameworks to understand how this dependence has evolved. The focus will be on providing concrete tips and strategies to reduce reliance on these frameworks, based on real-world examples and practical considerations. The goal is to equip developers with the skills and knowledge to create more flexible and future-proof web applications. We'll explore the importance of maintaining autonomy in a rapidly changing tech landscape and how to make informed decisions in PHP development.
This talk is aimed at encouraging a more independent approach to using PHP frameworks, moving towards a more flexible and future-proof approach to PHP development.
State of ICS and IoT Cyber Threat Landscape Report 2024 previewPrayukth K V
The IoT and OT threat landscape report has been prepared by the Threat Research Team at Sectrio using data from Sectrio, cyber threat intelligence farming facilities spread across over 85 cities around the world. In addition, Sectrio also runs AI-based advanced threat and payload engagement facilities that serve as sinks to attract and engage sophisticated threat actors, and newer malware including new variants and latent threats that are at an earlier stage of development.
The latest edition of the OT/ICS and IoT security Threat Landscape Report 2024 also covers:
State of global ICS asset and network exposure
Sectoral targets and attacks as well as the cost of ransom
Global APT activity, AI usage, actor and tactic profiles, and implications
Rise in volumes of AI-powered cyberattacks
Major cyber events in 2024
Malware and malicious payload trends
Cyberattack types and targets
Vulnerability exploit attempts on CVEs
Attacks on counties – USA
Expansion of bot farms – how, where, and why
In-depth analysis of the cyber threat landscape across North America, South America, Europe, APAC, and the Middle East
Why are attacks on smart factories rising?
Cyber risk predictions
Axis of attacks – Europe
Systemic attacks in the Middle East
Download the full report from here:
https://sectrio.com/resources/ot-threat-landscape-reports/sectrio-releases-ot-ics-and-iot-security-threat-landscape-report-2024/
UiPath Test Automation using UiPath Test Suite series, part 4DianaGray10
Welcome to UiPath Test Automation using UiPath Test Suite series part 4. In this session, we will cover Test Manager overview along with SAP heatmap.
The UiPath Test Manager overview with SAP heatmap webinar offers a concise yet comprehensive exploration of the role of a Test Manager within SAP environments, coupled with the utilization of heatmaps for effective testing strategies.
Participants will gain insights into the responsibilities, challenges, and best practices associated with test management in SAP projects. Additionally, the webinar delves into the significance of heatmaps as a visual aid for identifying testing priorities, areas of risk, and resource allocation within SAP landscapes. Through this session, attendees can expect to enhance their understanding of test management principles while learning practical approaches to optimize testing processes in SAP environments using heatmap visualization techniques
What will you get from this session?
1. Insights into SAP testing best practices
2. Heatmap utilization for testing
3. Optimization of testing processes
4. Demo
Topics covered:
Execution from the test manager
Orchestrator execution result
Defect reporting
SAP heatmap example with demo
Speaker:
Deepak Rai, Automation Practice Lead, Boundaryless Group and UiPath MVP
The Art of the Pitch: WordPress Relationships and SalesLaura Byrne
Clients don’t know what they don’t know. What web solutions are right for them? How does WordPress come into the picture? How do you make sure you understand scope and timeline? What do you do if sometime changes?
All these questions and more will be explored as we talk about matching clients’ needs with what your agency offers without pulling teeth or pulling your hair out. Practical tips, and strategies for successful relationship building that leads to closing the deal.
UiPath Test Automation using UiPath Test Suite series, part 3DianaGray10
Welcome to UiPath Test Automation using UiPath Test Suite series part 3. In this session, we will cover desktop automation along with UI automation.
Topics covered:
UI automation Introduction,
UI automation Sample
Desktop automation flow
Pradeep Chinnala, Senior Consultant Automation Developer @WonderBotz and UiPath MVP
Deepak Rai, Automation Practice Lead, Boundaryless Group and UiPath MVP
FIDO Alliance Osaka Seminar: Passkeys and the Road Ahead.pdf
Google refine tutotial
1. Vinod Gupta School of Management, IIT Kharagpur
Google Refine Analysis
A Business Perspective
April, 08 2012
Sathishwaran.R - 10BM60079
Vijaya Prabhu - 10BM60097
This Tutorial was created using Google Refine Version 2.5 on a Windows 7 platform
2. Data Cleansing
• Data cleansing is identifying the wrong or inaccurate
records in the data set and making appropriate
corrections to the records.
• It involves identifying incomplete, inaccurate, and
incorrect parts of data and then either replacing them
with correct data or deleting the incorrect data
• Data cleansing results in data which is consistent with
the other standard data and is useful for performing
various analysis
• The error in the data could be due to data entry error
by the user, failure during transmission of data or
improper data definitions.
2
3. Need for Data Cleansing
• Incorrect or inaccurate data may lead to false
conclusions and can cause investments to be
misdirected in finance.
• Also government needs accurate data on
population and census for directing the funds to
the deserving areas.
• Many organizations tap into customer
information. If the data is not accurate, for eg. If
the address is not accurate then the business
runs the risk of send wrong information, thus
losing customers.
3
4. Challenges Data Cleansing
• Loss of Information: In many cases the record may be
incomplete, hence the whole record may require to be
deleted which leads to loss of information. It could
become costly if huge number of data is deleted.
• Maintenance of Data: Once the data is cleansed then
any change in the data specification needs to affect
only the new values. Hence data management
solutions should be designed in such a way that the
process of data entry and retrieval are altered to
provide correct data.
• Data cleansing is an iterative process which needs
significant work in exploration and corrction of entries.
4
5. About Google Refine
• Google Refine is a powerful tool that can be effectively
used for data cleansing.
• It helps in working with raw data, cleaning it
up, transforming from one format to
other, encompassing it with web services and linking it
to databases.
• It is very easy to use and has a web interface.
• It is freely available and works well with any browser.
• Google Refine is a desktop application and it runs a
small web server on your system and we need to point
our browser to the server to use refine.
5
6. Getting Started - Installation
1. Download the zip file (appropriate
Windows, Mac, Linux versions) from the link
http://code.google.com/p/google-
refine/wiki/Downloads?tm=2
2. Uncompress the files from the zip file.
3. Run the “google-refine.exe” file.
4. A command window opens and Google refine
runs taking the user to the home page in the
default browser.
6
8. Importing Data
• Google Refine supports TSV, CSV, Excel (.xls
and .xlsx), JSON, XML, and Google data
document formats.
• Once imported the data is in Google Refine’s
own data format.
• We have used TSV data on Disasters
worldwide from 1900-2008 available from
http://www.infochimps.com/datasets/disaster
s-worldwide-from-1900-2008 for the tutorial.
8
13. Faceting
• Faceting is about seeing the big picture and
filtering based on rows to work on data you
want to change in bulk.
• We can create a facet for a column to get the
details about that column and then we can
filter to a subset of rows with a constraint.
• We can perform text facet, Numeric
facet, timeline facet and scatterplot facet. Also
various customized facets can be designed.
13
34. Data Augmentation
• Reconciliation option in Google refine allows
data to be linked to web pages. Suppose we
want details on the country where the
calamity has struck we can perform the
following steps
34