Google analytics-sample-report
•
5 likes•10,805 views

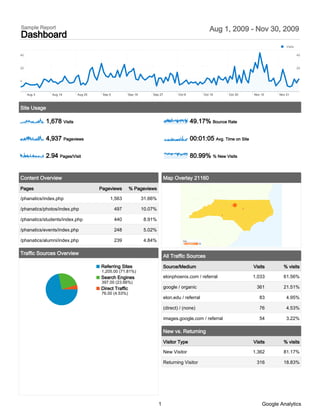
The document summarizes website analytics for a sample report between August 1, 2009 and November 30, 2009. There were 1,678 total visits to the site with the majority (61.56%) coming from referrals from elonphoenix.com. The top five pages viewed were related to photos, students, events, and alumni. Most traffic came from North Carolina (52.68%), with the majority from the city of Elon College. Over 80% of visits were from new visitors.

Recommended
Recommended
More Related Content
Similar to Google analytics-sample-report
Similar to Google analytics-sample-report (20)
Google analytics-sample-report
- 1. Sample Report Aug 1, 2009 - Nov 30, 2009 Dashboard Visits 40 40 20 20 0 0 Aug 3 Aug 14 Aug 25 Sep 5 Sep 16 Sep 27 Oct 8 Oct 19 Oct 30 Nov 10 Nov 21 Site Usage 1,678 Visits 49.17% Bounce Rate 4,937 Pageviews 00:01:05 Avg. Time on Site 2.94 Pages/Visit 80.99% % New Visits Content Overview Map Overlay 21160 Pages Pageviews % Pageviews /phanatics/index.php 1,563 31.66% /phanatics/photos/index.php 497 10.07% /phanatics/students/index.php 440 8.91% /phanatics/events/index.php 248 5.02% /phanatics/alumni/index.php 239 4.84% Visits 1 349 Traffic Sources Overview All Traffic Sources Referring Sites Source/Medium Visits % visits 1,205.00 (71.81%) Search Engines elonphoenix.com / referral 1,033 61.56% 397.00 (23.66%) Direct Traffic google / organic 361 21.51% 76.00 (4.53%) elon.edu / referral 83 4.95% (direct) / (none) 76 4.53% images.google.com / referral 54 3.22% New vs. Returning Visitor Type Visits % visits New Visitor 1,362 81.17% Returning Visitor 316 18.83% 1 Google Analytics
- 2. Keywords Keyword Visits % visits photos 48 12.09% phoenix phanatics 26 6.55% pictures 25 6.30% organization fair 14 3.53% dr. danieley 10 2.52% 2 Google Analytics
- 3. Sample Report Aug 1, 2009 - Nov 30, 2009 Content Overview Pageviews 200 200 100 100 0 0 Aug 3 Aug 14 Aug 25 Sep 5 Sep 16 Sep 27 Oct 8 Oct 19 Oct 30 Nov 10 Nov 21 Pages on this site were viewed a total of 4,937 times 4,937 Pageviews 3,908 Unique Views 49.17% Bounce Rate Top Content Pages Pageviews % Pageviews /phanatics/index.php 1,563 31.66% /phanatics/photos/index.php 497 10.07% /phanatics/students/index.php 440 8.91% /phanatics/events/index.php 248 5.02% /phanatics/alumni/index.php 239 4.84% 3 Google Analytics
- 4. Sample Report Aug 1, 2009 - Nov 30, 2009 Traffic Sources Overview Visits 40 40 20 20 0 0 Aug 3 Aug 14 Aug 25 Sep 5 Sep 16 Sep 27 Oct 8 Oct 19 Oct 30 Nov 10 Nov 21 All traffic sources sent a total of 1,678 visits 4.53% Direct Traffic Referring Sites 1,205.00 (71.81%) Search Engines 71.81% Referring Sites 397.00 (23.66%) Direct Traffic 76.00 (4.53%) 23.66% Search Engines Top Traffic Sources Sources Visits % visits Keywords Visits % visits elonphoenix.com (referral) 1,033 61.56% photos 48 12.09% google (organic) 361 21.51% phoenix phanatics 26 6.55% elon.edu (referral) 83 4.95% pictures 25 6.30% (direct) ((none)) 76 4.53% organization fair 14 3.53% images.google.com (referral) 54 3.22% dr. danieley 10 2.52% 4 Google Analytics
- 5. Sample Report Aug 1, 2009 - Nov 30, 2009 Keywords Visits 20 20 10 10 0 0 Aug 3 Aug 14 Aug 25 Sep 5 Sep 16 Sep 27 Oct 8 Oct 19 Oct 30 Nov 10 Nov 21 Search sent 397 total visits via 226 keywords Site Usage Visits Pages/Visit Avg. Time on Site % New Visits Bounce Rate 397 2.47 00:00:59 84.63% 62.97% % of Site Total: Site Avg: Site Avg: Site Avg: Site Avg: 23.66% 2.94 (-15.93%) 00:01:05 (-9.10%) 80.99% (4.50%) 49.17% (28.08%) Keyword Visits Pages/Visit Avg. Time on % New Visits Bounce Rate Site photos 48 2.88 00:01:22 68.75% 50.00% phoenix phanatics 26 5.69 00:03:14 69.23% 19.23% pictures 25 2.80 00:00:50 96.00% 32.00% organization fair 14 1.14 00:00:20 78.57% 85.71% dr. danieley 10 2.00 00:00:29 80.00% 80.00% elon college fighting christians 8 1.50 00:00:06 87.50% 87.50% elon university mascot 8 1.62 00:00:27 100.00% 62.50% phanatics 6 2.50 00:00:54 83.33% 50.00% phoenix 14 6 1.17 00:00:01 83.33% 83.33% elon motto 5 1.00 00:00:00 100.00% 100.00% 1 - 10 of 226 5 Google Analytics
- 6. Sample Report State Detail: Aug 1, 2009 - Nov 30, 2009 North Carolina Visits 1 349 This state sent 884 visits via 78 cities Site Usage Visits Pages/Visit Avg. Time on Site % New Visits Bounce Rate 884 3.10 00:01:10 78.96% 45.70% % of Site Total: Site Avg: Site Avg: Site Avg: Site Avg: 52.68% 2.94 (5.50%) 00:01:05 (6.97%) 80.99% (-2.51%) 49.17% (-7.05%) City Visits Pages/Visit Avg. Time on % New Visits Bounce Rate Site Elon College 349 3.01 00:01:05 73.07% 47.28% Greensboro 106 3.10 00:01:12 80.19% 43.40% Raleigh 76 3.45 00:01:14 69.74% 42.11% Charlotte 47 3.19 00:01:18 80.85% 42.55% Graham 36 2.81 00:01:17 94.44% 38.89% Winston Salem 25 2.36 00:01:00 92.00% 56.00% Morrisville 16 3.25 00:01:30 50.00% 12.50% Mebane 15 2.47 00:00:21 93.33% 53.33% Cary 13 5.00 00:01:36 76.92% 30.77% 6 Google Analytics
- 7. Jamestown 12 1.83 00:02:41 91.67% 66.67% 1 - 10 of 78 7 Google Analytics
- 8. Sample Report Aug 1, 2009 - Nov 30, 2009 All Traffic Sources Visits 40 40 20 20 0 0 Aug 3 Aug 14 Aug 25 Sep 5 Sep 16 Sep 27 Oct 8 Oct 19 Oct 30 Nov 10 Nov 21 All traffic sources sent 1,678 visits via 23 sources and mediums Site Usage Visits Pages/Visit Avg. Time on Site % New Visits Bounce Rate 1,678 2.94 00:01:05 81.17% 49.17% % of Site Total: Site Avg: Site Avg: Site Avg: Site Avg: 100.00% 2.94 (0.00%) 00:01:05 (0.00%) 80.99% (0.22%) 49.17% (0.00%) Source/Medium Visits Pages/Visit Avg. Time on % New Visits Bounce Rate Site elonphoenix.com / referral 1,033 3.12 00:01:10 80.83% 43.27% google / organic 361 2.55 00:01:04 84.21% 61.50% elon.edu / referral 83 3.81 00:01:00 79.52% 43.37% (direct) / (none) 76 3.14 00:01:04 55.26% 55.26% images.google.com / referral 54 1.67 00:00:22 96.30% 61.11% yahoo / organic 15 1.67 00:00:18 100.00% 80.00% bing / organic 14 1.79 00:00:18 92.86% 71.43% gallery.pictopia.com / referral 8 2.62 00:01:10 100.00% 37.50% facebook.com / referral 7 4.14 00:01:39 85.71% 14.29% aol / organic 6 1.50 00:00:11 50.00% 83.33% 1 - 10 of 23 8 Google Analytics
- 9. Sample Report Aug 1, 2009 - Nov 30, 2009 New vs. Returning Visits 40 40 20 20 0 0 Aug 3 Aug 14 Aug 25 Sep 5 Sep 16 Sep 27 Oct 8 Oct 19 Oct 30 Nov 10 Nov 21 1,678 visits from 2 visitor types Site Usage Visits Pages/Visit Avg. Time on Site % New Visits Bounce Rate 1,678 2.94 00:01:05 81.17% 49.17% % of Site Total: Site Avg: Site Avg: Site Avg: Site Avg: 100.00% 2.94 (0.00%) 00:01:05 (0.00%) 80.99% (0.22%) 49.17% (0.00%) Visitor Type Visits Pages/Visit Avg. Time on % New Visits Bounce Rate Site New Visitor 1,362 2.92 00:01:04 100.00% 51.47% Returning Visitor 316 3.03 00:01:09 0.00% 39.24% 1 - 2 of 2 9 Google Analytics