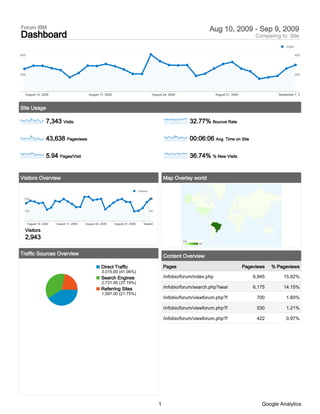
This document provides analytics data for a forum website from August 10, 2009 to September 9, 2009. It summarizes key metrics such as visits (7,343), pageviews (43,638), average time on site (00:06:06), bounce rate (32.77%), and new visits (36.74%). The top traffic sources were direct (41.06%) and search engines (37.19%). The majority of visits came from Brazil (6,938 visits, 94.48% of total), with the top city being Ribeirao Preto (4,104 visits). The most viewed page was the forum index page (/infobio/forum/index.php).
Nordic Connectivity Daniel Sjöberg, Telia Sonera I CNiklas Johnsson
The document discusses Nordic Connectivity and TeliaSonera International Carrier (TSIC). It summarizes that TSIC operates a global telecommunications network extending throughout Europe, North America and Asia. It owns its network, giving it control over quality of service. The document also outlines issues with today's internet landscape and proposes a new ecosystem where TSIC ensures end-to-end quality of experience and connects major internet service providers and content providers.
This document summarizes analytics data for the website www.zahara.co.za from October 1, 2011 to January 1, 2012. It shows that there were 2,482 total visits over this period, with 2,139 unique visitors. Visitors viewed a total of 4,738 pages across these visits, spending an average of 2 minutes and 8 seconds on the site per visit. The bounce rate was 65.83% and 86.14% of visits were from new visitors. The top three browsers used were Opera Mini, Internet Explorer, and Firefox. The majority of traffic came from direct visits and search engines like Google. South Africa accounted for the largest share of visits geographically.
Line by environment interaction, yield stability and grouping of test locatio...ILRI
Presented by Kassaye Negash and Kidane Tumsa (National Lowland Pulses Research Program at Melkassa Agricultural Research Center-EIAR) at the First Bio-Innovate Regional Scientific Conference, Addis Ababa, Ethiopia, 25-27 February 2013
cost analysis about using internet web based tools Malik
The document outlines the costs associated with developing an online course using Web 2.0 technologies. It breaks the costs down into three categories: development, delivery, and support. Development costs make up the largest portion at 54% and include expenses like content preparation, editing, and equipment. Delivery costs, which account for 46%, cover items like the web server, domain, and design work. Support costs, the smallest category, relate to ongoing maintenance and student assistance after launch.
This document provides an overview of madvertise Mobile Advertising GmbH, a mobile advertising company. It summarizes madvertise's offerings including their mobile advertising network, booking options on premium publisher sites and apps, targeting capabilities, services, and traffic reach across Germany, Europe and globally. Madvertise works with over 155 million impressions in Germany, Austria and Switzerland and over 6.78 billion impressions globally across websites, apps, and channels like news, sports, community portals and more. They offer targeting based on mobile device, content, demographic and location factors.
The document summarizes website analytics data from July 1 to September 30, 2011 and compares it to the previous period of April 1 to June 30, 2011. There was an increase in visits, pageviews, time on site, and unique visitors over the period. Top pages included webinars and short course materials. The majority of traffic came from direct visits and bounce rate and new visits also increased compared to the previous period.
Python é amplamente utilizado na ciência para obter, processar e visualizar dados, bem como comunicar resultados. Alguns pacotes populares são IPython para notebooks interativos, NumPy para arrays, Matplotlib para gráficos, Scipy para cálculos, e Scikit-Learn para mineração de dados. Python oferece uma poderosa alternativa a outros softwares científicos.
The document is a report on website traffic and keyword search data from www.informaticabiomedica.com.br between January 2008 and November 2019. It provides statistics on total visits, pages per visit, time on site, new visits, and bounce rate. It also lists the top performing search keywords, number of visits from each keyword, and associated statistics. The top keyword was "doença ela" which drove 121 visits. Overall the site saw 8,050 total visits from 5,340 keywords during this period.
Analytics GAE - Plurk Avatar History 20090825-20090909Toomore
This document summarizes web analytics data for a site from August 31, 2009 to September 7, 2009. It shows that there were 13,271 unique visitors over this period, with the majority (91.58%) from Taiwan. Users spent on average 13 minutes and 15 seconds on the site and had a bounce rate of 28.51%. The top referral source was plurk.com, accounting for 53.88% of visits.
Analytics Forum Ibm 20080101 20091120 (Dashboard Report) 1Raony Guimarães
This document provides analytics data from Google Analytics for a forum website called "Forum IBM" between January 2008 and November 2009. It summarizes key metrics about visits, visitors, traffic sources, technical details, maps, and content for the site over this time period. The highest visiting country was Brazil, which accounted for over 112,000 visits from 311 cities. The top city was Ribeirao Preto with over 52,000 visits.
This document summarizes web analytics data for the website www.tashy.ro from October 23, 2009 to November 22, 2009. Some key findings include:
- There were 4,172 total visits during this period, with most visits occurring from October 23-24 and fewer visits in subsequent periods.
- Visitors viewed a total of 8,150 pages with an average of 1.95 pages per visit and an average time on site of 3 minutes and 15 seconds. The bounce rate was 64.84% and 87.9% of visits were from new visitors.
- Traffic sources were mostly from search engines (89.14%), primarily Google organic searches. Direct traffic and referring sites accounted for the remainder.
According to the analytics data from a website between January 2009 and March 2010:
- The site had over 7.5 million visitors and over 13 million pageviews
- Most visitors used Internet Explorer or Firefox as their browser and had DSL or cable internet connections
- Visitors spent an average of just under 1 minute on the site and over 70% bounced without viewing multiple pages
The document summarizes website analytics for a sample report between August 1, 2009 and November 30, 2009. There were 1,678 total visits to the site with the majority (61.56%) coming from referrals from elonphoenix.com. The top five pages viewed were related to photos, students, events, and alumni. Most traffic came from North Carolina (52.68%), with the majority from the city of Elon College. Over 80% of visits were from new visitors.
Estatísticas analisadas do Blog do Torcedor (www.blogdotorcedor.com.br), de 2...Jamildo Melo
This document summarizes analytics data for the website www.blogdotorcedor.com.br between October 29, 2008 and April 29, 2009. Some key findings include:
- The site had 404,371 visitors over this period with 2,894,871 total visits and 4,137,711 pageviews.
- The majority of traffic came from Brazil, with over 2.7 million visits, and other top countries included the US, Portugal, Canada, and Spain.
- The most visited page was the main page at /blogs/blogdotorcedor/ which received over 2.3 million views alone.
Analytics e baske_tsk_201106_(visitorsoverviewreport)OneClick
According to the site analytics for June 1-30, 2011:
1) There were 114,080 total visits from 24,701 unique visitors who viewed 315,638 pages.
2) The average time on site was 5 minutes and 2 seconds with a 41.23% bounce rate and 13.54% of visits being new.
3) Firefox, Internet Explorer, and Chrome were the most commonly used browsers, accounting for over 80% of visits.
Analytics e baske_tsk_201104_(visitorsoverviewreport)OneClick
Visitors to the site fluctuated between around 4,000 and 8,000 over the month of April 2011. There were a total of 43,296 unique visitors who made 192,328 visits and viewed 707,018 pages with an average of 3.68 pages per visit. Visitors spent an average of 00:07:05 on the site and 30.82% bounced without viewing additional pages. Firefox was the most commonly used browser, accounting for 38.95% of visits.
The document is a report from Google Analytics summarizing website traffic and usage for affluentmagazine.com over two periods: October 17, 2010 - November 16, 2010 and September 16, 2010 - October 16, 2010. Key findings include a 56.37% increase in visits, higher bounce rates and shorter average time on site compared to the previous period, and traffic primarily from search engines and direct visits. The United States was the top country for traffic.
The document summarizes website analytics data for affluentmagazine.com from October 17, 2010 to November 16, 2010 and compares it to the previous period. There was an increase in visits, unique visitors, pageviews, and traffic from search engines. However, bounce rate and percentage of new visits increased while average time on site and pages per visit decreased.
Analytics e baske_tsk_201109_(visitorsoverviewreport)OneClick
The document is a report from Google Analytics summarizing website traffic for a site between September 1-30, 2011. It shows that there were 22,289 visitors who made 114,941 visits to the site, viewing 248,589 pages over an average time of 4 minutes and 3 seconds. The bounce rate was 53.55% and 14.34% of visits were from new visitors. Firefox was the most commonly used browser, accounting for 35.91% of visits.
Estatísticas analisadas do Blog do Torcedor (www.blogdotorcedor.com.br), de 2...Blog do Torcedor/JC Online
This document summarizes analytics data for the website www.blogdotorcedor.com.br from October 28, 2008 to April 28, 2009. Some key findings include:
- There were over 2.8 million visits and 4.1 million pageviews during this period.
- The majority of traffic (42%) came from referring sites like google and jc.uol.com.br, while 39% was direct and 18% from search engines.
- The top page was /blogs/blogdotorcedor/ which received over 2.3 million views alone, accounting for 57% of all pageviews.
Visitors to the site fluctuated between 4,000 and 8,000 over the month of March 2011. In total, there were 46,214 unique visitors who made 223,590 visits and viewed 878,236 pages with an average time on site of 8 minutes and 3 seconds and a bounce rate of 32.29%. Firefox was the most commonly used browser, accounting for 39.53% of visits.
This summary analyzes web traffic to a government website from October 1, 2010 to December 31, 2010. It shows that the site received 5,738 visits from 2,499 unique visitors over this period. The bounce rate was 36.18% and 34.09% of visits were single page sessions. The top performing pages were /Home.aspx, /home.aspx, and /ProductPage.aspx.
Digital: The bare minimum you need to know to sound like you know what you’re...Mark Congiusta
This document provides an overview of digital marketing basics. It covers technology platforms and browsers, image formats and resolution, websites, display ads, and interactive production. Key terms are defined for HTML, CSS, SEO, analytics, and more. Website technologies like PHP, ASP, and databases are explained. Display ad formats, dimensions, and how to read a media plan are also reviewed.
Analytics e baske_tsk_201107_(visitorsoverviewreport)OneClick
Visitors to the site increased from July 4th to July 25th, peaking at around 3,000 visitors per day. Over the month there were 25,966 unique visitors who made 107,347 visits and viewed 271,425 pages with an average of 2.53 pages per visit. Visitors spent on average 4 minutes and 19 seconds on the site with a bounce rate of 47.58% and 16.54% of visits being from new visitors. Firefox was the most commonly used browser for visiting the site, accounting for 36.41% of visits.
Travelwires.com Google Analytics ReportBlogatize.net
This document summarizes website analytics for travelwires.com from November 6, 2009 to December 6, 2009. It shows that the site received 18,361 visits from 159 countries, with most visits coming from South Africa (11,010 visits). Pages on the site received a total of 28,992 pageviews, with the top page being /wp/ which received 2,203 views. The average time on site was 1 minute 31 seconds and the bounce rate was 76.23%.
The website www.runmx.com received 82,559 visits from May 16 to June 15, 2011. The majority of traffic, 76.26%, came from search engines like Google and Bing. Mexico accounted for the largest number of visits at 63,880. Users from Mexico averaged 6.92 pages per visit and spent 3 minutes and 41 seconds on the site. The overall bounce rate was 23.7% and 60.91% of visits were from new users.
Facebook has seen significant growth across Central and Eastern European (CEE) countries. The number of Facebook users in Poland, Russia, and other CEE nations has increased substantially. Facebook impressions now account for a large percentage of total online impressions in some CEE countries like Serbia, where Facebook impressions make up 39% of all impressions. Most Facebook users in CEE are between the ages of 18-34. Brands have found success on Facebook in CEE by launching fan pages and running ads to gain fans.
The document provides analytics data for the website www.tashy.ro from December 1-31, 2009. Some key details:
- There were 87,204 visits and 61,196 unique visitors to the site.
- The top traffic source was Google organic search (69.97% of visits).
- The top page was /partiale-exit-poll-uri-alegeri-prezidentiale-2009-%E2%80%93- which received 22.98% of pageviews.
- The site had a 70.53% bounce rate and visitors spent an average of 3 minutes and 4 seconds on site.
Conversational agents, or chatbots, are increasingly used to access all sorts of services using natural language. While open-domain chatbots - like ChatGPT - can converse on any topic, task-oriented chatbots - the focus of this paper - are designed for specific tasks, like booking a flight, obtaining customer support, or setting an appointment. Like any other software, task-oriented chatbots need to be properly tested, usually by defining and executing test scenarios (i.e., sequences of user-chatbot interactions). However, there is currently a lack of methods to quantify the completeness and strength of such test scenarios, which can lead to low-quality tests, and hence to buggy chatbots.
To fill this gap, we propose adapting mutation testing (MuT) for task-oriented chatbots. To this end, we introduce a set of mutation operators that emulate faults in chatbot designs, an architecture that enables MuT on chatbots built using heterogeneous technologies, and a practical realisation as an Eclipse plugin. Moreover, we evaluate the applicability, effectiveness and efficiency of our approach on open-source chatbots, with promising results.
What is an RPA CoE? Session 1 – CoE VisionDianaGray10
In the first session, we will review the organization's vision and how this has an impact on the COE Structure.
Topics covered:
• The role of a steering committee
• How do the organization’s priorities determine CoE Structure?
Speaker:
Chris Bolin, Senior Intelligent Automation Architect Anika Systems
More Related Content
Similar to Analytics Forum Ibm 20090810 20090909 (Dashboard Report)
Analytics GAE - Plurk Avatar History 20090825-20090909Toomore
This document summarizes web analytics data for a site from August 31, 2009 to September 7, 2009. It shows that there were 13,271 unique visitors over this period, with the majority (91.58%) from Taiwan. Users spent on average 13 minutes and 15 seconds on the site and had a bounce rate of 28.51%. The top referral source was plurk.com, accounting for 53.88% of visits.
Analytics Forum Ibm 20080101 20091120 (Dashboard Report) 1Raony Guimarães
This document provides analytics data from Google Analytics for a forum website called "Forum IBM" between January 2008 and November 2009. It summarizes key metrics about visits, visitors, traffic sources, technical details, maps, and content for the site over this time period. The highest visiting country was Brazil, which accounted for over 112,000 visits from 311 cities. The top city was Ribeirao Preto with over 52,000 visits.
This document summarizes web analytics data for the website www.tashy.ro from October 23, 2009 to November 22, 2009. Some key findings include:
- There were 4,172 total visits during this period, with most visits occurring from October 23-24 and fewer visits in subsequent periods.
- Visitors viewed a total of 8,150 pages with an average of 1.95 pages per visit and an average time on site of 3 minutes and 15 seconds. The bounce rate was 64.84% and 87.9% of visits were from new visitors.
- Traffic sources were mostly from search engines (89.14%), primarily Google organic searches. Direct traffic and referring sites accounted for the remainder.
According to the analytics data from a website between January 2009 and March 2010:
- The site had over 7.5 million visitors and over 13 million pageviews
- Most visitors used Internet Explorer or Firefox as their browser and had DSL or cable internet connections
- Visitors spent an average of just under 1 minute on the site and over 70% bounced without viewing multiple pages
The document summarizes website analytics for a sample report between August 1, 2009 and November 30, 2009. There were 1,678 total visits to the site with the majority (61.56%) coming from referrals from elonphoenix.com. The top five pages viewed were related to photos, students, events, and alumni. Most traffic came from North Carolina (52.68%), with the majority from the city of Elon College. Over 80% of visits were from new visitors.
Estatísticas analisadas do Blog do Torcedor (www.blogdotorcedor.com.br), de 2...Jamildo Melo
This document summarizes analytics data for the website www.blogdotorcedor.com.br between October 29, 2008 and April 29, 2009. Some key findings include:
- The site had 404,371 visitors over this period with 2,894,871 total visits and 4,137,711 pageviews.
- The majority of traffic came from Brazil, with over 2.7 million visits, and other top countries included the US, Portugal, Canada, and Spain.
- The most visited page was the main page at /blogs/blogdotorcedor/ which received over 2.3 million views alone.
Analytics e baske_tsk_201106_(visitorsoverviewreport)OneClick
According to the site analytics for June 1-30, 2011:
1) There were 114,080 total visits from 24,701 unique visitors who viewed 315,638 pages.
2) The average time on site was 5 minutes and 2 seconds with a 41.23% bounce rate and 13.54% of visits being new.
3) Firefox, Internet Explorer, and Chrome were the most commonly used browsers, accounting for over 80% of visits.
Analytics e baske_tsk_201104_(visitorsoverviewreport)OneClick
Visitors to the site fluctuated between around 4,000 and 8,000 over the month of April 2011. There were a total of 43,296 unique visitors who made 192,328 visits and viewed 707,018 pages with an average of 3.68 pages per visit. Visitors spent an average of 00:07:05 on the site and 30.82% bounced without viewing additional pages. Firefox was the most commonly used browser, accounting for 38.95% of visits.
The document is a report from Google Analytics summarizing website traffic and usage for affluentmagazine.com over two periods: October 17, 2010 - November 16, 2010 and September 16, 2010 - October 16, 2010. Key findings include a 56.37% increase in visits, higher bounce rates and shorter average time on site compared to the previous period, and traffic primarily from search engines and direct visits. The United States was the top country for traffic.
The document summarizes website analytics data for affluentmagazine.com from October 17, 2010 to November 16, 2010 and compares it to the previous period. There was an increase in visits, unique visitors, pageviews, and traffic from search engines. However, bounce rate and percentage of new visits increased while average time on site and pages per visit decreased.
Analytics e baske_tsk_201109_(visitorsoverviewreport)OneClick
The document is a report from Google Analytics summarizing website traffic for a site between September 1-30, 2011. It shows that there were 22,289 visitors who made 114,941 visits to the site, viewing 248,589 pages over an average time of 4 minutes and 3 seconds. The bounce rate was 53.55% and 14.34% of visits were from new visitors. Firefox was the most commonly used browser, accounting for 35.91% of visits.
Estatísticas analisadas do Blog do Torcedor (www.blogdotorcedor.com.br), de 2...Blog do Torcedor/JC Online
This document summarizes analytics data for the website www.blogdotorcedor.com.br from October 28, 2008 to April 28, 2009. Some key findings include:
- There were over 2.8 million visits and 4.1 million pageviews during this period.
- The majority of traffic (42%) came from referring sites like google and jc.uol.com.br, while 39% was direct and 18% from search engines.
- The top page was /blogs/blogdotorcedor/ which received over 2.3 million views alone, accounting for 57% of all pageviews.
Visitors to the site fluctuated between 4,000 and 8,000 over the month of March 2011. In total, there were 46,214 unique visitors who made 223,590 visits and viewed 878,236 pages with an average time on site of 8 minutes and 3 seconds and a bounce rate of 32.29%. Firefox was the most commonly used browser, accounting for 39.53% of visits.
This summary analyzes web traffic to a government website from October 1, 2010 to December 31, 2010. It shows that the site received 5,738 visits from 2,499 unique visitors over this period. The bounce rate was 36.18% and 34.09% of visits were single page sessions. The top performing pages were /Home.aspx, /home.aspx, and /ProductPage.aspx.
Digital: The bare minimum you need to know to sound like you know what you’re...Mark Congiusta
This document provides an overview of digital marketing basics. It covers technology platforms and browsers, image formats and resolution, websites, display ads, and interactive production. Key terms are defined for HTML, CSS, SEO, analytics, and more. Website technologies like PHP, ASP, and databases are explained. Display ad formats, dimensions, and how to read a media plan are also reviewed.
Analytics e baske_tsk_201107_(visitorsoverviewreport)OneClick
Visitors to the site increased from July 4th to July 25th, peaking at around 3,000 visitors per day. Over the month there were 25,966 unique visitors who made 107,347 visits and viewed 271,425 pages with an average of 2.53 pages per visit. Visitors spent on average 4 minutes and 19 seconds on the site with a bounce rate of 47.58% and 16.54% of visits being from new visitors. Firefox was the most commonly used browser for visiting the site, accounting for 36.41% of visits.
Travelwires.com Google Analytics ReportBlogatize.net
This document summarizes website analytics for travelwires.com from November 6, 2009 to December 6, 2009. It shows that the site received 18,361 visits from 159 countries, with most visits coming from South Africa (11,010 visits). Pages on the site received a total of 28,992 pageviews, with the top page being /wp/ which received 2,203 views. The average time on site was 1 minute 31 seconds and the bounce rate was 76.23%.
The website www.runmx.com received 82,559 visits from May 16 to June 15, 2011. The majority of traffic, 76.26%, came from search engines like Google and Bing. Mexico accounted for the largest number of visits at 63,880. Users from Mexico averaged 6.92 pages per visit and spent 3 minutes and 41 seconds on the site. The overall bounce rate was 23.7% and 60.91% of visits were from new users.
Facebook has seen significant growth across Central and Eastern European (CEE) countries. The number of Facebook users in Poland, Russia, and other CEE nations has increased substantially. Facebook impressions now account for a large percentage of total online impressions in some CEE countries like Serbia, where Facebook impressions make up 39% of all impressions. Most Facebook users in CEE are between the ages of 18-34. Brands have found success on Facebook in CEE by launching fan pages and running ads to gain fans.
The document provides analytics data for the website www.tashy.ro from December 1-31, 2009. Some key details:
- There were 87,204 visits and 61,196 unique visitors to the site.
- The top traffic source was Google organic search (69.97% of visits).
- The top page was /partiale-exit-poll-uri-alegeri-prezidentiale-2009-%E2%80%93- which received 22.98% of pageviews.
- The site had a 70.53% bounce rate and visitors spent an average of 3 minutes and 4 seconds on site.
Similar to Analytics Forum Ibm 20090810 20090909 (Dashboard Report) (20)
Conversational agents, or chatbots, are increasingly used to access all sorts of services using natural language. While open-domain chatbots - like ChatGPT - can converse on any topic, task-oriented chatbots - the focus of this paper - are designed for specific tasks, like booking a flight, obtaining customer support, or setting an appointment. Like any other software, task-oriented chatbots need to be properly tested, usually by defining and executing test scenarios (i.e., sequences of user-chatbot interactions). However, there is currently a lack of methods to quantify the completeness and strength of such test scenarios, which can lead to low-quality tests, and hence to buggy chatbots.
To fill this gap, we propose adapting mutation testing (MuT) for task-oriented chatbots. To this end, we introduce a set of mutation operators that emulate faults in chatbot designs, an architecture that enables MuT on chatbots built using heterogeneous technologies, and a practical realisation as an Eclipse plugin. Moreover, we evaluate the applicability, effectiveness and efficiency of our approach on open-source chatbots, with promising results.
What is an RPA CoE? Session 1 – CoE VisionDianaGray10
In the first session, we will review the organization's vision and how this has an impact on the COE Structure.
Topics covered:
• The role of a steering committee
• How do the organization’s priorities determine CoE Structure?
Speaker:
Chris Bolin, Senior Intelligent Automation Architect Anika Systems
ScyllaDB is making a major architecture shift. We’re moving from vNode replication to tablets – fragments of tables that are distributed independently, enabling dynamic data distribution and extreme elasticity. In this keynote, ScyllaDB co-founder and CTO Avi Kivity explains the reason for this shift, provides a look at the implementation and roadmap, and shares how this shift benefits ScyllaDB users.
In our second session, we shall learn all about the main features and fundamentals of UiPath Studio that enable us to use the building blocks for any automation project.
📕 Detailed agenda:
Variables and Datatypes
Workflow Layouts
Arguments
Control Flows and Loops
Conditional Statements
💻 Extra training through UiPath Academy:
Variables, Constants, and Arguments in Studio
Control Flow in Studio
"Frontline Battles with DDoS: Best practices and Lessons Learned", Igor IvaniukFwdays
At this talk we will discuss DDoS protection tools and best practices, discuss network architectures and what AWS has to offer. Also, we will look into one of the largest DDoS attacks on Ukrainian infrastructure that happened in February 2022. We'll see, what techniques helped to keep the web resources available for Ukrainians and how AWS improved DDoS protection for all customers based on Ukraine experience
[OReilly Superstream] Occupy the Space: A grassroots guide to engineering (an...Jason Yip
The typical problem in product engineering is not bad strategy, so much as “no strategy”. This leads to confusion, lack of motivation, and incoherent action. The next time you look for a strategy and find an empty space, instead of waiting for it to be filled, I will show you how to fill it in yourself. If you’re wrong, it forces a correction. If you’re right, it helps create focus. I’ll share how I’ve approached this in the past, both what works and lessons for what didn’t work so well.
AI in the Workplace Reskilling, Upskilling, and Future Work.pptxSunil Jagani
Discover how AI is transforming the workplace and learn strategies for reskilling and upskilling employees to stay ahead. This comprehensive guide covers the impact of AI on jobs, essential skills for the future, and successful case studies from industry leaders. Embrace AI-driven changes, foster continuous learning, and build a future-ready workforce.
Read More - https://bit.ly/3VKly70
The Microsoft 365 Migration Tutorial For Beginner.pptxoperationspcvita
This presentation will help you understand the power of Microsoft 365. However, we have mentioned every productivity app included in Office 365. Additionally, we have suggested the migration situation related to Office 365 and how we can help you.
You can also read: https://www.systoolsgroup.com/updates/office-365-tenant-to-tenant-migration-step-by-step-complete-guide/
LF Energy Webinar: Carbon Data Specifications: Mechanisms to Improve Data Acc...DanBrown980551
This LF Energy webinar took place June 20, 2024. It featured:
-Alex Thornton, LF Energy
-Hallie Cramer, Google
-Daniel Roesler, UtilityAPI
-Henry Richardson, WattTime
In response to the urgency and scale required to effectively address climate change, open source solutions offer significant potential for driving innovation and progress. Currently, there is a growing demand for standardization and interoperability in energy data and modeling. Open source standards and specifications within the energy sector can also alleviate challenges associated with data fragmentation, transparency, and accessibility. At the same time, it is crucial to consider privacy and security concerns throughout the development of open source platforms.
This webinar will delve into the motivations behind establishing LF Energy’s Carbon Data Specification Consortium. It will provide an overview of the draft specifications and the ongoing progress made by the respective working groups.
Three primary specifications will be discussed:
-Discovery and client registration, emphasizing transparent processes and secure and private access
-Customer data, centering around customer tariffs, bills, energy usage, and full consumption disclosure
-Power systems data, focusing on grid data, inclusive of transmission and distribution networks, generation, intergrid power flows, and market settlement data
Getting the Most Out of ScyllaDB Monitoring: ShareChat's TipsScyllaDB
ScyllaDB monitoring provides a lot of useful information. But sometimes it’s not easy to find the root of the problem if something is wrong or even estimate the remaining capacity by the load on the cluster. This talk shares our team's practical tips on: 1) How to find the root of the problem by metrics if ScyllaDB is slow 2) How to interpret the load and plan capacity for the future 3) Compaction strategies and how to choose the right one 4) Important metrics which aren’t available in the default monitoring setup.
What is an RPA CoE? Session 2 – CoE RolesDianaGray10
In this session, we will review the players involved in the CoE and how each role impacts opportunities.
Topics covered:
• What roles are essential?
• What place in the automation journey does each role play?
Speaker:
Chris Bolin, Senior Intelligent Automation Architect Anika Systems
GlobalLogic Java Community Webinar #18 “How to Improve Web Application Perfor...GlobalLogic Ukraine
Під час доповіді відповімо на питання, навіщо потрібно підвищувати продуктивність аплікації і які є найефективніші способи для цього. А також поговоримо про те, що таке кеш, які його види бувають та, основне — як знайти performance bottleneck?
Відео та деталі заходу: https://bit.ly/45tILxj
"What does it really mean for your system to be available, or how to define w...Fwdays
We will talk about system monitoring from a few different angles. We will start by covering the basics, then discuss SLOs, how to define them, and why understanding the business well is crucial for success in this exercise.
This talk will cover ScyllaDB Architecture from the cluster-level view and zoom in on data distribution and internal node architecture. In the process, we will learn the secret sauce used to get ScyllaDB's high availability and superior performance. We will also touch on the upcoming changes to ScyllaDB architecture, moving to strongly consistent metadata and tablets.
QA or the Highway - Component Testing: Bridging the gap between frontend appl...zjhamm304
These are the slides for the presentation, "Component Testing: Bridging the gap between frontend applications" that was presented at QA or the Highway 2024 in Columbus, OH by Zachary Hamm.
Must Know Postgres Extension for DBA and Developer during MigrationMydbops
Mydbops Opensource Database Meetup 16
Topic: Must-Know PostgreSQL Extensions for Developers and DBAs During Migration
Speaker: Deepak Mahto, Founder of DataCloudGaze Consulting
Date & Time: 8th June | 10 AM - 1 PM IST
Venue: Bangalore International Centre, Bangalore
Abstract: Discover how PostgreSQL extensions can be your secret weapon! This talk explores how key extensions enhance database capabilities and streamline the migration process for users moving from other relational databases like Oracle.
Key Takeaways:
* Learn about crucial extensions like oracle_fdw, pgtt, and pg_audit that ease migration complexities.
* Gain valuable strategies for implementing these extensions in PostgreSQL to achieve license freedom.
* Discover how these key extensions can empower both developers and DBAs during the migration process.
* Don't miss this chance to gain practical knowledge from an industry expert and stay updated on the latest open-source database trends.
Mydbops Managed Services specializes in taking the pain out of database management while optimizing performance. Since 2015, we have been providing top-notch support and assistance for the top three open-source databases: MySQL, MongoDB, and PostgreSQL.
Our team offers a wide range of services, including assistance, support, consulting, 24/7 operations, and expertise in all relevant technologies. We help organizations improve their database's performance, scalability, efficiency, and availability.
Contact us: info@mydbops.com
Visit: https://www.mydbops.com/
Follow us on LinkedIn: https://in.linkedin.com/company/mydbops
For more details and updates, please follow up the below links.
Meetup Page : https://www.meetup.com/mydbops-databa...
Twitter: https://twitter.com/mydbopsofficial
Blogs: https://www.mydbops.com/blog/
Facebook(Meta): https://www.facebook.com/mydbops/
3. Forum IBM Aug 10, 2009 - Sep 9, 2009
Visitors Overview Comparing to: Site
Visitors
200 200
100 100
August 10, 2009 August 17, 2009 August 24, 2009 August 31, 2009 September 7, 2009
2,943 people visited this site
7,343 Visits
2,943 Absolute Unique Visitors
43,638 Pageviews
5.94 Average Pageviews
00:06:06 Time on Site
32.77% Bounce Rate
36.74% New Visits
Technical Profile
Browser Visits % visits Connection Speed Visits % visits
Firefox 4,599 62.63% Unknown 4,071 55.44%
Internet Explorer 1,642 22.36% DSL 2,757 37.55%
Chrome 702 9.56% Cable 318 4.33%
Opera 214 2.91% Dialup 123 1.68%
Opera Mini 67 0.91% T1 69 0.94%
3 Google Analytics
4. Forum IBM Aug 10, 2009 - Sep 9, 2009
Traffic Sources Overview Comparing to: Site
Visits
400 400
200 200
August 10, 2009 August 17, 2009 August 24, 2009 August 31, 2009 September 7, 2009
All traffic sources sent a total of 7,343 visits
41.06% Direct Traffic Direct Traffic
3,015.00 (41.06%)
Search Engines
21.75% Referring Sites 2,731.00 (37.19%)
Referring Sites
1,597.00 (21.75%)
37.19% Search Engines
Top Traffic Sources
Sources Visits % visits Keywords Visits % visits
(direct) ((none)) 3,015 41.06% forum informatica biomedica 261 9.56%
google (organic) 2,686 36.58% shortliffe sao paulo 88 3.22%
mail.google.com (referral) 582 7.93% paula informática biomédica 67 2.45%
informaticabiomedica.com.br 200 2.72% rep esfirraria 62 2.27%
orkut.com.br (referral) 169 2.30% existem um aluno de cada 52 1.90%
4 Google Analytics
5. Forum IBM Aug 10, 2009 - Sep 9, 2009
Map Overlay Comparing to: Site
Visits
1 6,938
7,343 visits came from 34 countries/territories
Site Usage
Visits Pages/Visit Avg. Time on Site % New Visits Bounce Rate
7,343 5.94 00:06:06 36.78% 32.77%
% of Site Total: Site Avg: Site Avg: Site Avg: Site Avg:
100.00% 5.94 (0.00%) 00:06:06 (0.00%) 36.74% (0.11%) 32.77% (0.00%)
Country/Territory Visits Pages/Visit Avg. Time on % New Visits Bounce Rate
Site
Brazil 6,938 5.86 00:05:43 37.11% 32.88%
Netherlands 214 11.08 00:20:05 7.94% 14.49%
United States 67 3.03 00:03:49 13.43% 17.91%
Portugal 37 1.11 00:00:10 97.30% 91.89%
New Zealand 29 10.31 00:16:55 58.62% 3.45%
(not set) 8 3.50 00:03:02 0.00% 25.00%
Angola 4 1.75 00:00:12 100.00% 50.00%
Ireland 4 1.00 00:00:00 100.00% 100.00%
Japan 4 1.00 00:00:00 100.00% 100.00%
5 Google Analytics
6. Georgia 3 1.00 00:00:00 33.33% 100.00%
1 - 10 of 34
6 Google Analytics
7. Forum IBM Aug 10, 2009 - Sep 9, 2009
Content Overview Comparing to: Site
Pageviews
3,000 3,000
1,500 1,500
August 10, 2009 August 17, 2009 August 24, 2009 August 31, 2009 September 7, 2009
Pages on this site were viewed a total of 43,638 times
43,638 Pageviews
33,668 Unique Views
32.77% Bounce Rate
Top Content
Pages Pageviews % Pageviews
/infobio/forum/index.php 6,945 15.92%
/infobio/forum/search.php?search_id=newposts 6,175 14.15%
/infobio/forum/viewforum.php?f=257 700 1.60%
/infobio/forum/viewforum.php?f=144 530 1.21%
/infobio/forum/viewforum.php?f=143 422 0.97%
7 Google Analytics
8. Forum IBM
Country/Territory Detail: Aug 10, 2009 - Sep 9, 2009
Brazil Comparing to: Site
Visits
1 4,104
This country/territory sent 6,938 visits via 141 cities
Site Usage
Visits Pages/Visit Avg. Time on Site % New Visits Bounce Rate
6,938 5.86 00:05:43 37.11% 32.88%
% of Site Total: Site Avg: Site Avg: Site Avg: Site Avg:
94.48% 5.94 (-1.44%) 00:06:06 (-6.20%) 36.74% (1.01%) 32.77% (0.34%)
City Visits Pages/Visit Avg. Time on % New Visits Bounce Rate
Site
Ribeirao Preto 4,104 6.88 00:06:25 22.54% 18.23%
Sao Paulo 1,272 6.23 00:08:06 33.18% 33.73%
Campinas 150 4.33 00:03:18 60.67% 57.33%
Belo Horizonte 119 1.50 00:00:36 94.12% 80.67%
Rio de Janeiro 115 1.35 00:00:26 93.91% 90.43%
Sao Carlos 93 8.48 00:04:04 45.16% 19.35%
Brasilia 63 1.24 00:01:03 92.06% 84.13%
Curitiba 56 1.14 00:00:12 98.21% 89.29%
Porto Alegre 48 1.29 00:00:33 81.25% 83.33%
8 Google Analytics
9. Franca 46 3.70 00:03:30 43.48% 26.09%
1 - 10 of 141
9 Google Analytics