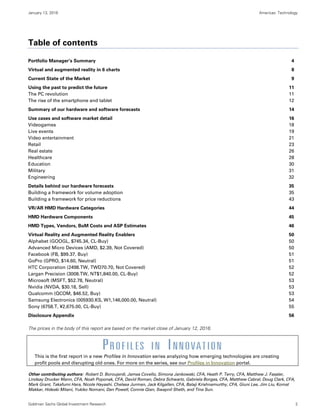
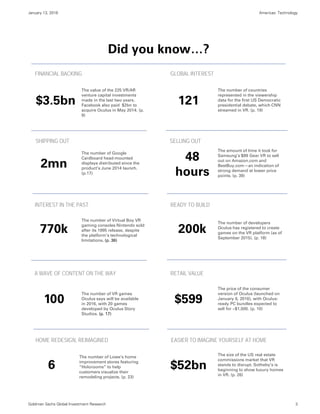
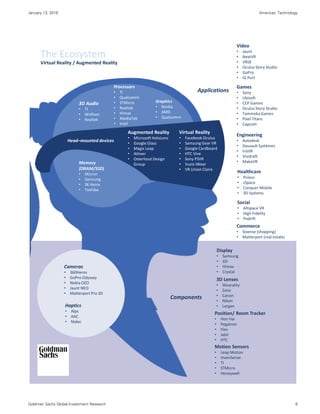
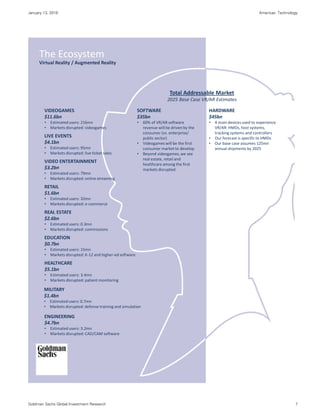
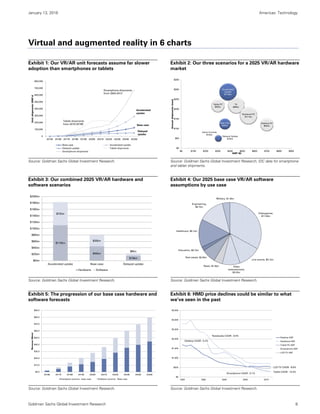
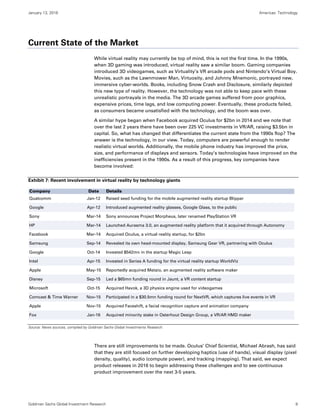
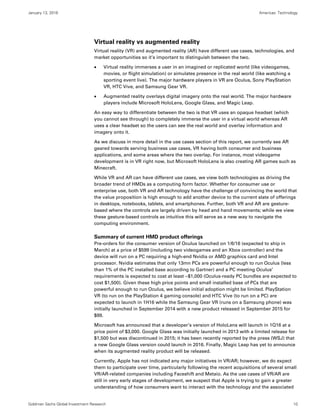
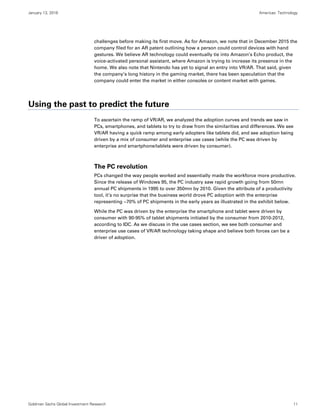
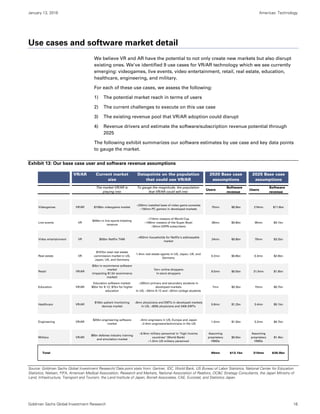
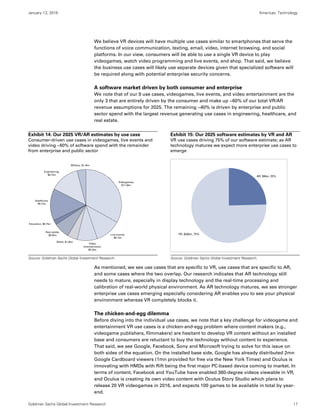
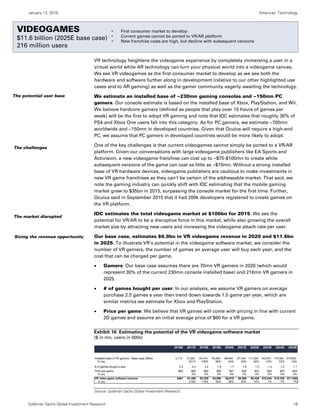
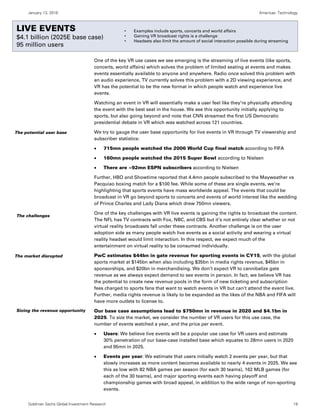
Virtual and augmented
reality have the potential
to become the next big
computing platform. All
around us are examples of
where VR (which
immerses the user in a
virtual world) and AR
(which overlays digital
information onto the
physical world) can
reshape existing ways of
doing things – from buying
a new home to interacting
with a doctor or watching
a concert. In the first of a
new Profiles in Innovation
series, we examine what
VR/AR could become, the
evolving use cases and
the markets that could be
created and disrupted.
Heather Bellini, CFA
(212) 357-7710
heather.bellini@gs.com
Goldman, Sachs & Co.
Goldman Sachs does and seeks to do business with companies covered in its research reports. As a
result, investors should be aware that the firm may have a conflict of interest that could affect the
objectivity of this report. Investors should consider this report as only a single factor in making their
investment decision. For Reg AC certification and other important disclosures, see the Disclosure
Appendix, or go to www.gs.com/research/hedge.html. Analysts employed by non-US affiliates are not
registered/qualified as research analysts with FINRA in the U.S.
The Goldman Sachs Group, Inc.
EQUITY RESEARCH | January 13, 2016
Understanding the race for the next computing platform
PROFILES IN INNOVATIONVirtual & Augmented Reality
Wei Chen
+886(2)2730-4185
wei.chen@gs.com
Goldman Sachs (Asia) L.L.C., Taipei Branch
Masaru Sugiyama
+81(3)6437-4691
masaru.sugiyama@gs.com
Goldman Sachs Japan Co., Ltd.
Marcus Shin
+82(2)3788-1154
marcus.shin@gs.com
Goldman Sachs (Asia) L.L.C., Seoul Branch
Shateel Alam
(212) 902-6785
shateel.alam@gs.com
Goldman, Sachs & Co.
DaikiTakayama
+81(3)6437-9870
daiki.takayama@gs.com
Goldman Sachs Japan Co., Ltd.
January 13, 2016 Americas: Technology
Goldman Sachs Global Investment Research 2
Table of contents
Portfolio Manager’s Summary 4
Virtual and augmented reality in 6 charts 8
Current State of the Market 9
Using the past to predict the future 11
The PC revolution 11
The rise of the smartphone and tablet 12
Summary of our hardware and software forecasts 14
Use cases and software market detail 16
Videogames 18
Live events 19
Video entertainment 21
Retail 23
Real estate 26
Healthcare 28
Education 30
Military 31
Engineering 32
Details behind our hardware forecasts 35
Building a framework for volume adoption 35
Building a framework for price reductions 43
VR/AR HMD Hardware Categories 44
HMD Hardware Components 45
HMD Types, Vendors, BoM Costs and ASP Estimates 46
Virtual Reality and Augmented Reality Enablers 50
Alphabet (GOOGL, $745.34, CL-Buy) 50
Advanced Micro Devices (AMD, $2.39, Not Covered) 50
Facebook (FB, $99.37, Buy) 51
GoPro (GPRO, $14.60, Neutral) 51
HTC Corporation (2498.TW, TWD70.70, Not Covered) 52
Largan Precision (3008.TW, NT$1,840.00, CL-Buy) 52
Microsoft (MSFT, $52.78, Neutral) 53
Nvidia (NVDA, $30.18, Sell) 53
Qualcomm (QCOM, $46.52, Buy) 53
Samsung Electronics (005930.KS, W1,146,000.00, Neutral) 54
Sony (6758.T, ¥2,675.00, CL-Buy) 55
Disclosure Appendix 56
The prices in the body of this report are based on the market close of January 12, 2016.
This is the first report in a new Profiles in Innovation series analyzing how emerging technologies are creating
profit pools and disrupting old ones. For more on the series, see our Profiles in Innovation portal.
Other contributing authors: Robert D. Boroujerdi, James Covello, Simona Jankowski, CFA, Heath P. Terry, CFA, Matthew J. Fassler,
Lindsay Drucker Mann, CFA, Noah Poponak, CFA, David Roman, Debra Schwartz, Gabriela Borges, CFA, Matthew Cabral, Doug Clark, CFA,
Mark Grant, Takafumi Hara, Nicole Hayashi, Chelsea Jurman, Jack Kilgallen, CFA, Balaji Krishnamurthy, CFA, Giuni Lee, Jim Liu, Komal
Makkar, Hideaki Mitani, Yukiko Nomani, Dan Powell, Connie Qian, Swapnil Sheth, and Tina Sun.
January 13, 2016 Americas: Technology
Goldman Sachs Global Investment Research 3
Did you know…?
The value of the 225 VR/AR
venture capital investments
made in the last two years.
Facebook also paid $2bn to
acquire Oculus in May 2014. (p.
9)
FINANCIAL BACKING
$3.5bn
The price of the consumer
version of Oculus (launched on
January 6, 2016), with Oculus-
ready PC bundles expected to
sell for ~$1,500. (p. 10)
A WAVE OF CONTENT ON THE WAY
The number of VR games
Oculus says will be available
in 2016, with 20 games
developed by Oculus Story
Studios. (p. 17)
100
GLOBAL INTEREST
121
The number of countries
represented in the viewership
data for the first US Democratic
presidential debate, which CNN
streamed in VR. (p. 19)
The number of Google
Cardboard head-mounted
displays distributed since the
product’s June 2014 launch.
(p.17)
SHIPPING OUT
48
hours
SELLING OUT
The amount of time it took for
Samsung’s $99 Gear VR to sell
out on Amazon.com and
BestBuy.com—an indication of
strong demand at lower price
points. (p. 39)
2mn
RETAIL VALUE
$599
The number of Virtual Boy VR
gaming consoles Nintendo sold
after its 1995 release, despite
the platform’s technological
limitations. (p. 36)
770k
INTEREST IN THE PAST READY TO BUILD
The number of developers
Oculus has registered to create
games on the VR platform (as of
September 2015). (p. 18)
200k
HOME REDESIGN, REIMAGINED
The size of the US real estate
commissions market that VR
stands to disrupt. Sotheby’s is
beginning to show luxury homes
in VR. (p. 26)
6
The number of Lowe’s home
improvement stores featuring
“Holorooms” to help
customers visualize their
remodeling projects. (p. 23)
$52bn
EASIER TO IMAGINE YOURSELF AT HOME
January 13, 2016 Americas: Technology
Goldman Sachs Global Investment Research 4
Portfolio Manager’s Summary
Virtual reality (VR) and augmented reality (AR) have the potential to become the next
big computing platform, and as we saw with the PC and smartphone, we expect new
markets to be created and existing markets to be disrupted. There’s no shortage of
examples of how VR and AR can reshape existing ways of doing things– from buying a
new home, interacting with a doctor, or watching a football game. As the technology
advances, price points decline, and an entire new marketplace of applications (both
business and consumer) hit the market, we believe VR/AR has the potential to spawn a
multibillion-dollar industry, and possibly be as game changing as the advent of the PC.
This report aims to show what VR/AR could become, the evolving use cases, the potential
market disruption, and the challenge of moving from science fiction to widespread
adoption. We see both VR (which immerses the user in a virtual world) and AR (which
overlays digital information onto the physical world) as driving a trend towards the
adoption of head-mounted-devices (HMDs) as a new computing form factor.
Given that VR/AR technology is still in the early stages of development, we’ve
outlined three scenarios for hardware and software uptake over the next decade. In
our base case, we estimate $80bn in revenue by 2025 ($45bn in hardware, $35bn in
software) and assume that HMDs gain popularity as technology improves, but adoption is
limited by mobility and battery life. Our “accelerated uptake” scenario predicts a $182bn
market ($110bn in hardware, $72bn in software), where VR/AR technology evolves from a
niche device to a broader computing platform. In our $23bn “delayed uptake” scenario
($15bn in hardware, $8bn in software) we assume VR/AR sees challenges in latency,
display, safety and privacy, and the technology is used primarily for videogames. These
forecasts compare with the current hardware markets for notebooks at $111bn, desktops at
$62bn, and videogame consoles at $14bn.
We’ve outlined 9 use cases for VR/AR which we see as the most meaningful drivers
of the market in the near-term: videogames, live events, video entertainment, healthcare,
real estate, retail, education, engineering, and military. We lay out case studies of vendors
implementing VR/AR today, including Volvo using Microsoft HoloLens to sell cars, NextVR
streaming live sports, and Atheer developing smart glasses for deskless professionals
including doctors and EMTs. We conducted a bottom-up analysis to arrive at estimates for
the potential market in each use case, assessing the number of users and the existing and
potential revenue pools. While the videogame use case will likely take center stage in 2016,
we see use cases in areas like healthcare and education evolving to help drive VR/AR
awareness. The enterprise was the driver of the PC and the consumer was the driver of the
smartphone, but we see both forces at work to drive VR/AR adoption, with consumer use
cases driving the momentum in the beginning. In 2025, our base case software estimates
imply that 60% of VR/AR software revenue is driven by the consumer while the remainder
is supported by enterprise and public sector use cases.
Looking beyond videogames, we see real estate, retail, and healthcare among the
first markets that VR/AR disrupts. VR/AR technology has the potential to change
business models and the ways in which we transact. Sotheby’s is beginning to show luxury
homes in VR, which has potential to disrupt a $52bn US real estate commissions market
(derived with data from the National Association of Realtors). Lowes has equipped 6 of its
stores with “Holorooms” to help customers envision their home remodeling plans and
garner a competitive advantage in the $180bn US home improvement market. VR/AR
technology could also reduce the need for in-store display inventory and potentially
accelerate the erosion in value of physical stores to the extent that the viewing experience
can be deployed in the home and via mobile devices. Finally, doctors and medical
professionals are experimenting with AR as a hands-free medical tool, playing into a $16bn
patient monitoring devices market.
Our base case is
an $80bn VR/AR
industry by
2025 (p. 14)
See our profiles
of 7 vendors
applying VR/AR
to separate use
cases (pp. 20-34)
January 13, 2016 Americas: Technology
Goldman Sachs Global Investment Research 5
We view the user experience, technology constraints, the development of content
and applications, and price as key hurdles to adoption. We believe the user experience
will be the most important factor and expect technology advancements to reduce cyber
sickness and increase mobility, expanding the use cases and pervasiveness of VR/AR. In
terms of content and applications, we see a chicken-and-egg issue where content and app
developers are cautious to make investments in VR/AR without an installed base, while at
the same time, consumers and enterprises are hesitant to buy VR/AR hardware without a
strong supply of content and apps. We see Facebook, Google, Sony, and Microsoft driving
both sides of this equation over time by supplying hardware and content/software. Finally,
with the retail price of Oculus at $599 and Oculus-ready PC bundles costing ~$1,500, we
believe price points need to decline to see wider adoption.
We believe VR/AR HMDs could experience similar cost reduction curves as we have
seen on PCs and smartphones, with prices falling 5-10% annually. In our BoM (bill-of-
materials) analysis, we found VR/AR HMDs contain components that highly overlap those
of smartphones, such as display, motion sensors, processors, storage/memory and
wireless connection. That said, there are also components unique to VR/AR devices such as
3D lenses and position tracking systems which currently drive the price up. We expect
major VR players such as Oculus, HTC and Sony to price their HMDs in line with their BoMs
($350-500) to drive user adoption. Looking forward, we expect BoM costs to decline with
economies of scale, which would enable HMD makers to either reduce their selling prices
to take more market share or maintain their ASPs to earn more profits, depending on their
targeted market segments and pricing strategies.
At this stage, we have greater conviction in the relative success of VR versus AR
given VR’s technological progress and momentum, and the early formation of an
ecosystem of vendors and partners. Our base case software scenario is driven 75% by
VR use cases vs 25% for AR use cases. While we believe both VR and AR need to advance
technologically, we see AR as having more significant hurdles to overcome, including
challenges in display technology and the real-time processing and calibration of the real-
world physical environment. That said, as AR technology matures, we see stronger
enterprise use cases emerging, especially considering AR enables you to see your physical
environment whereas VR completely blocks it.
Where could this go? We see qualities in VR/AR technology that can take this from niche
use cases to a device as ubiquitous as the smartphone. Part of the mass appeal of
smartphones is their ease of use with a touch screen interface; VR/AR technology has the
potential to take this level of intuition to the next stage as the controls are driven by
gestures and the interface is in 3D. Technology can often start with narrow use cases and
evolve into broader platforms. For example, the iPod dominated in the music industry,
cellular technology was added to it, and the device evolved into the iPhone. Soon after,
third-party applications began to run on smartphones, creating a new market for business
and consumer applications. In the long run, if VR/AR technology becomes as lightweight as
a set of glasses, we see the potential for the evolution to be similar where multiple devices
are combined into one, potentially replacing phones and PC environments.
In terms of tech stocks, we highlight companies that are positioning themselves ahead the
VR/AR trend, including Alphabet, AMD, Facebook, GoPro, HTC, Largan Precision,
Microsoft, Nvidia, Qualcomm, Samsung, and Sony.
We estimate bill-
of-materials
costs and
average selling
prices for the
major HMD
vendors (p. 46)
January 13, 2016 Americas: Technology
Goldman Sachs Global Investment Research 6
Graphics
• Nvidia
• AMD
• Qualcomm
Augmented Reality
• Microsoft HoloLens
• Google Glass
• Magic Leap
• Atheer
• Osterhout Design
Group
Virtual Reality
• Facebook Oculus
• Samsung Gear VR
• Google Cardboard
• HTC Vive
• Sony PSVR
• Vuzix iWear
• VR Union Claire
Processors
• TI
• Qualcomm
• STMicro
• Realtek
• Himax
• MediaTek
• Intel
Head–mounted devices
Video
• Jaunt
• NextVR
• VRSE
• Oculus Story Studio
• GoPro
• IG Port
Games
• Sony
• Ubisoft
• CCP Games
• Oculus Story Studio
• Tammeka Games
• Pixel Titans
• Capcom
Social
• Altspace VR
• High Fidelity
• Podrift
Engineering
• Autodesk
• Dassault Systèmes
• IrisVR
• Visidraft
• MakeVR
Healthcare
• Psious
• zSpace
• Conquer Mobile
• 3D Systems
Commerce
• Sixense {shopping}
• Matterport {real estate}
Applications
Display
• Samsung
• JDI
• Himax
• Crystal
3D Audio
• TI
• Wolfson
• Realtek
Memory
(DRAM/SSD)
• Micron
• Samsung
• SK Hynix
• Toshiba
Position/ Room Tracker
• Hon Hai
• Pegatron
• Flex
• Jabil
• HTC
Haptics
• Alps
• AAC
• Nidec
Motion Sensors
• Leap Motion
• InvenSense
• TI
• STMicro
• Honeywell
Cameras
• 360Heros
• GoPro Odyssey
• Nokia OZO
• Jaunt NEO
• Matterport Pro 3D
3D Lenses
• Wearality
• Zeiss
• Canon
• Nikon
• Largan
Components
The Ecosystem
Virtual Reality / Augmented Reality
January 13, 2016 Americas: Technology
Goldman Sachs Global Investment Research 7
VIDEOGAMES
$11.6bn
• Estimated users: 216mn
• Markets disrupted: videogames
SOFTWARE
$35bn
• 60% of VR/AR software
revenue will be driven by the
consumer (vs. enterprise/
public sector)
• Videogames will be the first
consumer market to develop
• Beyond videogames, we see
real estate, retail and
healthcare among the first
markets disrupted
HARDWARE
$45bn
• 4 main devices used to experience
VR/AR: HMDs, host systems,
tracking systems and controllers
• Our forecast is specific to HMDs
• Our base case assumes 125mn
annual shipments by 2025
LIVE EVENTS
$4.1bn
• Estimated users: 95mn
• Markets disrupted: live ticket sales
VIDEO ENTERTAINMENT
$3.2bn
• Estimated users: 79mn
• Markets disrupted: online streaming
RETAIL
$1.6bn
• Estimated users: 32mn
• Markets disrupted: e-commerce
REAL ESTATE
$2.6bn
• Estimated users: 0.3mn
• Markets disrupted: commissions
EDUCATION
$0.7bn
• Estimated users: 15mn
• Markets disrupted: K-12 and higher-ed software
HEALTHCARE
$5.1bn
• Estimated users: 3.4mn
• Markets disrupted: patient monitoring
MILITARY
$1.4bn
• Estimated users: 0.7mn
• Markets disrupted: defense training and simulation
Total Addressable Market
2025 Base Case VR/AR Estimates
The Ecosystem
Virtual Reality / Augmented Reality
ENGINEERING
$4.7bn
• Estimated users: 3.2mn
• Markets disrupted: CAD/CAM software
January 13, 2016 Americas: Technology
Goldman Sachs Global Investment Research 8
Virtual and augmented reality in 6 charts
Exhibit 1: Our VR/AR unit forecasts assume far slower
adoption than smartphones or tablets
Exhibit 2: Our three scenarios for a 2025 VR/AR hardware
market
Source: Goldman Sachs Global Investment Research. Source: Goldman Sachs Global Investment Research, IDC data for smartphone
and tablet shipments.
Exhibit 3: Our combined 2025 VR/AR hardware and
software scenarios
Exhibit 4: Our 2025 base case VR/AR software
assumptions by use case
Source: Goldman Sachs Global Investment Research. Source: Goldman Sachs Global Investment Research.
Exhibit 5: The progression of our base case hardware and
software forecasts
Exhibit 6: HMD price declines could be similar to what
we’ve seen in the past
Source: Goldman Sachs Global Investment Research. Source: Goldman Sachs Global Investment Research.
0
100,000
200,000
300,000
400,000
500,000
600,000
700,000
800,000
2015E 2016E 2017E 2018E 2019E 2020E 2021E 2022E 2023E 2024E 2025E
Unitshipments(000's)
Base case Accelerated uptake
Delayed uptake Tablet shipments
Smartphone shipments
Tablet shipments
from 2010-2016E
Smartphone shipments
from 2004-2012
Accelerated
uptake
Base case
Delayed
uptake
TV
$99bn
Notebook PC
$111bn
Desktop PC
$62bn
Tablet PC
$63bn
Game Console
$14bn
Accelerated
Uptake
$110bn
Base Case
$45bn
Delayed Uptake
$15bn
$0
$50
$100
$150
$200
$250
$300
$350
$0 $100 $200 $300 $400 $500 $600 $700 $800 $900
Annualshipments(mns)
ASP ($)
$110bn
$45bn
$15bn
$72bn
$35bn
$8bn
$0bn
$20bn
$40bn
$60bn
$80bn
$100bn
$120bn
$140bn
$160bn
$180bn
$200bn
Accelerated uptake Base case Delayed uptake
Hardware Software
Videogames,
$11.6bn
Live events, $4.1bn
Video
entertainment,
$3.2bn
Retail, $1.6bn
Real estate, $2.6bn
Education, $0.7bn
Healthcare, $5.1bn
Engineering,
$4.7bn
Military, $1.4bn
$0.0
$10.0
$20.0
$30.0
$40.0
$50.0
$60.0
$70.0
$80.0
$90.0
2016E 2017E 2018E 2019E 2020E 2021E 2022E 2023E 2024E 2025E
Revenue($bns)
Hardware revenue - base case Software revenue - Base case
$0
$500
$1,000
$1,500
$2,000
$2,500
$3,000
$3,500
1994 1999 2004 2009 2014
Desktop ASP
Notebook ASP
Tablet PC ASP
Smartphone ASP
LCD-TV ASP
Notebooks CAGR: -6.5%
Desktop CAGR: -5.2%
Tablet CAGR: -13.4%
Smartphone CAGR: -5.1%
LCD-TV CAGR: -8.6%
January 13, 2016 Americas: Technology
Goldman Sachs Global Investment Research 9
Current State of the Market
While virtual reality may currently be top of mind, this is not the first time. In the 1990s,
when 3D gaming was introduced, virtual reality saw a similar boom. Gaming companies
introduced 3D videogames, such as Virtuality’s VR arcade pods and Nintendo’s Virtual Boy.
Movies, such as the Lawnmower Man, Virtuosity, and Johnny Mnemonic, portrayed new,
immersive cyber-worlds. Books, including Snow Crash and Disclosure, similarly depicted
this new type of reality. However, the technology was not able to keep pace with these
unrealistic portrayals in the media. The 3D arcade games suffered from poor graphics,
expensive prices, time lags, and low computing power. Eventually, these products failed,
as consumers became unsatisfied with the technology, and the boom was over.
A similar hype began when Facebook acquired Oculus for $2bn in 2014 and we note that
over the last 2 years there have been over 225 VC investments in VR/AR, raising $3.5bn in
capital. So, what has changed that differentiates the current state from the 1990s flop? The
answer is the technology, in our view. Today, computers are powerful enough to render
realistic virtual worlds. Additionally, the mobile phone industry has improved the price,
size, and performance of displays and sensors. Today’s technologies have improved on the
inefficiencies present in the 1990s. As a result of this progress, key companies have
become involved:
Exhibit 7: Recent involvement in virtual reality by technology giants
Source: News sources, compiled by Goldman Sachs Global Investments Research.
There are still improvements to be made. Oculus’ Chief Scientist, Michael Abrash, has said
that they are still focused on further developing haptics (use of hands), visual display (pixel
density, quality), audio (compute power), and tracking (mapping). That said, we expect
product releases in 2016 to begin addressing these challenges and to see continuous
product improvement over the next 3-5 years.
Company Date Details
Qualcomm Jan-12 Raised seed funding for the mobile augmented reality startup Blippar
Google Apr-12 Introduced augmented reality glasses, Google Glass, to the public
Sony Mar-14 Sony announces Project Morpheus, later renamed PlayStation VR
HP Mar-14 Launched Aurasma 3.0, an augmented reality platform that it acquired through Autonomy
Facebook Mar-14 Acquired Oculus, a virtual reality startup, for $2bn
Samsung Sep-14 Revealed its own head-mounted display, Samsung Gear VR, partnering with Oculus
Google Oct-14 Invested $542mn in the startup Magic Leap
Intel Apr-15 Invested in Series A funding for the virtual reality startup WorldViz
Apple May-15 Reportedly acquired Metaio, an augmented reality software maker
Disney Sep-15 Led a $65mn funding round in Jaunt, a VR content startup
Microsoft Oct-15 Acquired Havok, a 3D physics engine used for videogames
Comcast & Time Warner Nov-15 Participated in a $30.5mn funding round for NextVR, which captures live events in VR
Apple Nov-15 Acquired Faceshift, a facial recognition capture and animation company
Fox Jan-16 Acquired minority stake in Osterhout Design Group, a VR/AR HMD maker
January 13, 2016 Americas: Technology
Goldman Sachs Global Investment Research 10
Virtual reality vs augmented reality
Virtual reality (VR) and augmented reality (AR) have different use cases, technologies, and
market opportunities so it’s important to distinguish between the two.
 Virtual reality immerses a user in an imagined or replicated world (like videogames,
movies, or flight simulation) or simulates presence in the real world (like watching a
sporting event live). The major hardware players in VR are Oculus, Sony PlayStation
VR, HTC Vive, and Samsung Gear VR.
 Augmented reality overlays digital imagery onto the real world. The major hardware
players include Microsoft HoloLens, Google Glass, and Magic Leap.
An easy way to differentiate between the two is that VR uses an opaque headset (which
you cannot see through) to completely immerse the user in a virtual world whereas AR
uses a clear headset so the users can see the real world and overlay information and
imagery onto it.
As we discuss in more detail in the use cases section of this report, we currently see AR
geared towards serving business use cases, VR having both consumer and business
applications, and some areas where the two overlap. For instance, most videogame
development is in VR right now, but Microsoft HoloLens is also creating AR games such as
Minecraft.
While VR and AR can have different use cases, we view both technologies as driving the
broader trend of HMDs as a computing form factor. Whether for consumer use or
enterprise use, both VR and AR technology have the challenge of convincing the world that
the value proposition is high enough to add another device to the current slate of offerings
in desktops, notebooks, tablets, and smartphones. Further, both VR and AR are gesture-
based where the controls are largely driven by head and hand movements; while we view
these gesture-based controls as intuitive this will serve as a new way to navigate the
computing environment.
Summary of current HMD product offerings
Pre-orders for the consumer version of Oculus launched on 1/6/16 (expected to ship in
March) at a price of $599 (including two videogames and an Xbox controller) and the
device will run on a PC requiring a high-end Nvidia or AMD graphics card and Intel
processor. Nvidia estimates that only 13mn PCs are powerful enough to run Oculus (less
than 1% of the PC installed base according to Gartner) and a PC meeting Oculus’
requirements is expected to cost at least ~$1,000 (Oculus-ready PC bundles are expected to
cost $1,500). Given these high price points and small installed base of PCs that are
powerful enough to run Oculus, we believe initial adoption might be limited. PlayStation
VR (to run on the PlayStation 4 gaming console) and HTC Vive (to run on a PC) are
expected to launch in 1H16 while the Samsung Gear VR (runs on a Samsung phone) was
initially launched in September 2014 with a new product released in September 2015 for
$99.
Microsoft has announced that a developer’s version of HoloLens will launch in 1Q16 at a
price point of $3,000. Google Glass was initially launched in 2013 with a limited release for
$1,500 but was discontinued in 2015; it has been recently reported by the press (WSJ) that
a new Google Glass version could launch in 2016. Finally, Magic Leap has yet to announce
when its augmented reality product will be released.
Currently, Apple has not indicated any major initiatives in VR/AR; however, we do expect
them to participate over time, particularly following the recent acquisitions of several small
VR/AR-related companies including Faceshift and Metaio. As the use cases of VR/AR are
still in very early stages of development, we suspect that Apple is trying to gain a greater
understanding of how consumers want to interact with the technology and the associated
January 13, 2016 Americas: Technology
Goldman Sachs Global Investment Research 11
challenges before making its first move. As for Amazon, we note that in December 2015 the
company filed for an AR patent outlining how a person could control devices with hand
gestures. We believe AR technology could eventually tie into Amazon’s Echo product, the
voice-activated personal assistant, where Amazon is trying to increase its presence in the
home. We also note that Nintendo has yet to signal an entry into VR/AR. That said, given
the company’s long history in the gaming market, there has been speculation that the
company could enter the market in either consoles or content market with games.
Using the past to predict the future
To ascertain the ramp of VR/AR, we analyzed the adoption curves and trends we saw in
PCs, smartphones, and tablets to try to draw from the similarities and differences. We see
VR/AR having a quick ramp among early adopters like tablets did, and see adoption being
driven by a mix of consumer and enterprise use cases (while the PC was driven by
enterprise and smartphone/tablets were driven by consumer).
The PC revolution
PCs changed the way people worked and essentially made the workforce more productive.
Since the release of Windows 95, the PC industry saw rapid growth going from 50mn
annual PC shipments in 1995 to over 350mn by 2010. Given the attribute of a productivity
tool, it’s no surprise that the business world drove PC adoption with the enterprise
representing ~70% of PC shipments in the early years as illustrated in the exhibit below.
While the PC was driven by the enterprise the smartphone and tablet were driven by
consumer with 90-95% of tablet shipments initiated by the consumer from 2010-2012,
according to IDC. As we discuss in the use cases section, we see both consumer and
enterprise use cases of VR/AR technology taking shape and believe both forces can be a
driver of adoption.
January 13, 2016 Americas: Technology
Goldman Sachs Global Investment Research 12
Exhibit 8: PCs were revolutionary and driven by enterprise as they changed the way
people work
VR/AR has both consumer and enterprise use cases developing and we see both sides driving
adoption
Source: Goldman Sachs Global Investment Research, IDC
The rise of the smartphone and tablet
To understand what the pace of VR/AR adoption could look like, we analyzed smartphone
adoption (as a function of share taken from feature phones) and tablet adoption (as a
function of share taken from notebooks). We mapped the adoption of these technologies
over Rogers’ innovation curve where the first 15% of the applicable user base are
considered to be innovators and early adopters, the next 34% are the early majority,
followed by 34% late majority, with the final 16% being the laggards. In this analysis, we
consider the percentage of unit shipments for the new technology (smartphones and
tablets) versus the total applicable base (total handsets, total notebooks + tablets) to
indicate the new technology’s point on the adoption curve. For example, in 2007, 11% of
total handset shipments were smartphones so we consider that year to still be in the early
adopter phase (the first 15%).
Overall, the adoption curve for smartphones was relatively fast as smartphones
represented 1% of total handset shipments in 2003 and the GS communications equipment
team estimates smartphones will represent 82% of handset shipments in 2016. For
smartphones, we consider the early adopter stage (the first 15%) to be from 2003-2009, the
early majority (the next 34%) to be from 2010-2012, followed by late majority (the next
34%) to be from 2013-2015, with the final 16% being the laggards (2016 and on). We
consider the 2007 launch of Apple’s iPhone a significant accelerator of smartphone
adoption as penetration began to significantly ramp after that point.
Tablets saw a quicker ramp in adoption than smartphones as the tablet was launched in
2010 and represented 27% of total tablet and notebook shipments by 2011, making its early
adopter phase just two years. That said, tablets have been hovering at 50%-60%
penetration since 2013 in the “late majority” phase.
71%
69%71%71%
69%
63%
60%
62%61%61%61%60%59%
57%
53%
46%45%46%46%
49%50%51%52%
0.0%
10.0%
20.0%
30.0%
40.0%
50.0%
60.0%
70.0%
80.0%
0
50,000
100,000
150,000
200,000
250,000
300,000
350,000
400,000
Enterprise shipments Consumer shipments % enterprise shipments
Rogers’ adoption curve:
Early adopters – the first 15% of the
applicable user base
Majority – mass adoption by the next
64% of the applicable user base
Laggards – adoption by the last 16%
of the applicable user base
January 13, 2016 Americas: Technology
Goldman Sachs Global Investment Research 13
Exhibit 9: Smartphone adoption curve
The early adoption was slow at first but quickly accelerated
due in part to the 2007 launch of the iPhone
Exhibit 10: Tablet adoption curve
Early adoption of the tablet was relatively fast, but the
majority uptake has been slow as the technology and use
cases evolve
Source: Goldman Sachs Global Investment Research, IDC Source: Goldman Sachs Global Investment Research, IDC
In comparing and contrasting the faster adoption of smartphones to the slower adoption
curve of tablets, we believe one key difference is that the smartphone can be thought of as
an enhanced version of the feature phone which built upon the functions of voice and text
messaging and added email, internet, video, and social functionality. In a sense, the
smartphone added use cases we were already familiar with from desktop computers but
made that functionality completely mobile.
The tablet, on the other hand, offers a new way to do things versus the notebook given the
touch screen functionality. We see tablets as more of an evolution of the notebook where
the use cases of the tablet are still being defined and the technology is still evolving. In this
respect, we also see VR/AR technology as an evolution in how we do things, where we
could see a quick early adopter ramp but a slowing pace as the adoption curve hits the late
majority.
The potential for VR/AR to become a generic computing platform
Looking back at the history of computer interface evolution, from command line, Windows,
to the latest touch interface, the addressable market was broadened as the user interface
became more intuitive. Twenty-five years ago, one would need to be properly trained to
use a computer with command line or programming codes, but now one can use a
smartphone/tablet without any training at all.
Fundamentally, virtual/augmented reality creates a new and even more intuitive way to
interact with a computer. In the world of virtual/augmented reality, the controls of the
computer become what we are already familiar with through gestures and graphics. VR/AR
also gives us wider field of view, where the concept of virtual desktop is no longer confined
by the size of a physical display screen on our desktop or in the palm of our hands. Given
this attribute of ease of use and the multiple use cases across VR/AR, we see the potential
for the technology to emerge from vertical specific use cases to a broader computing
platform.
0%
10%
20%
30%
40%
50%
60%
70%
80%
90%
100%
0
500,000
1,000,000
1,500,000
2,000,000
2,500,000
% smartphone penetration 
Units shipped (000s)
Smartphones Feature phones Smartphone penetration (% of total handset shipments)
The first 15% ‐ early 
adopters and innovators
The next 68% ‐
the majority
The last 16% ‐
the laggards
0%
10%
20%
30%
40%
50%
60%
70%
80%
90%
100%
0
50,000
100,000
150,000
200,000
250,000
300,000
350,000
400,000
450,000
500,000
2010 2011 2012 2013 2014 2015E 2016E
% tablet penetration 
Units shipped (000s)
Tablets Notebooks Tablet penetration (% total tablets + notebooks)
The first 15% ‐
early adopters 
and innovators
The next 68% ‐ the majority
January 13, 2016 Americas: Technology
Goldman Sachs Global Investment Research 14
Summary of our hardware and software forecasts
To arrive at the VR/AR estimates, we considered the following:
1. The use cases for VR/AR and potential addressable market in terms of users
2. A volume adoption framework which considers technology enablers to reach mass
adoption.
3. A pricing framework which projects how costs could decline over time as price
elasticity should have an impact on end demand.
In considering the use cases and addressable markets, and marrying the volume adoption
and pricing frameworks, we arrive at three outcomes in 2025 for our VR/AR hardware and
software revenue TAM at $182bn, $80bn and $23bn.
Base case scenario: $80bn market ($45bn in hardware and $35bn in software)
In our base case scenario, we are assuming that HMDs gain popularity as VR/AR
technology improves over time but is limited by mobility and battery life. Hence the use
cases would be mostly confined to stationary mobility (i.e., living room, or office space
mobility).The hardware TAM of $45bn implies a market size closer to the tablet hardware
market (~$65bn) today.
“Accelerated uptake”: $182bn market ($110bn in hardware, $72bn in software)
In this case, we are assuming that HMD evolves from a niche market device to a generic
computing platform by 2025, as the user experience of VR/AR technology improves over
time coupled with breakthroughs in cellular and battery technologies to enable true
mobility. With improving VR/AR user experience combined with true mobility, we expect
HMDs to proliferate from vertical markets to horizontal market adoption. Our $110bn
hardware estimate represents a similar market size to what we are seeing in notebooks
(~$111bn) and TV (~$99bn) today.
“Delayed uptake”: $23bn market ($15bn in hardware, $8bn in software)
In this case, we are assuming that user experience of VR/AR technology improves at a
slower pace due to hindrance in adoption from latency, display, safety, privacy and other
issues for it to have a widespread effect. As such, we estimate that VR HMDs will primarily
only succeed in the videogaming and entertainment use cases. The $15bn hardware TAM
represents a market size similar to the current game console hardware market at around
$14bn.
January 13, 2016 Americas: Technology
Goldman Sachs Global Investment Research 15
Exhibit 11: VR/AR HMD market has the potential of reach over $100bn annually by 2025
Source: Goldman Sachs Global Investment Research, IDC
The following chart lays out our base case, accelerated uptake case, and delayed uptake
case for VR/AR shipments and overlays the adoption curve for smartphones (starting in
2004) and tablets (starting in 2010).
Exhibit 12: Our VR/AR shipment assumptions vs. the smartphone and tablet ramps
Source: Goldman Sachs Global Investment Research, Gartner for tablet shipment data
TV
$99bn
Notebook PC
$111bn
Desktop PC
$62bn
Tablet PC
$63bn
Game Console
$14bn
Accelerated
Uptake
$110bn
Base Case
$45bn
Delayed Uptake
$15bn
$0
$50
$100
$150
$200
$250
$300
$350
$0 $100 $200 $300 $400 $500 $600 $700 $800 $900
Annualshipments(mns)
ASP ($)
0
100,000
200,000
300,000
400,000
500,000
600,000
700,000
800,000
2015E 2016E 2017E 2018E 2019E 2020E 2021E 2022E 2023E 2024E 2025E
Unitshipments(000's)
Base case Accelerated uptake Delayed uptake
Tablet shipments Smartphone shipments
Tablet shipments
from 2010-2016E
Smartphone shipments
from 2004-2012
Accelerated
uptake
Base case
Delayed uptake
January 13, 2016 Americas: Technology
Goldman Sachs Global Investment Research 16
Use cases and software market detail
We believe VR and AR have the potential to not only create new markets but also disrupt
existing ones. We’ve identified 9 use cases for VR/AR technology which we see currently
emerging: videogames, live events, video entertainment, retail, real estate, education,
healthcare, engineering, and military.
For each of these use cases, we assess the following:
1) The potential market reach in terms of users
2) The current challenges to execute on this use case
3) The existing revenue pool that VR/AR adoption could disrupt
4) Revenue drivers and estimate the software/subscription revenue potential through
2025
The following exhibit summarizes our software estimates by use case and key data points
to gauge the market.
Exhibit 13: Our base case user and software revenue assumptions
Source: Goldman Sachs Global Investment Research/ Data point stats from: Gartner, IDC, World Bank, US Bureau of Labor Statistics, National Center for Education
Statistics, Nielsen, FIFA, American Medical Association, Research and Markets, National Association of Realtors, OC&C Strategy Consultants, the Japan Ministry of
Land, Infrastructure, Transport and Tourism, the Land Institute of Japan, Borrell Associates, CAE, Eurostat, and Statistics Japan.
The market VR/AR is
playing into
To gauge the magnitude, the population
that VR/AR could sell into
Users
Software
revenue
Users
Software
revenue
Videogames VR/AR $106bn videogame market
~230mn installed base of video game consoles
~150mn PC gamers in developed markets
70mn $6.9bn 216mn $11.6bn
Live events VR
$44bn in live sports ticketing
revenue
~715mn viewers of World Cup
~160mn viewers of the Super Bowl
~92mn ESPN subscribers
28mn $0.8bn 95mn $4.1bn
Video entertainment VR $50bn Netflix TAM
~450mn households for Netflix's addressable
market
24mn $0.8bn 79mn $3.2bn
Real estate VR
$107bn total real estate
commission market in US,
Japan, UK, and Germany
1.4mn real estate agents in US, Japan, UK, and
Germany
0.2mn $0.8bn 0.3mn $2.6bn
Retail VR/AR
$3bn in ecommerce software
market
(impacting $1.5tr ecommerce
market)
1bn+ online shoppers
In-store shoppers
9.5mn $0.5bn 31.5mn $1.6bn
Education VR/AR
Education software market:
$5bn for K-12, $7bn for higher
education
~200mn primary and secondary students in
developed markets
In US, ~50mn K-12 and ~20mn college students
7mn $0.3bn 15mn $0.7bn
Healthcare VR/AR
$16bn patient monitoring
devices market
~8mn physicians and EMTs in developed markets
In US, ~800k physicians and 240k EMTs
0.8mn $1.2bn 3.4mn $5.1bn
Engineering VR/AR
$20bn engineering software
market
~6mn engineers in US, Europe and Japan
~2.4mn engineers/technicians in the US
1.0mn $1.5bn 3.2mn $4.7bn
Military VR/AR
$9bn defense industry training
and simulation market
~6.9mn military personnel in "high income
countries" (World Bank)
~1.3mn US military personnel
Assuming
proprietary
HMDs
$0.5bn
Assuming
proprietary
HMDs
$1.4bn
Total 95mn $13.1bn 315mn $35.0bn
Current market
size
VR/AR 2020 Base case
assumptions
2025 Base case
assumptions
Datapoints on the population
that could use VR/AR
January 13, 2016 Americas: Technology
Goldman Sachs Global Investment Research 17
We believe VR devices will have multiple use cases similar to smartphones that serve the
functions of voice communication, texting, email, video, internet browsing, and social
platforms. In our view, consumers will be able to use a single VR device to play
videogames, watch video programming and live events, and shop. That said, we believe
the business use cases will likely use separate devices given that specialized software will
be required along with potential enterprise security concerns.
A software market driven by both consumer and enterprise
We note that of our 9 use cases, videogames, live events, and video entertainment are the
only 3 that are entirely driven by the consumer and make up ~60% of our total VR/AR
revenue assumptions for 2025. The remaining ~40% is driven by enterprise and public
sector spend with the largest revenue generating use cases in engineering, healthcare, and
real estate.
Exhibit 14: Our 2025 VR/AR estimates by use case
Consumer-driven use cases in videogames, live events and
video driving ~60% of software spend with the remainder
from enterprise and public sector
Exhibit 15: Our 2025 software estimates by VR and AR
VR use cases driving 75% of our software estimate; as AR
technology matures we expect more enterprise use cases to
emerge
Source: Goldman Sachs Global Investment Research. Source: Goldman Sachs Global Investment Research.
As mentioned, we see use cases that are specific to VR, use cases that are specific to AR,
and some cases where the two overlap. Our research indicates that AR technology still
needs to mature, especially in display technology and the real-time processing and
calibration of real-world physical environment. As AR technology matures, we see stronger
enterprise use cases emerging especially considering AR enables you to see your physical
environment whereas VR completely blocks it.
The chicken-and-egg dilemma
Before diving into the individual use cases, we note that a key challenge for videogame and
entertainment VR use cases is a chicken-and-egg problem where content makers (e.g.,
videogame publishers, filmmakers) are hesitant to develop VR content without an installed
base and consumers are reluctant to buy the technology without content to experience.
That said, we see Google, Facebook, Sony and Microsoft trying to solve for this issue on
both sides of the equation. On the installed base side, Google has already distributed 2mn
Google Cardboard viewers (1mn provided for free via the New York Times) and Oculus is
innovating with HMDs with Rift being the first major PC-based device coming to market. In
terms of content, Facebook and YouTube have enabled 360-degree videos viewable in VR,
and Oculus is creating its own video content with Oculus Story Studio which plans to
release 20 VR videogames in 2016, and expects 100 games to be available in total by year-
end.
Videogames,
$11.6bn
Live events,
$4.1bn
Video
entertainment,
$3.2bn
Retail, $1.6bn
Real estate,
$2.6bn
Education, $0.7bn
Healthcare,
$5.1bn
Engineering,
$4.7bn
Military, $1.4bn
AR, $9bn, 25%
VR, $26bn, 75%
January 13, 2016 Americas: Technology
Goldman Sachs Global Investment Research 18
Videogames
VR technology heightens the videogame experience by completely immersing a user in a
virtual world while AR technology can turn your physical world into a videogame canvas.
We see VR videogames as the first consumer market to develop as we see both the
hardware and software further along in development (relative to our other highlighted use
cases and to AR gaming) as well as the gamer community eagerly awaiting the technology.
We estimate an installed base of ~230mn gaming consoles and ~150mn PC
gamers. Our console estimate is based on the installed base of Xbox, PlayStation, and Wii.
We believe hardcore gamers (defined as people that play over 15 hours of games per
week) will be the first to adopt VR gaming and note that IDC estimates that roughly 30% of
PS4 and Xbox One users fall into this category. As for PC gamers, we estimate ~700mn
worldwide and ~150mn in developed countries. Given that Oculus will require a high-end
PC, we assume that PC gamers in developed countries would be more likely to adopt.
One of the key challenges is that current videogames cannot simply be ported to a VR/AR
platform. Given our conversations with large videogame publishers like EA Sports and
Activision, a new videogame franchise can cost up to ~$75-$100mn to create while
subsequent versions of the game can cost as little as ~$10mn. Without a strong installed
base of VR hardware devices, videogame publishers are cautious to make investments in
new VR game franchises as they can’t be certain of the addressable market. That said, we
note the gaming industry can quickly shift with IDC estimating that the mobile gaming
market grew to $35bn in 2015, surpassing the console market for the first time. Further,
Oculus said in September 2015 that it had 200k developers registered to create games on
the VR platform.
IDC estimates the total videogame market at $106bn for 2015. We see the
potential for VR/AR to be a disruptive force in this market, while also growing the overall
market size by attracting new users and increasing the videogame attach rate per user.
Our base case, estimates $6.9bn in VR videogame revenue in 2020 and $11.6bn
in 2025. To illustrate VR’s potential in the videogame software market, we consider the
number of VR gamers, the number of games an average user will buy each year, and the
cost that can be charged per game.
 Gamers: Our base case assumes there are 70mn VR gamers in 2020 (which would
represent 30% of the current 230mn console installed base) and 216mn VR gamers in
2025.
 # of games bought per user: In our analysis, we assume VR gamers on average
purchase 2.5 games a year then trend down towards 1.0 game per year, which are
similar metrics we estimate for Xbox and PlayStation.
 Price per game: We believe that VR games will come with pricing in line with current
2D games and assume an initial average price of $60 for a VR game.
Exhibit 16: Estimating the potential of the VR videogame software market
($ in mn, users in 000s)
Source: Goldman Sachs Global Investment Research.
2016E 2017E 2018E 2019E 2020E 2021E 2022E 2023E 2024E 2025E
Installed base of VR gamers - Base case (000s) 3,114 10,320 24,314 45,090 69,646 97,539 117,209 143,070 175,395 215,803
% yoy 231% 136% 85% 54% 40% 20% 22% 23% 23%
# of games bought a year 2.5 2.4 2.2 1.9 1.7 1.6 1.5 1.4 1.2 1.1
Price per game $60 $60 $60 $58 $57 $55 $53 $52 $50 $49
% yoy 0% 0% -3% -3% -3% -3% -3% -3% -3%
VR video game software revenue $467 $1,486 $3,209 $4,986 $6,878 $8,596 $9,426 $10,044 $10,760 $11,558
% yoy 218% 116% 55% 38% 25% 10% 7% 7% 7%
The potential user base
The challenges
The market disrupted
Sizing the revenue opportunity
VIDEOGAMES
$11.6 billion (2025E base case)
216 million users
• First consumer market to develop
• Current games cannot be ported to VR/AR platform
• New franchise costs are high, but decline with subsequent versions
January 13, 2016 Americas: Technology
Goldman Sachs Global Investment Research 19
Live events
One of the key VR use cases we see emerging is the streaming of live events (like sports,
concerts, world affairs) which solves the problem of limited seating at events and makes
events essentially available to anyone and anywhere. Radio once solved this problem with
an audio experience, TV currently solves this problem with a 2D viewing experience, and
VR has the potential to be the new format in which people watch and experience live
events.
Watching an event in VR will essentially make a user feel like they’re physically attending
the event with the best seat in the house. We see this opportunity initially applying to
sports, but also going beyond and note that CNN streamed the first US Democratic
presidential debate in VR which was watched across 121 countries.
We try to gauge the user base opportunity for live events in VR through TV viewership and
subscriber statistics:
 715mn people watched the 2006 World Cup final match according to FIFA
 160mn people watched the 2015 Super Bowl according to Nielsen
 There are ~92mn ESPN subscribers according to Nielsen
Further, HBO and Showtime reported that 4.4mn people subscribed to the Mayweather vs
Pacquiao boxing match for a $100 fee. While some of these are single events, we’re
highlighting that sports events have mass worldwide appeal. The events that could be
broadcast in VR go beyond sports to concerts and events of world interest like the wedding
of Prince Charles and Lady Diana which drew 750mn viewers.
One of the key challenges with VR live events is gaining the rights to broadcast the content.
The NFL has TV contracts with Fox, NBC, and CBS but it’s not entirely clear whether or not
virtual reality broadcasts fall under these contracts. Another challenge is on the user
adoption side as many people watch live events as a social activity and wearing a virtual
reality headset would limit interaction. In this respect, we expect much of the
entertainment on virtual reality to be consumed individually.
PwC estimates $44bn in gate revenue for sporting events in CY15, with the global
sports market at $145bn when also including $35bn in media rights revenue, $45bn in
sponsorships, and $20bn in merchandising. We don’t expect VR to cannibalize gate
revenue as we always expect demand to see events in person. In fact, we believe VR has
the potential to create new revenue pools in the form of new ticketing and subscription
fees charged to sports fans that want to watch events in VR but can’t attend the event live.
Further, media rights revenue is likely to be expanded as the likes of the NBA and FIFA will
have more outlets to license to.
Our base case assumptions lead to $750mn in revenue in 2020 and $4.1bn in
2025. To size the market, we consider the number of VR users for this use case, the
number of events watched a year, and the price per event.
 Users: We believe live events will be a popular use case for VR users and estimate
30% penetration of our base-case installed base which equates to 28mn users in 2020
and 95mn in 2025.
 Events per year: We estimate that users initially watch 2 events per year, but that
slowly increases as more content becomes available to nearly 4 events in 2025. We see
this as low with 82 NBA games per season (for each 30 teams), 162 MLB games (for
each of the 30 teams), and major sporting events each having playoff and
championship games with broad appeal, in addition to the wide range of non-sporting
events.
The potential user base
The challenges
The market disrupted
Sizing the revenue opportunity
LIVE EVENTS
$4.1 billion (2025E base case)
95 million users
• Examples include sports, concerts and world affairs
• Gaining VR broadcast rights is a challenge
• Headsets also limit the amount of social interaction possible during streaming
January 13, 2016 Americas: Technology
Goldman Sachs Global Investment Research 20
 Price per event: Finally, we assume an initial price point of $10 per event, which is a
steep discount to an NBA ticket costing $50 on average and events like the
Mayweather vs Pacquiao fight costing $100 per TV viewer (and grossing over $300mn
in revenue for HBO and Showtime).
Exhibit 17: Estimating the potential of a VR live events market
($ in mn, users in 000s)
Source: Goldman Sachs Global Investment Research.
NextVR is leading the way in watching live sports courtside in virtual reality
Feel like you’re at the game from the comfort of your living room
The problem: There are only so many seats that a stadium or arena can hold, yet there are people around that world
that want to attend sporting events. Costs and location are the primary factors that prevent sports fans from attending
events.
The NextVR Solution: We spoke with NextVR, a VC-backed company founded in 2009 whose most recent funding
round included investments from Time Warner Cable and Comcast. We believe NextVR is furthest along in distributing
live events to audiences using VR. It has content arrangements with Comcast and Madison Square Garden. It has
partnered with Premier League, the NBA and Turner Sports. The first NBA game NextVR streamed was on October 27,
2015 between the Golden State Warriors and New Orleans Pelicans which was watched across 45 states. This use case
has already gone outside of sports as NextVR partnered with CNN to stream a US Democratic presidential debate in VR
which was watched across 121 countries. NextVR sees its addressable market as wide-ranging and including sports
events, music events, and other popular events like Easter mass at the Vatican.
Potential Bottlenecks: NextVR says that despite its attempts to engage all the stakeholders, broadcasting rights are the
key challenge.
2016E 2017E 2018E 2019E 2020E 2021E 2022E 2023E 2024E 2025E
Installed base of VR/AR headsets - Base case (000s) 3,838 13,391 33,550 60,893 94,587 128,764 165,508 206,316 255,678 315,208
% of installed base using the live events use case 30% 30% 30% 30% 30% 30% 30% 30% 30% 30%
# of "live events" VR users 1,151 4,017 10,065 18,268 28,376 38,629 49,652 61,895 76,703 94,563
% yoy 249% 151% 82% 55% 36% 29% 25% 24% 23%
# of events per year 2.0 2.0 2.0 2.2 2.5 2.8 3.0 3.2 3.4 3.5
% yoy 0% 10% 10% 10% 10% 8% 8% 5% 5%
Implied number of events 8,035 20,130 40,189 70,940 106,230 147,468 198,534 258,335 334,409
Cost per event $0 $10 $10 $10 $11 $11 $11 $12 $12 $12
% yoy 0% 3% 3% 3% 3% 3% 3% 3%
VR live event revenue $0 $80 $201 $414 $753 $1,161 $1,660 $2,302 $3,085 $4,113
% yoy 151% 106% 82% 54% 43% 39% 34% 33%
January 13, 2016 Americas: Technology
Goldman Sachs Global Investment Research 21
Video entertainment
We see VR creating a new form of movie and TV entertainment. Instead of watching a
movie on two dimensional screens, users can be completely immersed in the film.
The GS Internet Team sizes Netflix’s addressable market at 462mn households,
based on the markets that Netflix is in and adjusting for access speeds and credit card
penetration. While we see VR as a new form of content, we expect it to appeal to the
masses and see the potential user base to be similar to viewers of online video today. We
believe in the long-run, VR video content is addressing a similar market.
Similar to videogames, creating content is a key challenge for virtual reality video
entertainment. To gain the full VR experience, movies must be filmed with a 360-degree
camera which means current films cannot simply be ported over. VR is essentially a new
storytelling format that will require different writing and producing techniques than
traditional movies and TV. In this regard, the cost to produce VR video entertainment is
difficult to predict. We actually see the potential for the costs around camera work to be
lower in VR as a 360-degree camera reduces the need for multiple cameras and editing
work that is typical with 2D video. That said, similar to the challenges with videogames,
Hollywood needs to be convinced of the opportunity in VR movies to begin making the
investment.
We use the GS Internet team’s Netflix TAM of $50bn. We see VR video disrupting
the online movie and TV market.
Our base case assumptions lead to $750mn in revenue in 2020 and $3.2bn in
2025. To size the market, we consider the number of VR users for this use case and the
annual spend these users would pay for VR content.
 Users: We believe video will be a popular use case for VR and estimate 25%
penetration of the installed base of headsets which equates to 24mn users in 2020 and
79mn in 2025.
 Annual spend per user: As VR video content is still in the phase of gaining user
adoption and acceptance, we see content being free in the early years but then
generating subscription revenue that is supplementary to their 2D video packages as
we don’t expect VR video to be a replacement. In this sense, we consider the additional
fee consumers would pay for an enhanced video experience and note that IMAX
movies come at a 45% premium to a 2D movie ticket. Further, we note that when
Netflix initially started offering Blu Ray, the company charged a ~25% premium to
standard DVD packages and we view the step to VR video as an incrementally greater
experience. For our VR annual subscription ARPU we use a 30% premium to the
current Netflix ARPU of $108 (implying that a VR video subscription is incremental to a
standard streaming video package). This equates to a VR subscription ARPU of $32
which we apply starting in 2017 and growing 5% annually starting in 2020.
Exhibit 18: Estimating the potential of VR video entertainment
($ in mn)
Source: Goldman Sachs Global Investment Research.
2016E 2017E 2018E 2019E 2020E 2021E 2022E 2023E 2024E 2025E
Installed base of VR/AR headsets - Base case (000s) 3,838 13,391 33,550 60,893 94,587 128,764 165,508 206,316 255,678 315,208
% of installed base using the movie use case 25% 25% 25% 25% 25% 25% 25% 25% 25% 25%
# of Video entertainment VR users (000) 959 3,348 8,387 15,223 23,647 32,191 41,377 51,579 63,919 78,802
% yoy 249% 151% 82% 55% 36% 29% 25% 24% 23%
Annual subscription fee ($) $0 $32 $32 $32 $32 $34 $35 $37 $39 $41
% yoy 0% 0% 0% 5% 5% 5% 5% 5%
VR video entertainment revenue $0 $107 $268 $487 $757 $1,082 $1,460 $1,911 $2,486 $3,218
% yoy 151% 82% 55% 43% 35% 31% 30% 29%
The challenges
The market disrupted
Sizing the revenue opportunity
The potential user base
VIDEO ENTERTAINMENT
$3.2 billion (2025E base case)
79 million users
• Similar to videogames, existing films cannot be ported over
• VR is creating a new medium for entertainment
• A challenge is the availability of new content without a large installed base
January 13, 2016 Americas: Technology
Goldman Sachs Global Investment Research 22
IG Port’s VR animated video is adding new value for mobile and amusement parks
VR animation as an immersive mobile experience, and an economic makeover for theme parks
The problem: Mobile has become a popular means of video consumption but it lacks the same level of engagement
versus viewing at a movie theater or even a home television. A separate problem is that amusement parks face large
investment risk when renewing attractions, as well as the necessity for closure during physical renovations.
The IG Port solution: We spoke with IG Port, a Japanese animated film production company that has recently been
investing in VR content. The company sees VR short films helping to solve both issues above. Downloading VR short
movies via mobile and watching them through HMDs would enable users to slip into the immersive world, while
keeping the value proposition of mobile. Amusement parks can install “VR entertainment centers” where virtual worlds
are layered on top of the physical world. Amusement parks could then easily renovate attractions by changing VR video
content to completely change the consumer experience.
IG released the pilot movie “Ghost in the Shell” (3min, 31sec) on YouTube on November 24, 2015 and the unadvertised
pilot has been viewed 400,000 times. The company is planning to release a full version of the movie (10 minutes) in
February available at Google Play and the App Store for 480 yen per download (~$4 USD), and is expecting total
downloads of 200,000. According to the company, production costs for the 10 minute movie were less than $1mn with
no new equipment installation needed. The company estimates that the optimal amount of time viewed on VR content
is about 10-20 minutes, so by creating such content, they could distribute via mobile apps as well as to amusement
parks. The company now licenses its animated film “Attack on Titan” to Universal Studios Japan, and is aiming to
introduce their animated VR content to other amusement parks going forward.
The potential user base: There are more than 80 major amusement parks globally, and if each installs at least one 360-
degree video attraction, and switches the VR content seasonally (4 times a year), the addressable market would be 320
VR short movies for attractions (Hollywood’s number of movies produced annually is around 600-700).
Constraints: Uptake at amusement parks depends on parks’ installation of VR entertainment centers. In animated
content, production costs do not seem to be a large concern.
Exhibit 19: Image of IG Port’s VR movie “Ghost in the Shell”
Source: IG Port
January 13, 2016 Americas: Technology
Goldman Sachs Global Investment Research 23
Retail
Ecommerce is a $1.5tr market today and represents 6% of all retail spending worldwide.
While not frequently discussed, we believe high-end portions of the market that have been
challenging for the internet to penetrate can be revolutionized due to the adoption of VR
and AR technology.
 Home Improvement store Lowe’s has a “Holoroom” at 6 of its stores where shoppers
can configure kitchens and bathrooms and view their designs with Oculus devices.
 Microsoft and Volvo announced a partnership and have performed a demo where
HoloLens can be used by consumers to configure cars at a dealership.
 There is also an apparel shopping use case, where consumers could use VR/AR to see
how clothes look on them without physically trying them on.
The key challenge is developing software that works with VR/AR devices for these specific
commerce use cases. Whether you’re envisioning a remodeled kitchen, a new car, how
certain pieces of furniture might look in your home, or how clothes look on you, the
experience needs to be easy for the consumer to use and be realistic.
We use the 1bn online shoppers (according to Internet Retailer) as a gauge. In the long-
run, we see the shopping use case for VR/AR to be available to any shopper.
We consider the $3bn ecommerce software market as the main revenue pool VR/AR
software will play into, as this market is comprised of tech investments that retailers make
to serve their customers. We see VR/AR disrupting retail markets where companies can
garner a competitive advantage by using the technology and as such have the ability to
increase share of their existing market. We see an opportunity for this in the near-term with
the $180bn home improvement market (Bureau of Economic Analysis) and the $260bn
apparel market (Euromonitor). Further, we see the potential for VR/AR to reduce the need
for in-store displays and possible erode the value of a physical store.
Our base case assumptions lead to $500mn in VR retail software revenue in
2020 and $1.6bn in 2025. We see VR/AR as a technology that retailers will have to
invest in to serve their customers and keep ahead of their competition. Ecommerce
software companies like Demandware charge their customers on a revenue/share basis
where Demandware gets 1-2% of the sales that run through its platform. We believe VR/AR
sales could operate in a similar model. To estimate the market size, we consider the
number of users (assuming just 1 transaction per year), and the average size of transaction
(assuming a 1% take rate similar to Demandware).
 Users: On our base case, we’re assuming just 5% of the VR/AR installed base engages
in VR shopping.
 Average transaction size: We assume an average transaction size of $5k as we
believe VR will be used for higher-end purchases, but this is still a steep discount to the
average cost to remodel a kitchen at $19k (HomeAdvisor) and the average new car cost
of $34k (Kelley Blue Book).
These assumptions imply $158bn in 2025 of consumer sales transacted through VR/AR
versus $1.5tr in ecommerce revenue today. For the retail use case of VR/AR, we’re less
focused on the software revenue opportunity and instead focus on the disruption
potentially caused in retail markets the technology can serve.
The potential user base
The challenges
The market disrupted
Sizing the revenue opportunity
RETAIL
$1.6 billion (2025E base case)
32 million users
• Emerging use cases in home improvement, apparel and auto industries
• Key challenge is developing realistic, easy-to-use software
• We anticipate VR/AR will be used for higher-end purchases
January 13, 2016 Americas: Technology
Goldman Sachs Global Investment Research 24
Exhibit 20: Estimating the potential of a VR/AR retail software market
($ in mn, users in 000s)
Source: Goldman Sachs Global Investment Research.
2016E 2017E 2018E 2019E 2020E 2021E 2022E 2023E 2024E 2025E
Installed base of VR/AR headsets - Base case (000s) 3,838 13,391 33,550 60,893 94,587 128,764 165,508 206,316 255,678 315,208
% of installed base using the shopping case 5.0% 8.0% 9.0% 10.0% 10.0% 10.0% 10.0% 10.0% 10.0%
Shopping VR/AR users (000s) 670 2,684 5,480 9,459 12,876 16,551 20,632 25,568 31,521
% yoy 301% 104% 73% 36% 29% 25% 24% 23%
Transaction per user 1.0 1.0 1.0 1.0 1.0 1.0 1.0 1.0 1.0
Average cost of transaction ($) $5,000 $5,000 $5,000 $5,000 $5,000 $5,000 $5,000 $5,000 $5,000
Retail sales through VR/AR $3,348 $13,420 $27,402 $47,294 $64,382 $82,754 $103,158 $127,839 $157,604
VR/AR take rate 1.0% 1.0% 1.0% 1.0% 1.0% 1.0% 1.0% 1.0% 1.0%
VR/AR retail software revenue $0 $33 $134 $274 $473 $644 $828 $1,032 $1,278 $1,576
% yoy 301% 104% 73% 36% 29% 25% 24% 23%
January 13, 2016 Americas: Technology
Goldman Sachs Global Investment Research 25
Volvo is using AR to enhance auto purchases
AR can lead to a more efficient car buying experience.
The problem: Shopping for a car can be frustrating when a specific color or trim you’re interested in isn’t available on
the lot. This can lengthen the buying process if the buyer isn’t satisfied with the available inventory and decides to try
another dealership. On the other hand, car manufacturers are burdened by the cost of dealer real estate in a world
where the number of variants each manufacturer sells has been proliferating, so accommodating them in a building
becomes even more challenging. More innovative manufacturers are trying to circumvent the dealer model altogether
with direct online sales and urban showrooms, and servicing brought to the customer.
The Volvo solution: We spoke with Volvo, which announced a partnership with Microsoft in November where
HoloLens can be used by consumers to configure cars. Volvo recently hosted a demo of a virtual showroom in
collaboration with Microsoft HoloLens. The demo showed the ability to construct and view a virtual car and strip away
the body to see the underlying skeleton. Further down the line, Volvo also envisions AR technology improving the
process of servicing cars and enhancing safety features.
The value proposition: We see the ability to construct realistic images of cars on-site based on a customer’s
specifications improving conversion of uncertain buyers that pass through dealerships. We also see efficiency gains as
dealerships are able to market cars to consumers which have yet to be manufactured and reduce the number of cars on
the lot, potentially saving on dealer real estate costs. For context, GS currently estimates full year 2015 auto sales of
17.5mn vehicles in the US.
Potential bottlenecks: Volvo acknowledged that the Microsoft demo was in a controlled environment and that there
will be particular challenges recreating this experience in pop-up locations. Still, Volvo expects to incorporate HoloLens
into its shopping experience in 2016.
Exhibit 21: Volvo plans to incorporate HoloLens into its customer experience in 2016
Source: Volvo, YouTube
January 13, 2016 Americas: Technology
Goldman Sachs Global Investment Research 26
Real estate
We see the potential for VR to drive consumer purchasing in real estate and note that
Sotheby’s is experimenting with VR to show homes to prospective buyers. We see shifts
like VR changing the industry as companies emerge to go after a portion of the
commission dollars on these transactions.
We see a potential user base of 1.4mn registered real estate agents. Real estate is
a market where the lines between consumer use and business use begin to blur:
 Real estate agents will want VR devices for the prospective clients to use.
 Homebuyers would want their own devices to be able to view homes without an
agent.
In terms of the addressable user base, we focus on countries that have large online real
estate classifieds markets including the US, Japan, Germany, and the UK. There are 1.2mn
registered real estate agents in the US, 123k in Japan, 32k in Germany, and 22k in the UK
according to data from the National Association of Realtors (NAR), OC&C Strategy
Consultants, and the Japan Ministry of Land, Infrastructure, Transport and Tourism.
The key challenge for the real estate use case is that VR content for homes must be
captured with a 360-degree camera which can be costly and labor-intensive.
We estimate an aggregate real estate commissions market of $107bn using our
data sources for registered real estate agents as well as data from Borrell Associates and
the Land Institute of Japan, with $52bn in the US, $38bn in Japan, $9bn in the UK, and
$8bn in Germany. For the US commission pool, 53% ($27bn) is retained for profit, 17%
($9bn) goes to marketing, and 30% ($16bn) goes to the brokerage. We believe VR
technology could draw spend from either the marketing budget or brokerage budget.
Our base case assumptions lead to $750mn in revenue in 2020 and $2.6bn in
2025. To size the market, we consider the number of agents using VR as a selling tool and
the potential average annual spend. The agents on Zillow’s platform have an average
annual spend of $4,100. We believe the value proposition of a VR home listing ad can
significantly outweigh that of an online ad. For 2020, we estimate 130k real estate agents
using VR to show homes with an annual spend of $5,000 (a 20% premium to Zillow’s
current ARPU) which we believe can grow 10% annually which is below Zillow’s ARPU
growth rate for the last two years. In light of a $107bn real estate commission market and
given that VR has the potential to change the business model, we see these estimates as
conservative.
Exhibit 22: Estimating the potential of a VR real estate market
($ in mn, users in 000s)
Source: Goldman Sachs Global Investment Research.
2016E 2017E 2018E 2019E 2020E 2021E 2022E 2023E 2024E 2025E
Real estate VR/AR users (000) 5 25 50 100 150 180 216 248 283 317
% yoy 100% 100% 50% 20% 20% 15% 14% 12%
Average annual spend $0 $2,000 $4,000 $4,400 $5,000 $5,500 $6,050 $6,655 $7,321 $8,053
% yoy 100% 10% 14% 10% 10% 10% 10% 10%
VR real estate revenue $0 $50 $200 $440 $750 $990 $1,307 $1,653 $2,073 $2,554
% yoy 300% 120% 70% 32% 32% 27% 25% 23%
The potential user base
The challenges
The market disrupted
Sizing the revenue opportunity
REAL ESTATE
$2.6 billion (2025E base case)
300,000 users
• VR to draw spend from $107bn commissions market (US, Japan, Germany, UK)
• Sotheby's is already experimenting with VR
• Rate of capture for VR content a key challenge to broader adoption
January 13, 2016 Americas: Technology
Goldman Sachs Global Investment Research 27
Matterport is building out the virtual real estate market
VR can increase transparency and eliminate friction in real estate transactions
The problem: Ecommerce has enabled people to buy products without going to the store. But with more complex or
valuable purchases, a few pictures on a website aren’t enough to make a decision. This is particularly true with
residential real estate, where buyers expect to see the house or apartment firsthand before moving forward as wide-
angle photos in 2D can be deceiving. But this can be costly and time consuming, especially with international
transactions.
The Matterport solution: We spoke with Matterport, a VC-backed company founded in 2011 which aims to enable
realtors to “immerse clients in 15 homes in 15 minutes.” Matterport builds 3D models of real-world spaces primarily
targeting the real estate market, which are viewed on PCs, mobile devices, and increasingly HMDs. Matterport’s end-to-
end platform for capturing, hosting and distributing 3D models includes a user-friendly 3D camera which sells for
$4,500, a cloud based system for producing and hosting 3D models, and a portal for content creators to manage and
distribute their 3D models. Customers pay Matterport a monthly rate based on the # of models captured, with models
over a certain size counting as 2.
Apartments.com recently partnered with Matterport to create 30,765 3D virtual tours of rental properties, giving online
browsers a more accurate and immersive sense of each listing. The company has found that visitors to its site spend 3x
the amount of time engaging with a listing that has a Matterport 3D tour compared to ones that don’t.
VR is the next step: At this point, Matterport has rolled out a beta version of its VR showcasing service which lets
customers convert 3D models for viewing through an HMD. Viewing models in VR gives prospective renters a sense of
being at the site, and we see virtual walk-throughs as the key next step in narrowing or closing housing searches
without an in-person visit. This leads to cost savings associated with travel, as well as potential market expansion as
virtual real estate inventory in remote locations is captured and made accessible to more consumers.
Potential bottlenecks: The process for capturing content is somewhat manual. While Matterport was able to provide
Apartments.com with 1,000 3D models of listings per week since the start of their partnership, we see automation
leading to a higher rate of capture and a general proliferation in content.
Exhibit 23: Matterport’s VR showcase using HMDs is currently available in beta
Source: Matterport
January 13, 2016 Americas: Technology
Goldman Sachs Global Investment Research 28
Healthcare
We see several use cases for VR/AR technology in healthcare: 1) as a tool to aid doctors in
medical procedures and day-to-day tasks, 2) for physical therapy and to treat phobias like
fear of heights, and 3) to increase access to doctors through virtual visits.
1. When Google Glass was first introduced, Google offered select hospitals Glass devices
to test the product. During these trials, surgeons used Google Glass for a range of
functions, like projecting CT scans and MRIs on to the field of vision as he or she would
operate, scanning bar codes to gain basic medical information about the patient, and
alerting the doctor with lab results.
2. In the therapy use case, VR can treat patients with anxiety disorders (such as PTSD) or
phobias. These virtual worlds can create artificial, controlled stimuli in order to
habituate the patient to those environments that cause anxiety. VR can also be used to
rehabilitate patients, such as amputees.
3. We also see an opportunity for VR/AR to increase consumer access to doctors. Doctors
are already conducting video-based visits and VR can enhance that experience.
We estimate there are ~8mn physicians and EMTs globally that could use VR/AR
technology according to data from the Organisation of Economic Co-operation and
Development (OECD), the America Medical Association (AMA) and US Bureau of Labor
Statistics. In the US, there are ~1.5mn medical professionals which could serve as the
addressable user base of VR/AR, with ~740k specialty physicians, ~500k primary care
physicians, and 240k EMTs.
In speaking with doctors about Google Glass, privacy was a concern as data transmitted to
the device was not encrypted and violated HIPAA regulations. Additionally, for specialty
physician use cases the software required would need to be complex and precise.
We see VR/AR applications in healthcare disrupting a $16bn market for patient
monitoring devices according to Research and Markets.
Our base case estimates $1.2bn in revenue in 2020 and $5.1bn in 2025. While the
number of doctors that could potentially use VR/AR devices is relatively small when
compared to the consumer market, we believe the bigger market opportunity will be in
specialized software versus the hardware sold. While it’s difficult to gauge how much
VR/AR software will cost for specialized medical use, we note that specialized computer-
aided design (CAD) software for architects and engineers can range from $1,000-$5,000 per
year and use this as a comp as we see specialized medical software also requiring a high-
degree of precision. In our base case, we estimate that 800k EMTs and physicians use
VR/AR technology in 2020 and 3.4mn in 2025 at an assumed subscription software cost of
$1,500.
Exhibit 24: Estimating the potential of a VR/AR healthcare market
($ in mn, users in 000s)
Source: Goldman Sachs Global Investment Research.
2016E 2017E 2018E 2019E 2020E 2021E 2022E 2023E 2024E 2025E
Healthcare VR/AR users (000s) 100 200 500 800 1,200 1,680 2,268 2,835 3,402
% yoy 100% 150% 60% 50% 40% 35% 25% 20%
Annual software costs ($) $0 $1,500 $1,500 $1,500 $1,500 $1,500 $1,500 $1,500 $1,500 $1,500
VR/AR healthcare revenue $0 $150 $300 $750 $1,200 $1,800 $2,520 $3,402 $4,253 $5,103
% yoy 100% 150% 60% 50% 40% 35% 25% 20%
The potential user base
The challenges
The market disrupted
Sizing the revenue opportunity
HEALTHCARE
$5.1 billion (2025E base case)
3.4 million users
• VR/AR has potential to treat phobias and aid in medical procedures
• Can also aid in day-to-day tasks as a hands-free device
• Data privacy and software development could limit uptake
January 13, 2016 Americas: Technology
Goldman Sachs Global Investment Research 29
Atheer is enabling AR as a hands-free medical tool for doctors and EMTs
AR improving patient care
The problem: Medical professionals need quick and real-time access to information but often they’re already using
their hands and need to focus on the patient.
The Atheer solution: We spoke with Atheer Labs, a VC-backed startup founded in 2011 which makes an augmented
reality HMD (AiR Glasses) and a software platform (AiR Suite) targeting “deskless professionals” that need rich
information without having to hold a computer. Atheer breaks deskless professionals down into four categories: fixing,
assembling, surveying, and treating. Atheer sells its AR glasses for $4,000 and sells its software on a subscription basis
for $600 per user per year for the basic suite.
With regards to “treating”, Atheer’s AR platform can provide real-time information to medical professionals without
using their hands. They can interact with information presented within their field of view with gestures, voice
commands, and motion controls. Given that the system is hands free, it can reduce contamination.
The demand is there: We also spoke with a doctor at the Hospital of the University of Pennsylvania who had tested
Google Glass and sees value in EMTs and trauma centers providing video feeds to doctors with a needed expertise. She
also sees potential for AR to help in walking medical professionals through uncommon scenarios. For example, since
cardiac arrests are uncommon in pediatrics, a doctor could rely on the algorithm for cardiac arrest popping up in her
peripheral.
Exhibit 25: Atheer’s vision of AR in use in the medical industry
Source: Atheer
January 13, 2016 Americas: Technology
Goldman Sachs Global Investment Research 30
Education
We believe VR/AR technology has the potential to be a standard tool in education and
could revolutionize the way in which students are taught for both the K-12 segment and
higher education (college and beyond). Teachers can use VR/AR as a way for students to
interact with objects in a 3D environment. For example, students can learn about the solar
system or a historical event by interacting with those virtual worlds. Google is pushing
forward in this market by offering Cardboard to schools for free and has already developed
over 100 “virtual field trips.” We’re also seeing traction of virtual reality at the higher end
of the market with medical schools experimenting with AR.
The iPad has had strong success in the education market and we believe VR/AR can
provide an incremental experience. Apple does not frequently provide granular metrics
around unit shipments, but in March 2013 the company said that since the 2010 launch, the
company had shipped 8mn iPads to educational institutions worldwide with 4.5mn
shipments in the US. This means in 3 years, 7% of Apple’s 121mn shipments were for
education alone.
There are 200mn primary and secondary students in the developed countries
according to the World Bank. In the US, there are 50mn K-12 students and 20mn college
students, according to the National Center for Education.
New educational content can be difficult to create, especially as students move from
preliminary schooling to higher education.
Gartner sizes the global education software market at ~$12bn for 2015, consisting
of the K-12 education software market at $5.2bn and the higher education (college and
beyond) software market at $6.6bn.
We assume $300mn in educational software revenue in 2020 and $700mn in
2025. While we believe in the impact that VR/AR could have in education, we’re being
conservative in our assumptions and estimate that it would take 5 years to sell 8mn VR/AR
units versus Apple selling 8mn iPads in its first 3 years. Further, we believe that VR/AR will
first take shape in the K-12 market as more of an interactive tool and believe that graduate
educational VR/AR software in subjects like medicine and engineering could be given away
for free to get users accustomed to the software as this is a typical marketing strategy for
engineering software vendors like Autodesk.
After this initial phase, we’re estimating the average annual cost of educational software
per K-12 student of $50 versus an iPad curriculum costing $75. While we believe VR can
revolutionize education, we don’t expect full curriculums to be taught in VR at this point
and acknowledge the education budgets are strapped as it is. We don’t see education as a
material revenue generator, but greater benefits in growing adoption as students become
accustomed to the VR/AR technology.
Exhibit 26: Estimating the potential of the education VR/AR market
($ in mn, users in 000s)
Source: Company data, Goldman Sachs Global Investment Research.
2016E 2017E 2018E 2019E 2020E 2021E 2022E 2023E 2024E 2025E
K-12 educational VR/AR users (000s) 200 700 1,500 3,000 6,500 8,000 9,600 11,040 12,696 14,600
% yoy 250% 114% 100% 117% 23% 20% 15% 15% 15%
Annual software cost ($) $0 $0 $50 $50 $50 $50 $50 $50 $50 $50
VR/AR Educational revenue $0 $0 $75 $150 $325 $400 $480 $552 $635 $730
% yoy 100% 117% 23% 20% 15% 15% 15%
The potential user base
The challenges
The market disrupted
Sizing the revenue opportunity
EDUCATION
$700 million (2025E base case)
15 million users
• Use cases span K-12, higher education
• Apple shipped 8mn iPads to educational institutions in the first 3 years since launch
• Strapped education budgets could limit uptake
January 13, 2016 Americas: Technology
Goldman Sachs Global Investment Research 31
Military
The US military has been using virtual reality for training purposes since at least 2012 with
proprietary hardware and software. Examples of simulations currently used include flight
simulations, battlefield simulations, and medic training. These simulations help soldiers
train for dangerous settings in a more cost effective manner than traditional approaches.
According to the World Bank, there are ~6.9mn military personnel in “high-
income” countries. In the US, there are about 475k personnel in the US Army, 320k in the
Airforce, 330k in the Navy, and 185k in the Marines.
A survey conducted by the Government Business Council (GBC) in 2014 notes that the
main challenge with simulation training was “fidelity”, implying that simulations did not
feel real enough.
The global military simulation and training market is estimated to be $9.3bn
according to CAE, a military contractor. Of this budget, $3.8bn is allocated to flight
simulation which saves costs versus training on actual fighter jets; indeed, the US Airforce
is expected to save $1.7bn from FY12-16 (~$400mn annually) by using flight simulators
according to GBC. That said, while flight simulation is driving cost savings, the list price of
a full-flight air simulator is still over $10mn. If some portions of flight simulation training
can be replaced with VR hardware and software, the incremental cost savings could be
material. Flight simulation is just one example of how VR could drive cost savings in the
military and we see battlefield simulations and medic training as other potential
opportunities.
Our base case estimates $500mn in software revenue in 2020 and $1.4bn in
2025. We believe the number of VR/AR headsets that the military purchases could be
widespread, but believe these are likely to be proprietary headsets that are only for sale to
the military, similar to night vision goggles and as such we’re not incorporating these unit
sales into our forecast at this time. To size the VR/AR software market, we believe we are
being conservative in our assumptions to take small portions of the global $9.3bn military
simulation and training budgets. For 2025, we assume 15% of the military simulation and
training spend can go toward VR which equates to $1.4bn. To test the reasonableness of
this assumption, we note that this would imply 700k users (vs 6.9mn military personnel in
“high income” countries) at an annual VR software cost of $2,000.
Exhibit 27: Estimating the potential Military VR software market
($ in mn)
Source: Goldman Sachs Global Investment Research.
2016E 2017E 2018E 2019E 2020E 2021E 2022E 2023E 2024E 2025E
Defense and Training market $9,300 $9,300 $9,300 $9,300 $9,300 $9,300 $9,300 $9,300 $9,300 $9,300
% VR revenue 1% 2% 3% 4% 5% 7% 9% 11% 13% 15%
VR/AR Military revenue $93 $186 $279 $372 $465 $651 $837 $1,023 $1,209 $1,395
% yoy 100% 50% 33% 25% 40% 29% 22% 18% 15%
The potential user base
The challenges
The market disrupted
Sizing the revenue opportunity
MILITARY
$1.4 billion (2025E base case)
700,000 users
• US military has been using VR technology for training for several years
• Potential use cases include flight and battle simulation, medic training
• “Fidelity” cited as a main challenge to adoption
January 13, 2016 Americas: Technology
Goldman Sachs Global Investment Research 32
Engineering
We see VR/AR technology disrupting both the computer-aided manufacturing (CAM) and
computer-aided design (CAD) markets. In product manufacturing, VR/AR can enable
engineers to test scenarios and designs before the products are made, driving productivity
and cutting down on the cost of wasted materials. According to Forbes, Ford has been
using virtual technology to design cars since 2000.
We estimate 6mn engineers in the US, Europe and Japan according to data from the US
Bureau of Labor, Eurostat, and Statistics Japan.
While large automotive companies might have the resources to develop their own VR
software, not all engineers have this access. Engineering software needs to be developed
by specific industry and there could be a learning ramp to use the software and adjust
engineering techniques.
The global engineering software market is $20bn in 2015 according to Research and
Markets.
We estimate $1.5bn in software revenue in 2020 and $4.7bn in 2025. To size the
market, we consider the number of engineers that could use VR/AR and the annual
subscription cost of the software.
 Users: In our base case, we estimate that 1mn engineers use VR/AR technology in
2020 and 3.2mn in 2025.
 Annual subscription fee: As mentioned, computer-aided design (CAD) software
for architects and engineers can range from $1,000-$5,000 per year and we use this
as a comp for VR engineering software, which we conservatively assume costs
$1,500.
Exhibit 28: Estimating the potential of a VR/AR engineering software market
($ in mn, users in 000s)
Source: Goldman Sachs Global Investment Research.
2016E 2017E 2018E 2019E 2020E 2021E 2022E 2023E 2024E 2025E
Engineering VR/AR users (000s) 200 600 900 1,000 1,350 1,755 2,194 2,633 3,159
% yoy 200% 50% 11% 35% 30% 25% 20% 20%
Annual subscription fee ($) $0 $1,500 $1,500 $1,500 $1,500 $1,500 $1,500 $1,500 $1,500 $1,500
VR/AR engineering revenue $0 $300 $900 $1,350 $1,500 $2,025 $2,633 $3,291 $3,949 $4,739
% yoy 200% 50% 11% 35% 30% 25% 20% 20%
The challenges
The market disrupted
Sizing the revenue opportunity
The potential user base
ENGINEERING
$4.7 billion (2025E base case)
3.2 million users
• Potential to disrupt the computer-aided design and manufacturing markets
• Allows engineers to test scenarios and designs before products are made
• Challenges to adoption include software development, learning curve
January 13, 2016 Americas: Technology
Goldman Sachs Global Investment Research 33
Autodesk is using AR to enhance CAD
Designers can use AR to visualize 3D models in real-world context, avoiding costly errors and improving collaboration
The problem: While CAD software has come a long way in improving the design process, it still has its limits. For
example, CAD is still generally constrained by the need to work on a 2D monitor. This limits the ability to view full-sized
objects in real-world context and hinders true collaboration when multiple people are working on the same design.
The Autodesk solution: Autodesk is a leading design software company with $2.5bn in annual revenues and with
customers primarily in the architecture, engineering, construction and manufacturing verticals. We spoke with
Autodesk’s emerging technology division, which is working with Microsoft HoloLens to incorporate AR into CAD.
Autodesk’s VRED 3D visualization software product is currently used by auto makers to project things like doors and
colors onto clay car models.
Wide-ranging applications: Autodesk envisions AR improving the design of items as small as videogame controllers or
as large as buildings, with the view that having the true 1-to-1 scale that’s not possible in 2D can go a long way toward
avoiding errors. Autodesk also sees value in looking at a 3D model and having metadata information behind the CAD at
your fingertips. Finally, if two people are collaborating on a project, they are better able to work through issues as they
go as opposed to working on separate desktops and realizing there are issues when they come together. Given the wide
range of CAD use cases, we see potential for AR to impact Autodesk’s base of 5mn customers worldwide.
Potential bottlenecks: The computing power of AR systems needs to improve to run large CAD files.
Exhibit 29: Autodesk is working with Microsoft
Source: Autodesk
January 13, 2016 Americas: Technology
Goldman Sachs Global Investment Research 34
While we’ve outlined 9 core use cases for VR/AR where major markets can be disrupted,
we also see niche use cases developing like the following highlighted example in athletic
training.
STRIVR Labs is using VR headsets to train athletes
VR can provide a true game-like training experience
The problem: Athletic teams want to get as much practice as possible. But they are bound by time and resource
constraints, such as gathering players and staff at a practice facility during set times. In the case of training a
quarterback, this means assembling 21 other players to simulate in-game scenarios, as well as various coaching and
medical staff.
The STRIVR Labs solution: We spoke with STRIVR Labs, a privately-held startup co-founded in 2015 by former
Stanford University football players Derek Belch and Trent Edwards and Stanford professor Jeremy Bailenson (VR
expert and head of Stanford’s Virtual Human Interaction Lab). STRIVR builds an inventory of on-field scenarios by using
multitudes of cameras to shoot from various angles, enabling a player to get the full 360-degree in-game perspective
(compared with the 3rd-party POV enabled by watching game film). STRIVR uses real video as opposed to animations
or CGI because its research has shown that the brain scientifically "shuts off" if it isn't visualizing the real human game.
VR enables players to get realistic practice reps anywhere they can connect a head mounted device.
Value proposition driven by on-field results: Quarterback Kevin Hogan’s and Stanford’s overall offensive statistics
improved in many areas subsequent to Hogan’s use of VR training, including pass completion percentage and overall
points per game.
STRIVR has contracts in place with 6 of 32 NFL teams and 12 collegiate teams. The startup also has deals in place for
other sports, including three teams in the DC metro area.
Potential bottlenecks: There is a challenge in virtualizing scenarios where the player is moving a lot. Current use cases
are for practicing relatively stationary positions such as a quarterback in football or a goalie in soccer.
Exhibit 30: STRIVR enables quarterbacks to get realistic practice reps off the field
Source: STRIVR Labs
January 13, 2016 Americas: Technology
Goldman Sachs Global Investment Research 35
Details behind our hardware forecasts
In this section, we lay out the details underlying our three hardware forecast scenarios
introduced in the “Our hardware and unit forecasts” section from earlier in this report.
Building a framework for volume adoption
1. We begin by laying out our “accelerated uptake”, base, and “delayed uptake”
scenarios for HMD shipments in the medium-term (2015-2020). For this period, we
believe it is important to understand specific players, applications and end markets
that could adopt virtual/augmented reality HMDs. As such, we see a bottom-up
forecast as more suitable and contemplate three penetration scenarios into (1)
console and PC gamers, (2) the Samsung Galaxy installed base, (3) the high-end
TV installed base, and (4) enterprise markets per our use cases (e.g., healthcare,
engineering).
2. Using our base case scenario for HMD shipments through 2020 described above,
we then lay out three scenarios for longer-term shipments (2020-2025). We believe
in the long term, virtual/augmented reality has an opportunity to become the next
major computing platform. As such, we see a top down-approach using the mass
adoption curves of past computing platforms as more appropriate to gauge the
growth potential for this period. We contemplate scenarios which mirror the mass
adoption rates of smartphones (accelerated uptake case), tablets (base case) and
PCs (delayed uptake case).
Exhibit 31: We believe VR/AR could be the next computing platform if technology barriers
are overcome
Framework to size the HMD hardware unit growth
Source: Goldman Sachs Global Investment Research.
January 13, 2016 Americas: Technology
Goldman Sachs Global Investment Research 36
1. Medium-term hardware forecast
The following exhibit outlines our unit shipment forecasts by type: game console and PC
games, Samsung Galaxy smartphones, TV and other vertical markets.
Exhibit 32: We assume 43mn headset shipments in our base case by 2020
Our VR headset estimates
Source: Goldman Sachs Global Investment Research
VR gaming hardware market
The gaming industry has seen growth in two directions over the past 5 years. The
emergence of online multiplayer games like “Call of Duty” has created a sticky and
growing user base of over 60mn hardcore console users, while the proliferation of
smartphones has opened up a gaming market for billions. We note that gamers have been
interested in VR in the past and in 1995 Nintendo sold 770k units of the Virtual Boy console
in its first year but the technology was limited and the product was discontinued the
following year. Since 1995, VR has made significant advances and we don’t expect the
technology to let gamers down in 2016.
The following exhibit shows the active user base for PS4, Xbox One, and Steam. Adoption
of PlayStation 4 has been the fastest of any of the PlayStation branded consoles in history.
We estimate that the PlayStation and Xbox franchises collectively have 188mn of the global
console installed base by 2020 (we assume hardware renewal along the way). In terms of
active users, we also considered the presence of Steam, which is a PC gaming platform
operated by Valve Corporation. In 2015, Valve claimed that Steam had 125mn active users,
although the term “active user” was not defined. According to company statistics, the
platform does have 10mn log-ins per day, which we assume is comparable to the monthly
active user base of the console platforms.
3.8
9.6
20.2
30.9
42.9
6.8
13.3
30.1
44.4
57.0
2.1
5.1
7.6
16.3
27.1
0
10
20
30
40
50
60
2016E 2017E 2018E 2019E 2020E 2016E 2017E 2018E 2019E 2020E 2016E 2017E 2018E 2019E 2020E
VRheadsetunits(mn)
Other vertical markets
TV add-on
GearVR
Console and PC
Gaming
Base case Delayed uptakeAccelerated uptake
January 13, 2016 Americas: Technology
Goldman Sachs Global Investment Research 37
Exhibit 33: Installed base by platform
Active userbase (monthly active users for PS4/Xbox, undefined by Steam)
Source: Company data, IDC, Goldman Sachs Global Investment Research
We define hardcore gamers as people who play over 15 hours of games per week, with IDC
revealing 30% of PS4 and Xbox One users fall into this category. In 2014, NPD Group
reported there were 34mn core gamers on PlayStation 3 & 4, Xbox One & 360, PC, and Mac
who played an average of 22 hours of gaming per week.
Base case. Given the 30% ratio of the console installed base consisting of hardcore gamers,
we set this as the 5 year-term penetration goal of VR headsets.
We favor Sony’s PlayStation platform as an initial driver of VR penetration due to the high
concentration of hardcore gamers on the platform, the likely seamless integration of the VR
and host machines (due to the same company designing and selling the VR, software, and
hardware), and content availability. Sony has announced its flagship racing title,
GranTurismo, will be available on PSVR. Steam, in our view, is second most likely to
penetrate VR gaming, with wide availability of content and its collaboration with HTC and
Oculus.
Exhibit 34: 30% adoption would imply the conversion of most hardcore users
Our assumption of VR gamers as % of console active users
Source: Goldman Sachs Global Investment Research
The following exhibit highlights unit shipment assumptions for 4 major players in VR
gaming.
100 
125  141  148  155  163  171  180 
4 
18 
35 
50 
65 
79 
94 
105 
4 
11 
18 
24 
31 
40 
47 
52 
0
50
100
150
200
250
300
350
400
2013 2014 2015E 2016E 2017E 2018E 2019E 2020E
Active users (mn )
Xbox One (and later)
PlayStation 4 (and later)
Steam
3%
30%
1%
9%
1%
15%
0%
5%
10%
15%
20%
25%
30%
35%
2016E 2017E 2018E 2019E 2020E
PlayStation 4
Xbox One
Steam
January 13, 2016 Americas: Technology
Goldman Sachs Global Investment Research 38
Exhibit 35: Our assumptions on VR gaming
Source: Company data, Goldman Sachs Global Investment Research
Console and PC Gaming 2015E 2016E 2017E 2018E 2019E 2020E
12/2015 12/2016 12/2017 12/2018 12/2019 12/2020
Global shipment
PlayStation 4 (and later) 18,700 18,000 18,000 18,000 17,500 17,000
Xbox One (and later) 7,490 8,000 8,500 9,000 8,000 7,500
Steam - N/A
VR user base as % of total
PlayStation 4 0% 3% 7% 15% 22% 30%
Xbox One 0% 1% 2% 5% 7% 9%
Steam 0% 1% 3% 6% 10% 15%
VR gaming users by platform (000s)
PlayStation 4 0 1,511 4,543 11,807 20,589 31,648
Xbox One 0 122 622 2,006 3,264 4,673
Steam 0 1,481 4,664 9,794 17,139 26,993
Other PC platforms 0 491 708 4,099 6,331
Total 0 3,114 10,320 24,314 45,090 69,646
VR users by device(000s)
PlayStation VR 0 1,511 4,543 11,807 20,589 31,648
Xbox One (device not determined) 0 122 622 2,006 3,264 4,673
Oculus 0 444 1,424 3,059 9,241 19,828
HTC Vive 0 1,036 3,731 7,443 11,997 13,497
Total 0 3,114 10,320 24,314 45,090 69,646
New headset shipment (000s)
PlayStation VR 0.0 1,511.2 3,031.9 7,263.4 8,782.2 11,059.2
Xbox One (device not determined) 0.0 122.2 499.8 1,383.9 1,257.7 1,409.8
Oculus 0.0 444.2 980.0 1,634.5 6,182.1 10,587.5
HTC Vive 0.0 1,036.4 2,694.5 3,712.2 4,554.0 1,499.6
Total 0 3,114 7,206 13,994 20,776 24,556
VR user base as % of total
PlayStation 4 0% 3% 7% 15% 22% 30%
Xbox One 0% 3% 7% 15% 22% 30%
Steam 0% 3% 7% 15% 22% 30%
VR gaming users by platform (000s)
PlayStation 4 0 1,511 4,543 11,807 20,589 31,648
Xbox One 0 733 2,177 6,018 10,257 15,578
Steam 0 4,442 10,882 24,484 37,705 53,987
Other PC platforms 0 880 1,269 6,855 10,121
Total 0 6,686 18,482 43,577 75,406 111,334
VR users by device(000s)
PlayStation VR 0 1,511 4,543 11,807 20,589 31,648
Xbox One (device not determined) 0 733 2,177 6,018 10,257 15,578
Oculus 0 1,332 3,056 7,145 18,167 37,115
HTC Vive 0 3,109 8,705 18,608 26,394 26,993
Total 0 6,686 18,482 43,577 75,406 111,334
New headset shipment (000s)
PlayStation VR 0.0 1,511.2 3,031.9 7,263.4 8,782.2 11,059.2
Xbox One (device not determined) 0.0 733.1 1,444.0 3,840.8 4,239.2 5,320.8
Oculus 0.0 1,332.5 1,724.0 4,088.9 11,021.2 18,948.0
HTC Vive 0.0 3,109.1 5,596.3 9,902.3 7,785.8 599.9
Total 0 5,953 10,352 21,255 27,589 30,607
VR user base as % of total
PlayStation 4 0% 2% 4% 5% 7% 10%
Xbox One 0% 0% 0% 0% 0% 0%
Steam 0% 1% 2% 3% 6% 10%
VR gaming users by platform (000s)
PlayStation 4 0 756 2,272 3,936 6,551 10,549
Xbox One 0 0 0 0 0 0
Steam 0 740 2,332 4,897 10,283 17,996
Other PC platforms 0 230 265 1,683 2,854
Total 0 1,496 4,834 9,097 18,518 31,399
VR users by device(000s)
PlayStation VR 0 756 2,272 3,936 6,551 10,549
Xbox One (device not determined) 0 0 0 0 0 0
Oculus 0 222 697 1,440 5,797 10,053
HTC Vive 0 518 1,865 3,722 6,170 10,797
Total 0 1,496 4,834 9,097 18,518 31,399
New headset shipment (000s)
PlayStation VR 0.0 755.6 1,516.0 1,663.9 2,615.5 3,998.4
Xbox One (device not determined) 0.0 0.0 0.0 0.0 0.0 0.0
Oculus 0.0 222.1 474.5 743.7 4,356.5 4,256.0
HTC Vive 0.0 518.2 1,347.3 1,856.1 2,448.4 4,627.4
Total 0 1,496 3,338 4,264 9,420 12,882
BaseCaseAcceleratedDelayeduptakeAssumptions
January 13, 2016 Americas: Technology
Goldman Sachs Global Investment Research 39
Accelerated uptake case: An accelerated uptake case scenario could happen if VR
becomes a killer device for games and results in high penetration. In the base case scenario,
we assumed a case where 30% of gamers (equivalent to the proportion of hardcore gamers
on PS4 and Xbox One) would adopt VR headsets on the most integrated platform, PS4.
Penetration on other platforms we assumed would be lower. For the accelerated uptake
case, we assume that all hardcore gaming platforms (PS4, Xbox One, Steam, and other PC
platforms) would seamlessly integrate VR headsets into the gaming experience and
achieve 30% penetration. In the accelerated case, we assume a 2020E global VR installed
base at 111mn, vs. 2015 global console gaming population of 378mn, and 706mn PC
gaming population.
Delayed uptake case: In this case, we assume only 10% of PS4 users and Steam/PC
users adopt virtual reality. Xbox One will not have a VR headset in this case. This case may
be realized if cyber-sickness and content availability remain as issues. The installed base
will remain small in 2020 in this case, at 32mn.
Gear VR hardware market
Samsung announced a partnership with Oculus and introduced Gear VR in September
2014. The virtual reality headset uses the Samsung Galaxy smartphone for its processor
and display, while using Oculus for the software. Unlike Oculus Rift and PlayStation VR,
Samsung’s Gear VR headset does not need to be plugged into a computer, as it is powered
by a smartphone.
The Gear VR for Note 4 only works with the Galaxy Note 4 and the Gear VR for S6 only with
Galaxy S6 and Galaxy S6 Edge, as both Gear VR models are made to fit only the exact size
of each smartphones. Smartphones are inserted and snapped to the front of the Gear VR
and act as its display as well as processor. Users are able to experience a 96 degree
viewing angle with a 360-degree panoramic view with the device. Currently, both Gear VRs
for Note 4 and S6 are sold at $99 down from an original price of $199. We note that both
amazon.com and Best Buy sold out of Samsung’s new headsets 48 hours after consumer
shipments began in November 2015, an indication of strong demand at the low price point.
Samsung does not disclose the number of Gear VR sold or shipped as the market is still
small and the percentage of the company’s total sales is negligible.
Base case: We believe Samsung will strategically focus more on VR volume growth to
gain share, driven by an aggressive pricing strategy. As such, we expect Samsung’s Gear
VR shipments will increase from around 0.1mn in 2015 to around 12mn in 2020 in our base
case.
Accelerated uptake case: In the accelerated case, we assume the Gear VR attachment
rate will increase to 5% by 2020 (vs. 3% for the base case), driven by either better demand
from consumers or Samsung’s more aggressive pricing strategy. In this case, we expect
Gear VR shipments will reach 20.3mn in 2020, 67% higher than our base case scenario.
Delayed uptake case: In this case, we assume the Gear VR attachment rate will reach
only 2% by 2020 (vs. 3% for the base case), driven mostly by weaker demand and lack of
killer content for Gear VR. In this case, we expect Gear VR shipments will reach 8.1mn in
2020, roughly 33% lower than our base case scenario.
January 13, 2016 Americas: Technology
Goldman Sachs Global Investment Research 40
Exhibit 36: Gear VR shipments to reach 12mn units by 2020
Gear VR shipment forecast from 2015-2020 (000)
Source: Goldman Sachs Global Investment Research.
High-end TV penetration
We believe that virtual reality HMDs could serve as an incremental viewing experience for
the high-end consumer segment of the TV market. Even when viewing regular content
(non-virtual reality), HMDs could be used as a large virtual screen (i.e. >100” screen) to
watch the traditional content. However we think the impact to the traditional TV or large
display market could be limited as it is not a shared experience and could create discomfort
for long periods of usage. Therefore, we think that HMDs should be viewed as incremental
to TV and base our 3 scenarios on varying penetration.
Base case: We estimate that HMDs could reach around an 8% penetration of the large
screen TV market (>60”) by 2025 assuming that only high-end consumers that own a large
TV would want to have a personalized virtual screen.
Accelerated uptake case: For the accelerated case, we assumed VR could reach a 10%
penetration of the 60” plus LCD TV market. We kept our penetration rate scenario more
conservative than the 50% penetration of 4K, as HMDs do not replace functions of TV.
Delayed uptake case: In this case, we assumed the penetration rate to be lower at 3%.
TV use cases could be slow to adapt if film makers and TV program makers are reluctant to
develop content.
GearVR 2015E 2016E 2017E 2018E 2019E 2020E
12/2015 12/2016 12/2017 12/2018 12/2019 12/2020
Galaxy Smartphone Attachment
Galaxy 6S shipment 39,500 0 0 0 0 0
Galaxy Note 4 shipment 12,500 0 0 0 0 0
Galaxy SP VR compatible models shipment 9,000 61,300 63,108 66,263 69,576 73,055
Galaxy SP VR compatible installed base 72,000 133,300 196,408 262,671 332,247 405,302
GearVR attachment % 0% 0% 1% 2% 2% 3%
GearVR installed base 59 192 1,174 5,114 11,759 23,918
Gear VR shipment 58 133 982 3,940 6,645 12,159
Galaxy Smartphone Attachment
Galaxy 6S shipment 39,500 0 0 0 0 0
Galaxy Note 4 shipment 12,500 0 0 0 0 0
Galaxy SP VR compatible models shipment 9,000 61,300 63,108 66,263 69,576 73,055
Galaxy SP VR compatible installed base 72,000 133,300 196,408 262,671 332,247 405,302
GearVR attachment % 0% 0% 1% 3% 4% 5%
GearVR installed base 66 333 1,904 8,471 21,760 42,026
Gear VR shipment 65 267 1,571 6,567 13,290 20,265
Galaxy Smartphone Attachment
Galaxy 6S shipment 39,500 0 0 0 0 0
Galaxy Note 4 shipment 12,500 0 0 0 0 0
Galaxy SP VR compatible models shipment 9,000 61,300 63,108 66,263 69,576 73,055
Galaxy SP VR compatible installed base 72,000 133,300 196,408 262,671 332,247 405,302
GearVR attachment % 0% 0% 0% 0% 1.0% 2.0%
GearVR installed base 37 130 523 1,574 4,896 13,002
Gear VR shipment 36 93 393 1,051 3,322 8,106
BaseCaseAcceleratedDelayeduptake
January 13, 2016 Americas: Technology
Goldman Sachs Global Investment Research 41
Exhibit 37: HMDs could see 8% penetration of the high-end TV or home projector market
by 2020
HMD shipment forecast for the home entertainment market from 2015-2020
Source: Goldman Sachs Global Investment Research.
2. Long-term hardware forecast
To understand the longer term adoption of virtual/augmented reality HMDs for the period
from 2020-2025, we draw from the adoption patterns of major computing platforms
(desktop, notebook and smartphone) in the past 20 years. We note that historically, the
level of mobility has been a key factor in determining the long-term trajectory for these
platforms. We look at the growth rates of the major computing devices from mass
adoption to their maturity, as the growth rates in the early stages could be misleading due
to a very small base. We defined entering into the mass adoption phase by surpassing
50mn units in annual shipments for desktops and notebooks, and 300mn units for
smartphones. Maturity is defined at the peak of annual shipments. By capturing these
timeframes from mass adoption to maturity, we found that desktop/notebook/smartphone
have experienced a CAGR of 10%, 24% and 43% respectively.
1. Base case – Notebook scenario. To gauge the long term potential of the HMD
hardware market by year 2025, we defined the notebook growth rate as our base case
scenario, assuming HMDs will have a great VR user experience but limited by mobility
(battery life and/or cellular connectivity). In this scenario, we apply the historical
notebook mass adoption growth rate of 20%-25% to the HMD long term growth rate.
We assume that HMDs gain wider popularity as VR/AR technology improves over time,
but are limited by mobility and battery life. Hence, the use cases would be mostly
confined to stationary mobility environments (i.e. Livingroom mobility).
2. Accelerated uptake case – Smartphone scenario. To gauge the long term
potential of the HMD hardware market by 2025, we used smartphone growth rates as
our accelerated uptake scenario, assuming HMDs will become highly mobile and as
such enable a great VR user experience. In this scenario, we take the HMD base-case
units assumption in 2020 and apply a 1.15 multiplier to form the starting year (2021)
estimates. Then we apply the historical smartphone mass adoption growth rate of 40-
45% to the HMD long term growth rate. We assume that HMDs evolve to a generic
computing platform by 2025, as the user experience of VR/AR technology improves
TV Add-on 2015E 2016E 2017E 2018E 2019E 2020E
12/2015 12/2016 12/2017 12/2018 12/2019 12/2020
TV add-on (000s)
Global LCD TV shipment 220,000 220,000 220,000 220,000 220,000 220,000
>60" segment 8,800 8,800 8,800 8,800 8,800 8,800
Home projector market 2,100 2,100 2,100 2,100 2,100 2,100
VR share in large screen 0% 3% 5% 6% 7% 8%
VR installed base 0 327 872 1,526 2,289 3,161
VR headset shipment 0 327 545 654 763 872
TV add-on (000s)
Global LCD TV shipment 220,000 220,000 220,000 220,000 220,000 220,000
>60" segment 8,800 8,800 8,800 8,800 8,800 8,800
Home projector market 2,100 2,100 2,100 2,100 2,100 2,100
VR share in large screen 0% 4% 5% 6% 9% 10%
VR installed base 11 392 883 1,537 2,463 3,553
VR headset shipment 10 382 491 654 927 1,090
TV add-on (000s)
Global LCD TV shipment 220,000 220,000 220,000 220,000 220,000 220,000
>60" segment 8,800 8,800 8,800 8,800 8,800 8,800
Home projector market 2,100 2,100 2,100 2,100 2,100 2,100
VR share in large screen 0% 0% 0% 1% 2% 3%
VR installed base 0 8 51 160 378 705
VR headset shipment 0 8 44 109 218 327
BaseCaseAcceleratedDelayed
January 13, 2016 Americas: Technology
Goldman Sachs Global Investment Research 42
over time coupled with breakthroughs in cellular and battery technologies to enable
true mobility. In this scenario, we expect HMDs to proliferate from vertical markets to
horizontal market adoption.
3. Delayed uptake case – PC scenario. We assume that the user experience of VR/AR
technology improves at a slower pace due to hindrance in adoption from latency,
display, safety, privacy and other issues that prevent it from having a widespread
effect. As such we define the desktop growth rate as our delayed uptake scenario. In
this scenario, we take the HMD base-case unit assumption in 2020 and applied a 0.8
multiplier to form the starting year (2021) estimates. Then we apply the historical
desktop mass adoption growth rate of 7-10% to the HMD long term growth rate. As
such, we estimate that VR/AR HMDs will only be used in specific end markets (i.e.
games and other niche markets).
The improvement in processor power, lower price points and shrinking footprint (i.e.
Moore’s law) is the driver of hardware adoption. Since mobility has had an inherent
influence on device growth rates in the past, we delve into greater detail on what factors
contribute to true mobility and how these apply to VR/AR:
1) Display technology and computing power: We believe that cyber-sickness is the
most critical problem to solve as this has been one of the biggest barriers to adoption
in the past. Cyber-sickness occurs when there is a gap in user perceived positioning
and his/her field of view. In general, higher resolution (reduces visible pixels) and
quicker refresh rate (reduces latency) of the display combined with faster processing
power (improves graphics rendering), would generate a better user experience and
reduce cyber-sickness. Thanks to the evolution of smartphones, the panel resolution,
refresh rates and computing power, all have improved significantly over the past
decade to allow acceptable levels of user experience for virtual/augmented reality
HMDs to become a viable consumer product.
Moving forward, we believe display technology (resolution and refresh rate) and
processing power will continue to improve over time, similar to the last decade. As
such the user experience of virtual/augmented reality HMD should continue to improve.
2) Wireless connectivity: We have found that most of the HMDs launching in 2016 have
a “wired” configuration, which means there is a wire (i.e. HDMI cable) for data
transmission from the host system (i.e. PC) to the virtual reality HMD. We believe this
is due to large amounts of data needed to be transmitted on a higher frequency for
virtual reality graphics rendering, which the current WiFi / cellular data technologies
are not able to carry seamlessly. This limits the usage to a sitting down experience
similar to a desktop PC. Therefore we believe that for HMDs to take off, similarly like
the movement from desktop PC to notebook PC/smartphone, wireless connectivity will
need to be enabled. We believe with faster WiFi or cellular technologies to carry the
heavily loaded data transmission required for virtual reality graphics would be an
important enabler for mass adoption. On the other hand, new compression technology
could also accelerate the wireless connectivity if it is able to reduce data transmission
rates while maintaining the same quality.
3) All day battery life for true mobility: For virtual/augmented reality HMDs to reach
their full potential, we believe that having true mobility, similar to smartphone, would
be a requirement. To enable true mobility for HMDs, not only will it have to have
wireless connectivity as mentioned previously, it will also need to have all-day battery
life. Packing on large numbers of battery cells on a HMD would add more weight to the
headset and as such creates the potential for user discomfort.
Therefore we believe battery cell technology could be a critical bottleneck for true
mobility. On the other hand, fast charging could be a medium-term solution.
January 13, 2016 Americas: Technology
Goldman Sachs Global Investment Research 43
Building a framework for price reductions
Price declines have been the key catalyst for hardware adoption. In this section, we develop
a framework to estimate how HMD cost could decline over time as price elasticity should
have impact to end demand.
We draw upon the historical pattern of price declines from major end devices (desktops,
TVs, tablets, notebooks and smartphones) as a proxy of how virtual/augmented reality
HMDs could see prices decline over time. We believe it is sensible to use past pricing
decline rates of existing hardware devices as long term HMD growth rates could resemble
similar volume growth curves. We found that major hardware devices have experienced
pricing declines in the range of 5-10% annually over the past 20 years.
Exhibit 38: HMD price declines could resemble historical patterns from desktop, notebook
or smartphone
Historical price decline of major computing platforms
Source: Goldman Sachs Global Investment Research.
In addition, we also need a starting price point for the different types of HMDs. Given the
limited commercially available HMDs in the market today, we constructed BoM (bill of
material) estimates for major vendors (Sony, Oculus, HTC, Google Cardboard, Gear VR and
HoloLens) that are launching in 2016.
By applying the cost reduction rates to the estimated selling price, we project where the
pricing could drop for three types of HMDs by 2025. Based on this framework, retail pricing
of slide-on/discrete/integrated HMDs could be around USD$76, $221, and $581 with
annualized shipments of 25mn, 44mn, and 56mn respectively by 2025.
January 13, 2016 Americas: Technology
Goldman Sachs Global Investment Research 44
Exhibit 39: Retail pricing of slide-on/discrete/integrated HMDs could reach
USD$76/$221/$581 by 2025
HMD price decline estimates
Source: Goldman Sachs Global Investment Research.
VR/AR HMD Hardware Categories
We see four main devices that can be used to experience VR/AR: 1) a head-mounted
display, 2) a host system, 3) a tracking system and 4) a controller or controllers.
 Head-mounted-display (HMD) – A HMD is a hardware device that a user can place in
front of their eyes that allows the user to see into an augmented or virtual environment.
HMDs include Samsung’s Gear VR and Facebook’s Oculus Rift. Our VR/AR hardware
TAM only forecasts the revenue generated by HMDs.
 Host system – A host system refers to a device whose functionality is drawn upon by
a HMD, such as smartphones, PCs or game consoles. The way that a host system is
leveraged by a HMD depends on how sophisticated and autonomous the HMD is.
Furthermore, VR/AR vendors are inclined to work with host system makers to ensure a
rich VR/AR experience. This is forming new partnerships within the consumer
electronics industry. For example, Oculus’ Ready PC Program is a partnership program
initiated by Oculus to offer PC brand vendors certification of running Oculus Rift.
Several high-spec PC models have been approved by Oculus, including ASUSTeK
(2357.TW) and Alienware.
 Tracking system – Tracking systems can be integrated within an HMD and/or external
to an HMD. A tracking system helps create an active and immersive VR/AR experience
by capturing a user’s movements and feeds that information back into the HMD. For
example, if a user wearing an HMD looks up, the HMD’s screen also moves in that
direction, allowing the user to see what is directly above them. Hardware used for a
tracking system includes built-in sensors (commonly used in smartphones and tablet
PCs), gyroscopes, and magnetometers. To enhance the accuracy of their tracking
system, vendors may separate their sensors from the HMD and adopt internally-facing
cameras or LED lights.
 Controller(s) – Controllers are separate devices, such as the anticipated Oculus Touch
(expected 2H16) or Samsung Gear VR Rink, which are handheld devices that allow
users to track their motions or gestures intuitively. For example, a user can play a first
person shooter game and aim their controller at the enemy. In the HMD, it will appear
as if the weapon is directed at the enemy. Controllers may also have the ability to offer
haptic experiences, which allow the user to feel vibrations or force. For example, if the
enemy shoots back at the user’s right hand, the right hand controller would vibrate.
2015E 2016E 2017E 2018E 2019E 2020E 2021E 2022E 2023E 2024E 2025E
12/2015 12/2016 12/2017 12/2018 12/2019 12/2020 12/2021 12/2022 12/2023 12/2024 12/2025
Retail Price ($USD)
Slide-On 100$ 100$ 97$ 94$ 91$ 89$ 86$ 83$ 81$ 78$ 76$
Discrete 350$ 350$ 333$ 316$ 300$ 285$ 271$ 257$ 244$ 232$ 221$
Integrated 1,500$ 1,500$ 1,350$ 1,215$ 1,094$ 984$ 886$ 797$ 717$ 646$ 581$
January 13, 2016 Americas: Technology
Goldman Sachs Global Investment Research 45
HMD Hardware Components
We note the following hardware components that are often used in HMDs:
 Display: Most HMDs have one or two displays. We believe VR/AR HMDs will primarily
use 4K UHD or higher display resolutions. We also believe OLEDs will be the
prominent display technology for discrete VR devices, while a micro projection system
will be the prominent display technology for integrated AR devices (we explain the
difference between discrete and integrated in the following section).
o Resolution – Although it is challenging for the human eye to distinguish details
beyond 2K QHD on smartphones, 4K UHD and higher display resolutions will be
able to substantially enhance VR/AR viewing experiences. Accordingly, we believe
incremental demand for VR/AR will translate into higher demand for UHD display
panels.
o OLEDs – OLEDs have an advantage over LCDs, due to faster refresh rates, creating
less latency and therefore less cyber-sickness. The PlayStation VR uses a 5.7”
OLED display at a 1,920 x 1,080 resolution while Facebook’s Oculus Rift screen is
reported to be 1,080 x 1,200 resolutions per eye (i.e. 2,160 x 1,200 in total) using
OLED panels.
o Micro Projection Systems – In integrated AR devices, we believe micro projection
systems will be the most used technology, which has been adopted by Google
Glass and we believe is likely to be adopted by Microsoft’s HoloLens. This opens
up opportunities for micro-display module makers such as Himax, which
manufactures LCoS micro-display modules for Google and Microsoft, reportedly.
 Processors: One or more processing units are commonly found in integrated AR
HMDs. We believe Microsoft HoloLens will have a high-end CPU (central processing
unit), GPU (graphic processing unit) and a new chip called HPU (holographic
processing unit) on the device. In order to support higher display resolutions, we
believe GPU performance for VR/AR will be improved. Slide-on and discrete HMDs do
not need their own processors, as they typically leverage a host system to run VR
games or applications.
 Sensors: Sensors can be place inside or external to a HMD. Eye and head tracking is
critical for better VR/AR user experience as it could reduce the latency of the image
refresh to match precisely with the viewer’s movement. The lower the latency, the
more real the virtual environment feels to the viewer, and less cyber-sickness. The
sensors used to measure movements include a: FOV (Field of View) depth sensor, front
facing camera, gyroscope, accelerometer, magnetometer, proximity and ambient light
sensor. Furthermore, for a discrete VR HMD, a position tracking system is also
important. Currently, each VR hardware vendor develops its own technology. Sony
uses its PlayStation camera as a position tracker, while Vive and Oculus have invented
their own technology.
 Cameras: Some VR/AR HMDs have front facing cameras for photo-taking, positional
tracking, environmental mapping or allowing users to see through the headset when
needed. Some AR HMDs adopt inner-facing cameras to sense the environment and
surrounding objects.
 Wireless connectivity: We believe there will be a wireless connection between the
HMD and controller(s). However, wireless connectivity between the HMD and PC/game
console still has many technological hurdles to overcome, in particular the high
resolution and refresh rates required.
January 13, 2016 Americas: Technology
Goldman Sachs Global Investment Research 46
 Memory/battery: While there is limited information available about memory and
battery requirements for HMDs, in the short term, we believe memory will be essential
for both VR/AR HMDs, and battery will be essential for AR integrated HMDs. First,
memory is needed to store/buffer VR/AR imagery/video during operation. Given VR/AR
uses relatively higher resolution content, we believe HMDs will require high NAND
density per device. In addition, we view improving GPU performance will lead to larger
DRAM contents per device. Second, battery life is crucial for an integrated HMD as it
does not leverage a host system for power. In addition, over the long run, as more
discrete VR HMDs will adopt wireless connection, battery life will be important to take
a VR HMD into a mobile environment.
 Lenses: FOV (field of view) of a VR HMD is positively correlated to the immersive VR
experience it can offer, as human FOV is up to 220 degrees horizontally. Aspheric
Fresnel lenses are being widely adopted in Slide-on and discrete VR HMDs as they can
have shorter focal length, implying higher magnifying rate and higher FOV, compared
to other forms of convex lenses. VR discrete HMDs to be released in 1H16, including
Oculus Rift, HTC Vive and PlayStation VR will adopt aspheric Fresnel lenses offering
FOV of 100-110 degrees. We expect FOV to keep increasing in the long run.
HMD Types, Vendors, BoM Costs and ASP Estimates
Below, we identify and describe three types of HMDs in the market today (slide-on, discrete
and integrated), based on their complexity of hardware and dependency on host machines.
We then describe vendors for each, followed by BoM costs and ASPs. We summarize our
BoM cost estimates by HMD below:
Exhibit 40: VR/AR HMD BoM cost summary
Source: Goldman Sachs Global Investment Research.
$20
$87
$500
$400
$350
$1,500
$0
$200
$400
$600
$800
$1,000
$1,200
$1,400
$1,600
$1,800
Google Cardboard Samsung Gear VR Oculus Rift HTC Vive Sony PSVR Microsoft HoloLens
Slide‐on Discrete Integrated
January 13, 2016 Americas: Technology
Goldman Sachs Global Investment Research 47
Slide-on HMDs
These are the most primitive and lowest priced HMDs. A smartphone can slide into the
HMD unit, which turns an original 2D display into 3D virtual reality. Slide-on HMDs have
the highest dependency on host systems (smartphones) as most components necessary to
perform VR are not built-in.
Vendors: Slide-on HMDs include Google Cardboard and Samsung Gear VR, which we
discuss below:
 Google Cardboard: Released in 2014, Google Cardboard was one of the pioneers of
VR hardware. It offers consumers the cheapest HMD solution (as low as ~US$20) but
inevitably, relatively low VR experience versus other HMD models. Google Cardboard
has relatively simple architecture compared to other HMD devices. It uses cardboard as
the structure of the HMD, which doesn’t have advanced sensors for head/motion
tracking as other devices do. It is extremely cheap to build, but offers a relatively poor
experience in our view when compared to higher-end devices. We believe this is an
entry gateway product for users to experience virtual reality with very low cost of
ownership.
 Samsung Gear VR: Samsung Gear VR was developed by Samsung in collaboration
with Oculus. Although its mechanism of offering VR experiences is similar to Google
Cardboard, Gear VR offers a better user experience with in-built head-tracking sensors,
enabling more accurate and lower-latency head tracking than purely relying on the
motion sensors in the smartphone. While Gear VR shares a similar fundamental
mechanism with Google Cardboard, adopting advanced 3D lenses, plastic casing and
adding in several sensors offers a superior VR experience but also increases the cost.
BoM Costs: We also estimate a BoM cost for a slide-on HMDs with similar specs to Gear
VR to be $80-$90.
ASPs: The most recent version of Samsung Gear VR (launched in 3Q15), is priced at $99.
We use this as a benchmark, and believe other to-be-released slide-on models will be
priced at around $100.
Discrete HMDs
Discrete HMDs are more sophisticated and contain more electronic components than slide-
on HMDs. The key difference in hardware is that discrete HMDs have their own displays
and may be equipped with processors, which offer simple computing capability. Although
they cannot function independently without support from host systems (similar to slide-on
HMDs), they open new opportunities in the VR market as the host system is no longer
limited to smartphones. Superior computing power of PCs and game consoles brings in
greater possibilities of developing a VR experience, such as gaming. Also, having basic
built-in computing power enables a discrete HMD to support a complex sensory system
and further fine tune visual/audio input from host machines. Together this offers superior
VR experiences to users.
Vendors: Discrete HMDs include Facebook Oculus Rift, HTC Vive and PlayStation VR,
which we describe below:
 Facebook Oculus Rift: This HMD is reported to be designed to adapt to Windows 10
PCs. We assume it will leverage the CPU of the host PC for primary processing.
However, it is reported that Oculus Rift will have a built-in processor to compute head-
tracking and positioning tracking. What’s special about Oculus Rift is its “Constellation
Positioning Tracker”, which consists of at least 40 IR LEDs on the HMD and a
standalone camera station. The mechanism of this tracking system is that the LEDs
emit infrared intermittently and the camera station, which sits in a corner of the room,
January 13, 2016 Americas: Technology
Goldman Sachs Global Investment Research 48
can sense detailed changes of IR light from the HMD. As the LEDs face different
directions, not only can the user’s position in a room be measured but also the user’s
orientation.
 HTC Vive: This is a discrete HMD co-developed by HTC (2498.TW) and Valve. Similar
to Oculus Rift, HTC Vive is reported to target PC users as well. As it mainly targets
gamers, it adopts slightly superior displays to Oculus Rift. However, we do not assume
HTC Vive to have a built-in chip and SSD storage as it has a different position tracking
system from Oculus Rift, which lowers its BoM cost a bit. We also assume that HTC
Vive’s lenses system is slightly cheaper than Oculus Rift as it might not adopt
adjustable dial design. The “Lighthouse” tracking system, developed by Valve, has an
opposite mechanism to the Constellation Tracking System. While the Constellation
system emits light from the HMD to a standalone camera, the Lighthouse emits light
from two standalone base stations to a number of light sensors on the HMD.
 Sony PlayStation VR: Unlike Oculus Rift and HTC Vive, PlayStation VR’s host system
will be a PlayStation 4 game console. PlayStation VR’s positioning tracker technology
is based on a PS (PlayStation) camera and LED lights on the HMD. To improve the
quality of input signal, Sony will separate the digital signal processing units into a PU
(processor unit) box, which can fine tune the digital signal from the game console and
send to the HMD and a TV. We assume PlayStation VR to have the lowest BoM cost
among the three discrete HMD models. The main gap comes from the fact that it does
not have an independent sophisticated positioning tracking system as it is likely to
leverage a PS camera to do the job. Similarly, being bundled with PS4, PlayStation VR
does not have to come with its own processing units, storage, battery and controllers.
These together drive the cost down.
BoM Costs: Oculus has said that it is selling Rift at its BoM cost and we expect Sony and
HTC to follow suit. That said, we believe the BoM for all three of these offerings can
decrease as the products gain scale. We estimate an average HMD discrete BoM of $350-
500, with Oculus at $500 (excluding our estimate for the cost of an Xbox controller and 2
games that come in the current package), HTC Vive at $400, and PSVR at $350.
ASPs: As we expect vendors to sell discrete HMDs at no gross profit to drive product
adoption, we assume ASPs in line with our BoM estimate at $350-500 which excludes
accessories and games that come in the retail package.
Integrated HMDs
Integrated HMDs have high computing power and sophisticated tracking capabilities.
Today, integrated HMDs are primarily AR HMDs. However, we believe that as the
technology gradually improves, more VR HMD models will also become integrated HMDs.
As an independent computing device, an integrated HMD will likely be equipped with a
complete set of components that together are higher-priced than a consumer PC. VR/AR
digital signals demand more computing power than traditional 2D graphics. And in the
case of AR, taking actual surroundings into consideration also requires substantial
computing hardware resources.
Vendors: Integrated HMDs include Microsoft HoloLens, which we describe below.
 Microsoft HoloLens: The 3 major components in a HoloLens are processors, displays
(micro projection systems) and cameras. First, Microsoft is reported to have adopted
Intel’s most powerful CPU, Atom Cherry Trail, which has a 2.7GHz clock rate and
supports wireless charging. GPUs and HPUs substantially increase the total cost
mainly because the chips are so unique that Microsoft is unlikely to gain economies of
scale in the short run. Second, for displays, Microsoft uses two HD micro projectors
January 13, 2016 Americas: Technology
Goldman Sachs Global Investment Research 49
(one for each side of the glass) to keep the lenses transparent. Google adopted liquid
crystal on silicon (LCoS) display modules for Google Glass and Microsoft is reportedly
using LCoS for HoloLens as well. Finally, HoloLens has at least 7 cameras to track the
motion of the user and make sense of the surrounding environment.
BoM Costs: An integrated HMD typically has superior specs to consumer PCs or smart
devices, which significantly increases the cost. For example, Microsoft’s yet to-be-released
HoloLens would adopt three processing units, which together cost approximately $375 in
our estimates. All-in, we estimate a BoM of $1,500.
ASPs: Taking HoloLens as a benchmark, we estimate integrated AR HMD models launched
in 2016 would be priced at around $1,500.
January 13, 2016 Americas: Technology
Goldman Sachs Global Investment Research 50
Virtual Reality and Augmented Reality Enablers
Alphabet (GOOGL, $745.34, CL-Buy)
Company profile
As the online advertising pioneer, we estimate Alphabet 2015 revenues of $75bn (+13%
yoy) with 90% as online advertising (referred to as Google) and 10% in non-core revenue.
Alphabet is known for its innovation edge with management saying it spends 10% of its
resources on non-core businesses. This non-core spend includes a number of initiatives
including Google Fiber (wireless services), Google Nest (Internet of Things), and Life
Sciences but the company has not specified the size or order of magnitude for these
individual initiatives.
Exposure to VR/AR
An innovator in augmented reality. We view Alphabet as one of three vendors focused
on augmented reality hardware along with Microsoft HoloLens and Magic Leap. Google
launched its augmented reality product Google Glass in 2013 but discontinued sales in
2015. Press reports speculate (WSJ, Engadget) that Google will launch a new version of
Glass, but the company has not confirmed. As discussed, we see strong business use cases
for AR and as the technology advances Google has strong potential to benefit given its
focus on the space.
Positioning for VR advertising. We see Google’s VR efforts to be positioning itself for a
virtual reality advertising market. Like Facebook has done on its app, Google has enabled
360-degree video on YouTube as another driver of adoption. Google has already
distributed 2mn Google Cardboard viewers (low cost devices costing ~$20) in an effort to
drive adoption of VR. In October 2015, Google distributed over 1mn Cardboard viewers for
free to New York Times subscribers and has developed over 100 virtual field trips for the K-
12 education market. Cardboard is a low-end VR experience as latency is significantly
higher than Oculus and we have yet to see signs of Google engaging in a higher-end VR
hardware market but don’t rule out the possibility.
Advanced Micro Devices (AMD, $2.39, Not Covered)
Company profile
AMD’s core business is computing and graphics processors, which it sells into the PC,
server, embedded and gaming markets. FactSet consensus estimates 2015 revenues of
$4.0bn (-28% yoy).
Exposure to VR/AR
AMD develops graphics processor technology that is required for VR gaming PCs, and
Mercury Research estimates that AMD held 25%-30% unit share of the discrete GPU market
in 1H15. The PC requirements for Oculus Rift specify that only high-end GPUs from AMD
and Nvidia will work, which currently ship at ASPs of ~$350 and higher. AMD has stated
that it has partnerships in place with several OEMs, headset manufacturers and software
developers.
January 13, 2016 Americas: Technology
Goldman Sachs Global Investment Research 51
Facebook (FB, $99.37, Buy)
Company profile
Facebook runs the leading social platform with 1.5bn monthly active users (MAU). We
estimate 2015 revenues of $17bn (+39% yoy) of which 95% is advertising.
Exposure to VR/AR
Initially focused on gaming charge with bigger aspirations on the horizon. In March
2014, Facebook announced the acquisition of virtual reality technology vendor Oculus for
$2bn with CEO Mark Zuckerberg saying the first initiative will be in immersive gaming but
that the vision is for Oculus to be extended to other experiences as a communications
platform. Oculus Rift is the company’s head-mounted display product with the first
developer kit launched in 2012, the second developer kit launched in 2014, and pre-orders
for the consumer version launched on 1/6/16 at a price of $599 and are expected to start
shipping in March.
Positioning for VR advertising. By developing an ecosystem of applications around
Oculus, Facebook would be well-positioned to take advantage of virtual reality advertising.
Much like the way TV, Internet, and mobile have changed the way companies connect with
their customers, virtual reality would do the same and as an innovator in the space
Facebook would be at the center of this transformation. We see Facebook trying to drive
virtual reality adoption primarily through its Oculus efforts and also note that the company
has enabled 360-degree video on its main app. Facebook has said it will sell Oculus Rift
headsets at cost, which would make Oculus margin-dilutive to Facebook’s P&L. That said,
given Facebook’s scale with our 2016 revenue estimate of $24bn and 2017 at $30bn, we
estimate that Oculus would be just 100-200bps dilutive to Facebook’s gross margins which
currently stand at 83%. If Facebook sold 400k Oculus headsets in FY16 for $599 at zero
gross profit, we estimate that Oculus would be 100bps gross margin dilutive and if 1mn
units were sold Oculus would be 200bps gross margin dilutive. We believe the incremental
longer-term advertising opportunity would offset this margin dilution as virtual reality
would equip Facebook with more user data driving better targeting across its platform and
new immersive VR ads which would likely come at higher CPMs.
GoPro (GPRO, $14.60, Neutral)
Company Profile
GoPro is the leading action camera vendor, with an estimated market share of over 50% of
the digital camcorder market. It sells capture devices under the HERO brand as well as
accompanying accessories. We estimate the company is on track to grow revenues 23%
yoy in 2015, though this is down from 41% growth in 2014 and we forecast a high-teens
percent decline in 4Q15. GoPro has stated that it plans to enter the drone market in 2016.
GoPro also creates, curates, and enables content creation through the use of its capture
devices, though direct monetization of the content remains fairly limited. GoPro has over
7.5mn Instagram followers and 3.6mn YouTube subscribers (and over 1bn views).
Exposure to Virtual Reality
As a leader in content creation and capture devices, we view GoPro as an enabler (and
potential beneficiary) of VR. GoPro currently offers spherical video capture by harnessing 6
cameras in a single mount (four on the sides and one on the top and bottom). In April 2015,
GoPro acquired Kolor, offering software to combine or stitch together multiple photos or
videos. According to GoPro’s press release, ‘spherical media enables a range of immersive
viewing experiences and is an essential building block of virtual reality. GoPro has also
partnered with Google, offering a mount with 16 cameras (the Google Odyssey). Overall,
GoPro currently sells the mount for professional applications, but expects to make a
consumer-ready version over time, which could present a larger monetization opportunity.
January 13, 2016 Americas: Technology
Goldman Sachs Global Investment Research 52
HTC Corporation (2498.TW, TWD70.70, Not Covered)
Company profile
HTC Corporation designs, manufactures, and sells smart devices, and provides after-sales
services worldwide. Over 90% of HTC’s revenue comes from smartphones while the rest,
10%, is from tablet PCs and PDAs. HTC had approximately 1%-2% unit shipments globally
in 2015 according to Gartner. The company also has expertise in system-level design of
smart devices and in-house production capabilities.
Exposure to VR/AR
HTC developed VR system technology by co-developing VR HMD with Valve, one of the
biggest PC game platform companies. HTC brings its research and development
experiences from smartphone technology into the VR HMD design while Valve provides its
software expertise from PC game development in creating virtual worlds. Valve’s online
platform has over 100mn members globally and sold over 3,500 PC games. In the near
term, HTC benefits by tapping into the videogame market by leveraging Steam’s
established PC game channel, distribution and installed base.
Largan Precision (3008.TW, NT$1,840.00, CL-Buy)
Company profile
Largan Precision Company Limited manufactures camera lens and optoelectronic
components such as VCM (volatility control mechanism) and OIS (Optical Image
Stabilization). The company has a leading position in lenses for consumer electronic
devices such as smartphones, tablet PCs, and projectors (>90% of sales). It also has
exposure in emerging lens applications such as car cameras and contact lenses. Largan’s
major clients include Apple (73% of 2015E sales), as well as major Android phone and
notebook PC brands. 2015E and 2016E pro forma sales totaled NT$59.1 billion (+29% YoY)
and NT$74.7 billion (+26% YoY), respectively.
Exposure to VR/AR
Leading technology applicable to VR lens. Largan has maintained its sustainable
leadership in miniaturized lens technology in the past. Capable of securing high yield rate
and maintaining superior performance to competitors, Largan has become the primary
source of supply of major consumer electronic brands, represented by its dominant market
share in smartphone plastic camera lenses. We believe this trend will continue in VR/AR
HMD lenses. Given the ability to produce a wide variety of lens products, Largan can meet
a range of requirements from different HMD makers. In our research on VR hardware,
plastic Fresnel convex lenses would be the mainstream VR HMD magnifying lenses. We
believe Largan’s expertise in plastic lenses could enable it to outperform its competitors
with superior performance by offering higher FOV (field of view) and reducing aberration
and light scattering, which boost the overall VR experience of the clients’ HMD.
VR lens to be a new addressable market for Largan. VR/AR will represent a large
addressable market for lens makers when the market takes off. In our accelerated uptake
case scenario, VR/AR HMD annual shipments would exceed 250mn units, implying at least
500mn units of magnifying lenses. Furthermore, cameras adopted on the HMDs as sensors
will also make this market even bigger. As mentioned in the previous paragraph, we
believe Largan’s leading technology would enable it to capture meaningful share of this
market. Although Largan’s management has not commented on any specific VR/AR project
as of yet, they did indicate that VR would be a new addressable market for them.
January 13, 2016 Americas: Technology
Goldman Sachs Global Investment Research 53
Microsoft (MSFT, $52.78, Neutral)
Company profile
Microsoft is a leading enterprise software company with 1.2bn Office users worldwide. We
estimate CY15 revenues of $91bn (-2% yoy).
Exposure to VR/AR
Potential in augmented reality. We see Microsoft having strong potential in the
augmented reality market as we see AR use cases more focused on the enterprise where
Microsoft has a widely-penetrated customer base. Microsoft is already partnering with
companies such as Autodesk to develop an engineering AR application and medical
schools (e.g., Case Western) for the healthcare use case. Further, Microsoft is a vendor that
seems closest to releasing an AR product to market with the company announcing that a
HoloLens developer’s kit will be launched in 2016 while Magic Leap and Google have yet to
announce product releases (though press outlets like the WSJ speculate that a new Google
Glass product is currently in development).
Nvidia (NVDA, $30.18, Sell)
Company profile
Nvidia’s core business is graphics processors, which it sells into the gaming, data center
and automotive end markets. We estimate 2015 revenues of $4.9 bn (+5% yoy), of which
50%-60% is gaming.
Exposure to VR/AR
Adoption of VR could catalyze GPU upgrade cycle, positive mix shift. We believe
Nvidia’s best-in-class graphics processor technology positions it well to benefit from the
adoption of VR technology longer term, although it is unclear to us to what extent VR will
drive total revenue growth over the medium term. Nvidia has partnerships in place with
approx. 250 companies to work on VR applications with its DesignWorks and GameWorks
platforms, including vendors such as Oculus and HTC. Most VR applications require high-
end GPUs (which currently ship at ~$350 and higher), which could catalyze a GPU refresh
cycle and/or mix shift toward products with higher ASPs and margins. Nvidia would also
stand to benefit if VR sees adoption amongst a broader set of customers in its
enterprise/professional markets.
Qualcomm (QCOM, $46.52, Buy)
Company Profile
Qualcomm is the leading smartphone cellular chipset and application processor provider,
with an estimated market share of about 60%s of CDMA/WCDMA/LTE devices. Its
customers include essentially all major handset and tablet companies, and many of the
emerging handset vendors as well. Qualcomm has led the LTE cellular baseband market
and also has a leading presence in the Wi-Fi market as a result of its 2011 acquisition of
Atheros. Beyond handsets and tablets, Qualcomm’s end markets include Wi-Fi access
points, automobiles, small cells, and healthcare, to name a few. Over two-thirds of
company revenues come from the sale of chipsets. Qualcomm’s licensing business
accounts for the remaining one-third of revenues; however, this segment accounts for over
two-thirds of operating profit given its high margins. Owning most of the IP behind
CDMA/WCDMA and much of LTE, Qualcomm gets a royalty from every device that uses its
technology.
January 13, 2016 Americas: Technology
Goldman Sachs Global Investment Research 54
Exposure to Virtual Reality
Qualcomm stands to benefit from the proliferation of connected devices, whether it be via
cellular, WiFi, Bluetooth, etc. Its application processor (AP) technology supports GPU and
CPU functionality. In October 2015, the company launched a reference design platform
designed specifically for advanced cameras (the Snapdragon 618 IP). This camera platform
supports video analytics, object and facial detection, multi object tracking, 4K HEVC video,
dual image signal processors (ISPs), battery efficiency, and multiple forms of connectivity
(LTE Cat 7, WiFi, GPS, Bluetooth). Qualcomm similarly has introduced a chipset targeting
consumer drones. While Qualcomm’s revenue exposure is dominated by smartphones and
tablets, virtual reality and image capture devices could become an adjacent market
opportunity. In late 2015, Qualcomm sold its Vuforia business, a developer ecosystem for
virtual reality applications, to PTC. Thus, we would not expect Qualcomm to participate in
software/applications of VR, but remain focused on chipset processors and connectivity.
Samsung Electronics (005930.KS, W1,146,000.00, Neutral)
Company profile
Samsung Electronics (SEC) is the world’s largest mobile phone and TV manufacturer. The
company is a producer of both hardware and components, and has four main operating
segments, including: IT & Mobile (46% of FY15E sales); Consumer Electronics (21% of
sales); Semiconductor (21% of sales), and Display Panel (12% of sales). Total company
sales in FY15E is expected to total W200tn (down 3% yoy), with an operating margin of
13%. We expect SEC to ship 395mn mobile phones (down 2% yoy) and 48mn TVs (down
10% yoy) in FY15E. We have a Neutral rating on the stock as we expect the structural
improvement it exhibited during the smartphone product cycle of 2010-13 to be limited in
the next couple of years.
Exposure to VR
Gear VR, a device compatible with high-end Galaxy phones: SEC announced a
partnership with Oculus and introduced the first Gear VR Innovator Edition in September
2014. The virtual reality headset uses the Samsung Galaxy smartphone for its processor
and display, while using Oculus for the software. Unlike Oculus Rift and PlayStation VR,
Samsung’s Gear VR headset does not need to be plugged into a computer, as it is powered
by a smartphone. Gear VR Innovator Edition for Note 4 only works with Galaxy Note 4 and
Gear VR Innovator Edition for S6 only with Galaxy S6 and Galaxy S6 edge, while the
consumer edition released in November 2015 works with four different Galaxy models
(Galaxy S6, Galaxy S6 edge, Galaxy S6 edge+, and Galaxy Note5). Each Gear VR models
are made to fit only the compatible smartphones, as the phones are inserted and snapped
to the front of the Gear VR and act as its display as well as processor. Users are able to
experience a 96 degree viewing angle with a 360-degree panoramic view with the device.  
Gear VR to enhance product loyalty. The innovator editions of the Gear VR used to be
sold at $199.99, while the price of the recently launched consumer edition was lowered to
$99.99. We believe this is not a hefty price in itself, but for a non-Samsung phone user, the
burden will likely be on the high price needed to pay for a compatible Samsung high-end
smartphone. In this regard, while Gear VR has the potential to become a device that
attracts new customers to Samsung smartphones with the increasing number of contents
offered and entertainment value it adds, at the current stage we believe Gear VR is more of
a product that enhances product loyalty for current Samsung smartphone users. We expect
that sales contribution from Gear VR will be limited for the next couple of years, but it
could still become a product that prevents switching out of SEC’s high-end smartphone.
January 13, 2016 Americas: Technology
Goldman Sachs Global Investment Research 55
Sony (6758.T, ¥2,675.00, CL-Buy)
Company profile
Sony is a large entertainment and consumer electronics conglomerate, comprised of a
games business which owns and operates the PlayStation platform and internal game
studios (22% of operating profits in 2015, 26% by 2020), and pictures and music businesses
where Sony is one of the largest Hollywood film studios, TV program distributors, and one
of the top 3 music record companies/publishers in the world (23% of operating profits in
2015, 30% by 2020). In the electronics businesses, Sony has the challenged smartphone
business, improving yet risky home entertainment, and stable camera businesses. Three
consumer electronics businesses in aggregate are breakeven in 2015, and we expect 7% of
group operating profits to be generated from trimmed down electronics business. Sony’s
device business includes the CMOS image sensors, we expect profit contribution of 21% in
2015, 18% in 2020. Our bullish stance on Sony is based on the increasing weight of the
entertainment business and valuation rerating of Sony from tech conglomerate to a
collection of top tier entertainment assets.
Exposure to VR
Decades of research to a promising PSVR launch. As a leading provider of audio visual
products, Sony has long been providing VR products, starting with Glasstron in 1990s,
which worked with PCs and re-created 50+ inch screen in front of user’s eyes. In 1H2016,
Sony plans to release the PlayStation VR, the first high-end virtual reality headset to work
with a contemporary gaming console.
We are confident in the PlayStation VR launch for 3 reasons. 1) Large installed base of the
host machine: PlayStation 4 has been the fastest penetrating console of any of PlayStation
series to date, and we estimate the current installed base is over 40mn. Activity and
engagement is high, with 30% of users being hardcore, and 90%+ being active gamers; 2)
Availability of internal as well as third party content: Sony intends to launch Gran Turismo
Sports, the latest of Sony’s flagship racing games on PSVR. Also, multiple third parties
developers have expressed interest and have begun early work on launching major titles
on virtual reality; 3) Good developer environment: we believe proliferation of third party
game engines, i.e. Unity and Unreal, and their compatibility with both PSVR and
competitor devices like Oculus will significantly lower the entry barrier for third party
developers.
We believe PlayStation VR will spread gradually as a device for hardcore gamers to dive
into immersive gaming environment. We expect the 2020 PSVR installed base to be 31mn,
on 105mn PlayStation 4 installed base. We assume PSVR shipments start gradually with
1.5mn units in 2016 (Sony revenue of ¥60bn in 2016), gradually exceeding 10mn by 2020.
We do not assume PSVR hardware sales will be a profit driver for Sony. Rather, they will
be positioned as differentiator against Xbox and Steam platforms, and also help to extend
the console cycle further.
January 13, 2016 Americas: Technology
Goldman Sachs Global Investment Research 56
Disclosure Appendix
Reg AC
We, Heather Bellini, CFA, Wei Chen, Masaru Sugiyama, Marcus Shin, Shateel Alam and Daiki Takayama, hereby certify that all of the views
expressed in this report accurately reflect our personal views about the subject company or companies and its or their securities. We also certify that
no part of our compensation was, is or will be, directly or indirectly, related to the specific recommendations or views expressed in this report.
Unless otherwise stated, the individuals listed on the cover page of this report are analysts in Goldman Sachs' Global Investment Research division.
Investment Profile
The Goldman Sachs Investment Profile provides investment context for a security by comparing key attributes of that security to its peer group and
market. The four key attributes depicted are: growth, returns, multiple and volatility. Growth, returns and multiple are indexed based on composites
of several methodologies to determine the stocks percentile ranking within the region's coverage universe.
The precise calculation of each metric may vary depending on the fiscal year, industry and region but the standard approach is as follows:
Growth is a composite of next year's estimate over current year's estimate, e.g. EPS, EBITDA, Revenue. Return is a year one prospective aggregate
of various return on capital measures, e.g. CROCI, ROACE, and ROE. Multiple is a composite of one-year forward valuation ratios, e.g. P/E, dividend
yield, EV/FCF, EV/EBITDA, EV/DACF, Price/Book. Volatility is measured as trailing twelve-month volatility adjusted for dividends.
Quantum
Quantum is Goldman Sachs' proprietary database providing access to detailed financial statement histories, forecasts and ratios. It can be used for
in-depth analysis of a single company, or to make comparisons between companies in different sectors and markets.
GS SUSTAIN
GS SUSTAIN is a global investment strategy aimed at long-term, long-only performance with a low turnover of ideas. The GS SUSTAIN focus list
includes leaders our analysis shows to be well positioned to deliver long term outperformance through sustained competitive advantage and
superior returns on capital relative to their global industry peers. Leaders are identified based on quantifiable analysis of three aspects of corporate
performance: cash return on cash invested, industry positioning and management quality (the effectiveness of companies' management of the
environmental, social and governance issues facing their industry).
Disclosures
Coverage group(s) of stocks by primary analyst(s)
Heather Bellini, CFA: America-Software. Wei Chen: Asia Pacific Technology. Masaru Sugiyama: Japan Internet and Games, Japan-Consumer
Electronics. Marcus Shin: Korea Technology. Daiki Takayama: Japan-Electronic Components.
America-Software: Adobe Systems Inc., Akamai Technologies Inc., Alarm.com Holdings, Alphabet Inc., Atlassian Corp., Autodesk Inc., Citrix Systems
Inc., Facebook Inc., Microsoft Corp., Mimecast Ltd., MobileIron Inc., Oracle Corp., Rackspace Hosting Inc., Red Hat Inc., RingCentral, Salesforce.com
Inc., VMware Inc., Workday Inc..
Asia Pacific Technology: AAC Technologies, Acer, Advanced Semiconductor Engineering, ASUSTeK Computer, Casetek Holdings, Catcher
Technology, Compal Electronics, Hon Hai Precision, Largan Precision, Lenovo Group, Pegatron, Quanta Computer, Siliconware Precision Industries,
TPK Holding, Wistron.
Japan Internet and Games: Bandai Namco Holdings, Capcom, CyberAgent, DeNA Co., Gree, Kakaku.com, Konami, mixi, Nexon, Nintendo, Rakuten,
Sega Sammy Holdings, Square Enix Holdings, Yahoo Japan.
Japan-Consumer Electronics: Panasonic Corporation, Sony.
Japan-Electronic Components: Alps Electric, Hirose Electric, Ibiden, IRISO Electronics, Japan Aviation Electronics Industry, Japan Display Inc.,
Kyocera, Mabuchi Motor, Minebea, Mitsumi Electric, Murata Mfg., NGK Insulators, NGK Spark Plug, Nichicon, Nidec, Nippon Ceramic, Nippon
Chemi-Con, Nitto Denko, Pacific Industrial, Shinko Electric Industries, Taiyo Yuden, TDK.
Korea Technology: Samsung Electro-Mechanics, Samsung Electronics, Samsung SDI Co., Samsung SDS Co., Seoul Semiconductor, SK Hynix Inc..
Company-specific regulatory disclosures
Compendium report: please see disclosures at http://www.gs.com/research/hedge.html. Disclosures applicable to the companies included in this
compendium can be found in the latest relevant published research
Distribution of ratings/investment banking relationships
Goldman Sachs Investment Research global coverage universe
Rating Distribution Investment Banking Relationships
Buy Hold Sell Buy Hold Sell
Global 31% 53% 16% 63% 58% 52%
As of January 1, 2016, Goldman Sachs Global Investment Research had investment ratings on 3,254 equity securities. Goldman Sachs assigns stocks
as Buys and Sells on various regional Investment Lists; stocks not so assigned are deemed Neutral. Such assignments equate to Buy, Hold and Sell
for the purposes of the above disclosure required by NASD/NYSE rules. See 'Ratings, Coverage groups and views and related definitions' below.
Price target and rating history chart(s)
Compendium report: please see disclosures at http://www.gs.com/research/hedge.html. Disclosures applicable to the companies included in this
compendium can be found in the latest relevant published research
January 13, 2016 Americas: Technology
Goldman Sachs Global Investment Research 57
Regulatory disclosures
Disclosures required by United States laws and regulations
See company-specific regulatory disclosures above for any of the following disclosures required as to companies referred to in this report: manager
or co-manager in a pending transaction; 1% or other ownership; compensation for certain services; types of client relationships; managed/co-
managed public offerings in prior periods; directorships; for equity securities, market making and/or specialist role. Goldman Sachs usually makes a
market in fixed income securities of issuers discussed in this report and usually deals as a principal in these securities.
The following are additional required disclosures: Ownership and material conflicts of interest: Goldman Sachs policy prohibits its analysts,
professionals reporting to analysts and members of their households from owning securities of any company in the analyst's area of
coverage. Analyst compensation: Analysts are paid in part based on the profitability of Goldman Sachs, which includes investment banking
revenues. Analyst as officer or director: Goldman Sachs policy prohibits its analysts, persons reporting to analysts or members of their
households from serving as an officer, director, advisory board member or employee of any company in the analyst's area of coverage. Non-U.S.
Analysts: Non-U.S. analysts may not be associated persons of Goldman, Sachs & Co. and therefore may not be subject to NASD Rule 2711/NYSE
Rules 472 restrictions on communications with subject company, public appearances and trading securities held by the analysts.
Distribution of ratings: See the distribution of ratings disclosure above. Price chart: See the price chart, with changes of ratings and price targets in
prior periods, above, or, if electronic format or if with respect to multiple companies which are the subject of this report, on the Goldman Sachs
website at http://www.gs.com/research/hedge.html.
Additional disclosures required under the laws and regulations of jurisdictions other than the United States
The following disclosures are those required by the jurisdiction indicated, except to the extent already made above pursuant to United States laws
and regulations. Australia: Goldman Sachs Australia Pty Ltd and its affiliates are not authorised deposit-taking institutions (as that term is defined in
the Banking Act 1959 (Cth)) in Australia and do not provide banking services, nor carry on a banking business, in Australia. This research, and any
access to it, is intended only for "wholesale clients" within the meaning of the Australian Corporations Act, unless otherwise agreed by Goldman
Sachs. In producing research reports, members of the Global Investment Research Division of Goldman Sachs Australia may attend site visits and
other meetings hosted by the issuers the subject of its research reports. In some instances the costs of such site visits or meetings may be met in part
or in whole by the issuers concerned if Goldman Sachs Australia considers it is appropriate and reasonable in the specific circumstances relating to
the site visit or meeting. Brazil: Disclosure information in relation to CVM Instruction 483 is available at
http://www.gs.com/worldwide/brazil/area/gir/index.html. Where applicable, the Brazil-registered analyst primarily responsible for the content of this
research report, as defined in Article 16 of CVM Instruction 483, is the first author named at the beginning of this report, unless indicated otherwise at
the end of the text. Canada: Goldman Sachs Canada Inc. is an affiliate of The Goldman Sachs Group Inc. and therefore is included in the company
specific disclosures relating to Goldman Sachs (as defined above). Goldman Sachs Canada Inc. has approved of, and agreed to take responsibility for,
this research report in Canada if and to the extent that Goldman Sachs Canada Inc. disseminates this research report to its clients. Hong
Kong: Further information on the securities of covered companies referred to in this research may be obtained on request from Goldman Sachs
(Asia) L.L.C. India: Further information on the subject company or companies referred to in this research may be obtained from Goldman Sachs
(India) Securities Private Limited. Goldman Sachs may beneficially own 1% or more of the securities (as such term is defined in clause 2 (h) the Indian
Securities Contracts (Regulation) Act, 1956) of the subject company or companies referred to in this research report. Japan: See
below. Korea: Further information on the subject company or companies referred to in this research may be obtained from Goldman Sachs (Asia)
L.L.C., Seoul Branch. New Zealand: Goldman Sachs New Zealand Limited and its affiliates are neither "registered banks" nor "deposit takers" (as
defined in the Reserve Bank of New Zealand Act 1989) in New Zealand. This research, and any access to it, is intended for "wholesale clients" (as
defined in the Financial Advisers Act 2008) unless otherwise agreed by Goldman Sachs. Russia: Research reports distributed in the Russian
Federation are not advertising as defined in the Russian legislation, but are information and analysis not having product promotion as their main
purpose and do not provide appraisal within the meaning of the Russian legislation on appraisal activity. Singapore: Further information on the
covered companies referred to in this research may be obtained from Goldman Sachs (Singapore) Pte. (Company Number:
198602165W). Taiwan: This material is for reference only and must not be reprinted without permission. Investors should carefully consider their
own investment risk. Investment results are the responsibility of the individual investor. United Kingdom: Persons who would be categorized as
retail clients in the United Kingdom, as such term is defined in the rules of the Financial Conduct Authority, should read this research in conjunction
with prior Goldman Sachs research on the covered companies referred to herein and should refer to the risk warnings that have been sent to them by
Goldman Sachs International. A copy of these risks warnings, and a glossary of certain financial terms used in this report, are available from
Goldman Sachs International on request.
European Union: Disclosure information in relation to Article 4 (1) (d) and Article 6 (2) of the European Commission Directive 2003/126/EC is available
at http://www.gs.com/disclosures/europeanpolicy.html which states the European Policy for Managing Conflicts of Interest in Connection with
Investment Research.
Japan: Goldman Sachs Japan Co., Ltd. is a Financial Instrument Dealer registered with the Kanto Financial Bureau under registration number Kinsho
69, and a member of Japan Securities Dealers Association, Financial Futures Association of Japan and Type II Financial Instruments Firms
Association. Sales and purchase of equities are subject to commission pre-determined with clients plus consumption tax. See company-specific
disclosures as to any applicable disclosures required by Japanese stock exchanges, the Japanese Securities Dealers Association or the Japanese
Securities Finance Company.
Ratings, coverage groups and views and related definitions
Buy (B), Neutral (N), Sell (S) -Analysts recommend stocks as Buys or Sells for inclusion on various regional Investment Lists. Being assigned a Buy
or Sell on an Investment List is determined by a stock's return potential relative to its coverage group as described below. Any stock not assigned as
a Buy or a Sell on an Investment List is deemed Neutral. Each regional Investment Review Committee manages various regional Investment Lists to a
global guideline of 25%-35% of stocks as Buy and 10%-15% of stocks as Sell; however, the distribution of Buys and Sells in any particular coverage
group may vary as determined by the regional Investment Review Committee. Regional Conviction Buy and Sell lists represent investment
recommendations focused on either the size of the potential return or the likelihood of the realization of the return.
Return potential represents the price differential between the current share price and the price target expected during the time horizon associated
with the price target. Price targets are required for all covered stocks. The return potential, price target and associated time horizon are stated in each
report adding or reiterating an Investment List membership.
Coverage groups and views: A list of all stocks in each coverage group is available by primary analyst, stock and coverage group at
http://www.gs.com/research/hedge.html. The analyst assigns one of the following coverage views which represents the analyst's investment outlook
on the coverage group relative to the group's historical fundamentals and/or valuation. Attractive (A). The investment outlook over the following 12
months is favorable relative to the coverage group's historical fundamentals and/or valuation. Neutral (N). The investment outlook over the
January 13, 2016 Americas: Technology
Goldman Sachs Global Investment Research 58
following 12 months is neutral relative to the coverage group's historical fundamentals and/or valuation. Cautious (C). The investment outlook over
the following 12 months is unfavorable relative to the coverage group's historical fundamentals and/or valuation.
Not Rated (NR). The investment rating and target price have been removed pursuant to Goldman Sachs policy when Goldman Sachs is acting in an
advisory capacity in a merger or strategic transaction involving this company and in certain other circumstances. Rating Suspended (RS). Goldman
Sachs Research has suspended the investment rating and price target for this stock, because there is not a sufficient fundamental basis for
determining, or there are legal, regulatory or policy constraints around publishing, an investment rating or target. The previous investment rating and
price target, if any, are no longer in effect for this stock and should not be relied upon. Coverage Suspended (CS). Goldman Sachs has suspended
coverage of this company. Not Covered (NC). Goldman Sachs does not cover this company. Not Available or Not Applicable (NA). The
information is not available for display or is not applicable. Not Meaningful (NM). The information is not meaningful and is therefore excluded.
Global product; distributing entities
The Global Investment Research Division of Goldman Sachs produces and distributes research products for clients of Goldman Sachs on a global
basis. Analysts based in Goldman Sachs offices around the world produce equity research on industries and companies, and research on
macroeconomics, currencies, commodities and portfolio strategy. This research is disseminated in Australia by Goldman Sachs Australia Pty Ltd
(ABN 21 006 797 897); in Brazil by Goldman Sachs do Brasil Corretora de Títulos e Valores Mobiliários S.A.; in Canada by either Goldman Sachs
Canada Inc. or Goldman, Sachs & Co.; in Hong Kong by Goldman Sachs (Asia) L.L.C.; in India by Goldman Sachs (India) Securities Private Ltd.; in
Japan by Goldman Sachs Japan Co., Ltd.; in the Republic of Korea by Goldman Sachs (Asia) L.L.C., Seoul Branch; in New Zealand by Goldman Sachs
New Zealand Limited; in Russia by OOO Goldman Sachs; in Singapore by Goldman Sachs (Singapore) Pte. (Company Number: 198602165W); and in
the United States of America by Goldman, Sachs & Co. Goldman Sachs International has approved this research in connection with its distribution in
the United Kingdom and European Union.
European Union: Goldman Sachs International authorised by the Prudential Regulation Authority and regulated by the Financial Conduct Authority
and the Prudential Regulation Authority, has approved this research in connection with its distribution in the European Union and United Kingdom;
Goldman Sachs AG and Goldman Sachs International Zweigniederlassung Frankfurt, regulated by the Bundesanstalt für
Finanzdienstleistungsaufsicht, may also distribute research in Germany.
General disclosures
This research is for our clients only. Other than disclosures relating to Goldman Sachs, this research is based on current public information that we
consider reliable, but we do not represent it is accurate or complete, and it should not be relied on as such. We seek to update our research as
appropriate, but various regulations may prevent us from doing so. Other than certain industry reports published on a periodic basis, the large
majority of reports are published at irregular intervals as appropriate in the analyst's judgment.
Goldman Sachs conducts a global full-service, integrated investment banking, investment management, and brokerage business. We have
investment banking and other business relationships with a substantial percentage of the companies covered by our Global Investment Research
Division. Goldman, Sachs & Co., the United States broker dealer, is a member of SIPC (http://www.sipc.org).
Our salespeople, traders, and other professionals may provide oral or written market commentary or trading strategies to our clients and principal
trading desks that reflect opinions that are contrary to the opinions expressed in this research. Our asset management area, principal trading desks
and investing businesses may make investment decisions that are inconsistent with the recommendations or views expressed in this research.
The analysts named in this report may have from time to time discussed with our clients, including Goldman Sachs salespersons and traders, or may
discuss in this report, trading strategies that reference catalysts or events that may have a near-term impact on the market price of the equity
securities discussed in this report, which impact may be directionally counter to the analyst's published price target expectations for such stocks. Any
such trading strategies are distinct from and do not affect the analyst's fundamental equity rating for such stocks, which rating reflects a stock's
return potential relative to its coverage group as described herein.
We and our affiliates, officers, directors, and employees, excluding equity and credit analysts, will from time to time have long or short positions in,
act as principal in, and buy or sell, the securities or derivatives, if any, referred to in this research.
The views attributed to third party presenters at Goldman Sachs arranged conferences, including individuals from other parts of Goldman Sachs, do
not necessarily reflect those of Global Investment Research and are not an official view of Goldman Sachs.
Any third party referenced herein, including any salespeople, traders and other professionals or members of their household, may have positions in
the products mentioned that are inconsistent with the views expressed by analysts named in this report.
This research is not an offer to sell or the solicitation of an offer to buy any security in any jurisdiction where such an offer or solicitation would be
illegal. It does not constitute a personal recommendation or take into account the particular investment objectives, financial situations, or needs of
individual clients. Clients should consider whether any advice or recommendation in this research is suitable for their particular circumstances and, if
appropriate, seek professional advice, including tax advice. The price and value of investments referred to in this research and the income from them
may fluctuate. Past performance is not a guide to future performance, future returns are not guaranteed, and a loss of original capital may occur.
Fluctuations in exchange rates could have adverse effects on the value or price of, or income derived from, certain investments.
Certain transactions, including those involving futures, options, and other derivatives, give rise to substantial risk and are not suitable for all investors.
Investors should review current options disclosure documents which are available from Goldman Sachs sales representatives or at
http://www.theocc.com/about/publications/character-risks.jsp. Transaction costs may be significant in option strategies calling for multiple purchase
and sales of options such as spreads. Supporting documentation will be supplied upon request.
All research reports are disseminated and available to all clients simultaneously through electronic publication to our internal client websites. Not all
research content is redistributed to our clients or available to third-party aggregators, nor is Goldman Sachs responsible for the redistribution of our
research by third party aggregators. For research, models or other data available on a particular security, please contact your sales representative or
go to http://360.gs.com.
Disclosure information is also available at http://www.gs.com/research/hedge.html or from Research Compliance, 200 West Street, New York, NY
10282.
© 2016 Goldman Sachs.
No part of this material may be (i) copied, photocopied or duplicated in any form by any means or (ii) redistributed without the prior
written consent of The Goldman Sachs Group, Inc.

Goldman Sachs VR & AR report 2015

  • 1.
    Virtual and augmented realityhave the potential to become the next big computing platform. All around us are examples of where VR (which immerses the user in a virtual world) and AR (which overlays digital information onto the physical world) can reshape existing ways of doing things – from buying a new home to interacting with a doctor or watching a concert. In the first of a new Profiles in Innovation series, we examine what VR/AR could become, the evolving use cases and the markets that could be created and disrupted. Heather Bellini, CFA (212) 357-7710 heather.bellini@gs.com Goldman, Sachs & Co. Goldman Sachs does and seeks to do business with companies covered in its research reports. As a result, investors should be aware that the firm may have a conflict of interest that could affect the objectivity of this report. Investors should consider this report as only a single factor in making their investment decision. For Reg AC certification and other important disclosures, see the Disclosure Appendix, or go to www.gs.com/research/hedge.html. Analysts employed by non-US affiliates are not registered/qualified as research analysts with FINRA in the U.S. The Goldman Sachs Group, Inc. EQUITY RESEARCH | January 13, 2016 Understanding the race for the next computing platform PROFILES IN INNOVATIONVirtual & Augmented Reality Wei Chen +886(2)2730-4185 wei.chen@gs.com Goldman Sachs (Asia) L.L.C., Taipei Branch Masaru Sugiyama +81(3)6437-4691 masaru.sugiyama@gs.com Goldman Sachs Japan Co., Ltd. Marcus Shin +82(2)3788-1154 marcus.shin@gs.com Goldman Sachs (Asia) L.L.C., Seoul Branch Shateel Alam (212) 902-6785 shateel.alam@gs.com Goldman, Sachs & Co. DaikiTakayama +81(3)6437-9870 daiki.takayama@gs.com Goldman Sachs Japan Co., Ltd.
  • 2.
    January 13, 2016Americas: Technology Goldman Sachs Global Investment Research 2 Table of contents Portfolio Manager’s Summary 4 Virtual and augmented reality in 6 charts 8 Current State of the Market 9 Using the past to predict the future 11 The PC revolution 11 The rise of the smartphone and tablet 12 Summary of our hardware and software forecasts 14 Use cases and software market detail 16 Videogames 18 Live events 19 Video entertainment 21 Retail 23 Real estate 26 Healthcare 28 Education 30 Military 31 Engineering 32 Details behind our hardware forecasts 35 Building a framework for volume adoption 35 Building a framework for price reductions 43 VR/AR HMD Hardware Categories 44 HMD Hardware Components 45 HMD Types, Vendors, BoM Costs and ASP Estimates 46 Virtual Reality and Augmented Reality Enablers 50 Alphabet (GOOGL, $745.34, CL-Buy) 50 Advanced Micro Devices (AMD, $2.39, Not Covered) 50 Facebook (FB, $99.37, Buy) 51 GoPro (GPRO, $14.60, Neutral) 51 HTC Corporation (2498.TW, TWD70.70, Not Covered) 52 Largan Precision (3008.TW, NT$1,840.00, CL-Buy) 52 Microsoft (MSFT, $52.78, Neutral) 53 Nvidia (NVDA, $30.18, Sell) 53 Qualcomm (QCOM, $46.52, Buy) 53 Samsung Electronics (005930.KS, W1,146,000.00, Neutral) 54 Sony (6758.T, ¥2,675.00, CL-Buy) 55 Disclosure Appendix 56 The prices in the body of this report are based on the market close of January 12, 2016. This is the first report in a new Profiles in Innovation series analyzing how emerging technologies are creating profit pools and disrupting old ones. For more on the series, see our Profiles in Innovation portal. Other contributing authors: Robert D. Boroujerdi, James Covello, Simona Jankowski, CFA, Heath P. Terry, CFA, Matthew J. Fassler, Lindsay Drucker Mann, CFA, Noah Poponak, CFA, David Roman, Debra Schwartz, Gabriela Borges, CFA, Matthew Cabral, Doug Clark, CFA, Mark Grant, Takafumi Hara, Nicole Hayashi, Chelsea Jurman, Jack Kilgallen, CFA, Balaji Krishnamurthy, CFA, Giuni Lee, Jim Liu, Komal Makkar, Hideaki Mitani, Yukiko Nomani, Dan Powell, Connie Qian, Swapnil Sheth, and Tina Sun.
  • 3.
    January 13, 2016Americas: Technology Goldman Sachs Global Investment Research 3 Did you know…? The value of the 225 VR/AR venture capital investments made in the last two years. Facebook also paid $2bn to acquire Oculus in May 2014. (p. 9) FINANCIAL BACKING $3.5bn The price of the consumer version of Oculus (launched on January 6, 2016), with Oculus- ready PC bundles expected to sell for ~$1,500. (p. 10) A WAVE OF CONTENT ON THE WAY The number of VR games Oculus says will be available in 2016, with 20 games developed by Oculus Story Studios. (p. 17) 100 GLOBAL INTEREST 121 The number of countries represented in the viewership data for the first US Democratic presidential debate, which CNN streamed in VR. (p. 19) The number of Google Cardboard head-mounted displays distributed since the product’s June 2014 launch. (p.17) SHIPPING OUT 48 hours SELLING OUT The amount of time it took for Samsung’s $99 Gear VR to sell out on Amazon.com and BestBuy.com—an indication of strong demand at lower price points. (p. 39) 2mn RETAIL VALUE $599 The number of Virtual Boy VR gaming consoles Nintendo sold after its 1995 release, despite the platform’s technological limitations. (p. 36) 770k INTEREST IN THE PAST READY TO BUILD The number of developers Oculus has registered to create games on the VR platform (as of September 2015). (p. 18) 200k HOME REDESIGN, REIMAGINED The size of the US real estate commissions market that VR stands to disrupt. Sotheby’s is beginning to show luxury homes in VR. (p. 26) 6 The number of Lowe’s home improvement stores featuring “Holorooms” to help customers visualize their remodeling projects. (p. 23) $52bn EASIER TO IMAGINE YOURSELF AT HOME
  • 4.
    January 13, 2016Americas: Technology Goldman Sachs Global Investment Research 4 Portfolio Manager’s Summary Virtual reality (VR) and augmented reality (AR) have the potential to become the next big computing platform, and as we saw with the PC and smartphone, we expect new markets to be created and existing markets to be disrupted. There’s no shortage of examples of how VR and AR can reshape existing ways of doing things– from buying a new home, interacting with a doctor, or watching a football game. As the technology advances, price points decline, and an entire new marketplace of applications (both business and consumer) hit the market, we believe VR/AR has the potential to spawn a multibillion-dollar industry, and possibly be as game changing as the advent of the PC. This report aims to show what VR/AR could become, the evolving use cases, the potential market disruption, and the challenge of moving from science fiction to widespread adoption. We see both VR (which immerses the user in a virtual world) and AR (which overlays digital information onto the physical world) as driving a trend towards the adoption of head-mounted-devices (HMDs) as a new computing form factor. Given that VR/AR technology is still in the early stages of development, we’ve outlined three scenarios for hardware and software uptake over the next decade. In our base case, we estimate $80bn in revenue by 2025 ($45bn in hardware, $35bn in software) and assume that HMDs gain popularity as technology improves, but adoption is limited by mobility and battery life. Our “accelerated uptake” scenario predicts a $182bn market ($110bn in hardware, $72bn in software), where VR/AR technology evolves from a niche device to a broader computing platform. In our $23bn “delayed uptake” scenario ($15bn in hardware, $8bn in software) we assume VR/AR sees challenges in latency, display, safety and privacy, and the technology is used primarily for videogames. These forecasts compare with the current hardware markets for notebooks at $111bn, desktops at $62bn, and videogame consoles at $14bn. We’ve outlined 9 use cases for VR/AR which we see as the most meaningful drivers of the market in the near-term: videogames, live events, video entertainment, healthcare, real estate, retail, education, engineering, and military. We lay out case studies of vendors implementing VR/AR today, including Volvo using Microsoft HoloLens to sell cars, NextVR streaming live sports, and Atheer developing smart glasses for deskless professionals including doctors and EMTs. We conducted a bottom-up analysis to arrive at estimates for the potential market in each use case, assessing the number of users and the existing and potential revenue pools. While the videogame use case will likely take center stage in 2016, we see use cases in areas like healthcare and education evolving to help drive VR/AR awareness. The enterprise was the driver of the PC and the consumer was the driver of the smartphone, but we see both forces at work to drive VR/AR adoption, with consumer use cases driving the momentum in the beginning. In 2025, our base case software estimates imply that 60% of VR/AR software revenue is driven by the consumer while the remainder is supported by enterprise and public sector use cases. Looking beyond videogames, we see real estate, retail, and healthcare among the first markets that VR/AR disrupts. VR/AR technology has the potential to change business models and the ways in which we transact. Sotheby’s is beginning to show luxury homes in VR, which has potential to disrupt a $52bn US real estate commissions market (derived with data from the National Association of Realtors). Lowes has equipped 6 of its stores with “Holorooms” to help customers envision their home remodeling plans and garner a competitive advantage in the $180bn US home improvement market. VR/AR technology could also reduce the need for in-store display inventory and potentially accelerate the erosion in value of physical stores to the extent that the viewing experience can be deployed in the home and via mobile devices. Finally, doctors and medical professionals are experimenting with AR as a hands-free medical tool, playing into a $16bn patient monitoring devices market. Our base case is an $80bn VR/AR industry by 2025 (p. 14) See our profiles of 7 vendors applying VR/AR to separate use cases (pp. 20-34)
  • 5.
    January 13, 2016Americas: Technology Goldman Sachs Global Investment Research 5 We view the user experience, technology constraints, the development of content and applications, and price as key hurdles to adoption. We believe the user experience will be the most important factor and expect technology advancements to reduce cyber sickness and increase mobility, expanding the use cases and pervasiveness of VR/AR. In terms of content and applications, we see a chicken-and-egg issue where content and app developers are cautious to make investments in VR/AR without an installed base, while at the same time, consumers and enterprises are hesitant to buy VR/AR hardware without a strong supply of content and apps. We see Facebook, Google, Sony, and Microsoft driving both sides of this equation over time by supplying hardware and content/software. Finally, with the retail price of Oculus at $599 and Oculus-ready PC bundles costing ~$1,500, we believe price points need to decline to see wider adoption. We believe VR/AR HMDs could experience similar cost reduction curves as we have seen on PCs and smartphones, with prices falling 5-10% annually. In our BoM (bill-of- materials) analysis, we found VR/AR HMDs contain components that highly overlap those of smartphones, such as display, motion sensors, processors, storage/memory and wireless connection. That said, there are also components unique to VR/AR devices such as 3D lenses and position tracking systems which currently drive the price up. We expect major VR players such as Oculus, HTC and Sony to price their HMDs in line with their BoMs ($350-500) to drive user adoption. Looking forward, we expect BoM costs to decline with economies of scale, which would enable HMD makers to either reduce their selling prices to take more market share or maintain their ASPs to earn more profits, depending on their targeted market segments and pricing strategies. At this stage, we have greater conviction in the relative success of VR versus AR given VR’s technological progress and momentum, and the early formation of an ecosystem of vendors and partners. Our base case software scenario is driven 75% by VR use cases vs 25% for AR use cases. While we believe both VR and AR need to advance technologically, we see AR as having more significant hurdles to overcome, including challenges in display technology and the real-time processing and calibration of the real- world physical environment. That said, as AR technology matures, we see stronger enterprise use cases emerging, especially considering AR enables you to see your physical environment whereas VR completely blocks it. Where could this go? We see qualities in VR/AR technology that can take this from niche use cases to a device as ubiquitous as the smartphone. Part of the mass appeal of smartphones is their ease of use with a touch screen interface; VR/AR technology has the potential to take this level of intuition to the next stage as the controls are driven by gestures and the interface is in 3D. Technology can often start with narrow use cases and evolve into broader platforms. For example, the iPod dominated in the music industry, cellular technology was added to it, and the device evolved into the iPhone. Soon after, third-party applications began to run on smartphones, creating a new market for business and consumer applications. In the long run, if VR/AR technology becomes as lightweight as a set of glasses, we see the potential for the evolution to be similar where multiple devices are combined into one, potentially replacing phones and PC environments. In terms of tech stocks, we highlight companies that are positioning themselves ahead the VR/AR trend, including Alphabet, AMD, Facebook, GoPro, HTC, Largan Precision, Microsoft, Nvidia, Qualcomm, Samsung, and Sony. We estimate bill- of-materials costs and average selling prices for the major HMD vendors (p. 46)
  • 6.
    January 13, 2016Americas: Technology Goldman Sachs Global Investment Research 6 Graphics • Nvidia • AMD • Qualcomm Augmented Reality • Microsoft HoloLens • Google Glass • Magic Leap • Atheer • Osterhout Design Group Virtual Reality • Facebook Oculus • Samsung Gear VR • Google Cardboard • HTC Vive • Sony PSVR • Vuzix iWear • VR Union Claire Processors • TI • Qualcomm • STMicro • Realtek • Himax • MediaTek • Intel Head–mounted devices Video • Jaunt • NextVR • VRSE • Oculus Story Studio • GoPro • IG Port Games • Sony • Ubisoft • CCP Games • Oculus Story Studio • Tammeka Games • Pixel Titans • Capcom Social • Altspace VR • High Fidelity • Podrift Engineering • Autodesk • Dassault Systèmes • IrisVR • Visidraft • MakeVR Healthcare • Psious • zSpace • Conquer Mobile • 3D Systems Commerce • Sixense {shopping} • Matterport {real estate} Applications Display • Samsung • JDI • Himax • Crystal 3D Audio • TI • Wolfson • Realtek Memory (DRAM/SSD) • Micron • Samsung • SK Hynix • Toshiba Position/ Room Tracker • Hon Hai • Pegatron • Flex • Jabil • HTC Haptics • Alps • AAC • Nidec Motion Sensors • Leap Motion • InvenSense • TI • STMicro • Honeywell Cameras • 360Heros • GoPro Odyssey • Nokia OZO • Jaunt NEO • Matterport Pro 3D 3D Lenses • Wearality • Zeiss • Canon • Nikon • Largan Components The Ecosystem Virtual Reality / Augmented Reality
  • 7.
    January 13, 2016Americas: Technology Goldman Sachs Global Investment Research 7 VIDEOGAMES $11.6bn • Estimated users: 216mn • Markets disrupted: videogames SOFTWARE $35bn • 60% of VR/AR software revenue will be driven by the consumer (vs. enterprise/ public sector) • Videogames will be the first consumer market to develop • Beyond videogames, we see real estate, retail and healthcare among the first markets disrupted HARDWARE $45bn • 4 main devices used to experience VR/AR: HMDs, host systems, tracking systems and controllers • Our forecast is specific to HMDs • Our base case assumes 125mn annual shipments by 2025 LIVE EVENTS $4.1bn • Estimated users: 95mn • Markets disrupted: live ticket sales VIDEO ENTERTAINMENT $3.2bn • Estimated users: 79mn • Markets disrupted: online streaming RETAIL $1.6bn • Estimated users: 32mn • Markets disrupted: e-commerce REAL ESTATE $2.6bn • Estimated users: 0.3mn • Markets disrupted: commissions EDUCATION $0.7bn • Estimated users: 15mn • Markets disrupted: K-12 and higher-ed software HEALTHCARE $5.1bn • Estimated users: 3.4mn • Markets disrupted: patient monitoring MILITARY $1.4bn • Estimated users: 0.7mn • Markets disrupted: defense training and simulation Total Addressable Market 2025 Base Case VR/AR Estimates The Ecosystem Virtual Reality / Augmented Reality ENGINEERING $4.7bn • Estimated users: 3.2mn • Markets disrupted: CAD/CAM software
  • 8.
    January 13, 2016Americas: Technology Goldman Sachs Global Investment Research 8 Virtual and augmented reality in 6 charts Exhibit 1: Our VR/AR unit forecasts assume far slower adoption than smartphones or tablets Exhibit 2: Our three scenarios for a 2025 VR/AR hardware market Source: Goldman Sachs Global Investment Research. Source: Goldman Sachs Global Investment Research, IDC data for smartphone and tablet shipments. Exhibit 3: Our combined 2025 VR/AR hardware and software scenarios Exhibit 4: Our 2025 base case VR/AR software assumptions by use case Source: Goldman Sachs Global Investment Research. Source: Goldman Sachs Global Investment Research. Exhibit 5: The progression of our base case hardware and software forecasts Exhibit 6: HMD price declines could be similar to what we’ve seen in the past Source: Goldman Sachs Global Investment Research. Source: Goldman Sachs Global Investment Research. 0 100,000 200,000 300,000 400,000 500,000 600,000 700,000 800,000 2015E 2016E 2017E 2018E 2019E 2020E 2021E 2022E 2023E 2024E 2025E Unitshipments(000's) Base case Accelerated uptake Delayed uptake Tablet shipments Smartphone shipments Tablet shipments from 2010-2016E Smartphone shipments from 2004-2012 Accelerated uptake Base case Delayed uptake TV $99bn Notebook PC $111bn Desktop PC $62bn Tablet PC $63bn Game Console $14bn Accelerated Uptake $110bn Base Case $45bn Delayed Uptake $15bn $0 $50 $100 $150 $200 $250 $300 $350 $0 $100 $200 $300 $400 $500 $600 $700 $800 $900 Annualshipments(mns) ASP ($) $110bn $45bn $15bn $72bn $35bn $8bn $0bn $20bn $40bn $60bn $80bn $100bn $120bn $140bn $160bn $180bn $200bn Accelerated uptake Base case Delayed uptake Hardware Software Videogames, $11.6bn Live events, $4.1bn Video entertainment, $3.2bn Retail, $1.6bn Real estate, $2.6bn Education, $0.7bn Healthcare, $5.1bn Engineering, $4.7bn Military, $1.4bn $0.0 $10.0 $20.0 $30.0 $40.0 $50.0 $60.0 $70.0 $80.0 $90.0 2016E 2017E 2018E 2019E 2020E 2021E 2022E 2023E 2024E 2025E Revenue($bns) Hardware revenue - base case Software revenue - Base case $0 $500 $1,000 $1,500 $2,000 $2,500 $3,000 $3,500 1994 1999 2004 2009 2014 Desktop ASP Notebook ASP Tablet PC ASP Smartphone ASP LCD-TV ASP Notebooks CAGR: -6.5% Desktop CAGR: -5.2% Tablet CAGR: -13.4% Smartphone CAGR: -5.1% LCD-TV CAGR: -8.6%
  • 9.
    January 13, 2016Americas: Technology Goldman Sachs Global Investment Research 9 Current State of the Market While virtual reality may currently be top of mind, this is not the first time. In the 1990s, when 3D gaming was introduced, virtual reality saw a similar boom. Gaming companies introduced 3D videogames, such as Virtuality’s VR arcade pods and Nintendo’s Virtual Boy. Movies, such as the Lawnmower Man, Virtuosity, and Johnny Mnemonic, portrayed new, immersive cyber-worlds. Books, including Snow Crash and Disclosure, similarly depicted this new type of reality. However, the technology was not able to keep pace with these unrealistic portrayals in the media. The 3D arcade games suffered from poor graphics, expensive prices, time lags, and low computing power. Eventually, these products failed, as consumers became unsatisfied with the technology, and the boom was over. A similar hype began when Facebook acquired Oculus for $2bn in 2014 and we note that over the last 2 years there have been over 225 VC investments in VR/AR, raising $3.5bn in capital. So, what has changed that differentiates the current state from the 1990s flop? The answer is the technology, in our view. Today, computers are powerful enough to render realistic virtual worlds. Additionally, the mobile phone industry has improved the price, size, and performance of displays and sensors. Today’s technologies have improved on the inefficiencies present in the 1990s. As a result of this progress, key companies have become involved: Exhibit 7: Recent involvement in virtual reality by technology giants Source: News sources, compiled by Goldman Sachs Global Investments Research. There are still improvements to be made. Oculus’ Chief Scientist, Michael Abrash, has said that they are still focused on further developing haptics (use of hands), visual display (pixel density, quality), audio (compute power), and tracking (mapping). That said, we expect product releases in 2016 to begin addressing these challenges and to see continuous product improvement over the next 3-5 years. Company Date Details Qualcomm Jan-12 Raised seed funding for the mobile augmented reality startup Blippar Google Apr-12 Introduced augmented reality glasses, Google Glass, to the public Sony Mar-14 Sony announces Project Morpheus, later renamed PlayStation VR HP Mar-14 Launched Aurasma 3.0, an augmented reality platform that it acquired through Autonomy Facebook Mar-14 Acquired Oculus, a virtual reality startup, for $2bn Samsung Sep-14 Revealed its own head-mounted display, Samsung Gear VR, partnering with Oculus Google Oct-14 Invested $542mn in the startup Magic Leap Intel Apr-15 Invested in Series A funding for the virtual reality startup WorldViz Apple May-15 Reportedly acquired Metaio, an augmented reality software maker Disney Sep-15 Led a $65mn funding round in Jaunt, a VR content startup Microsoft Oct-15 Acquired Havok, a 3D physics engine used for videogames Comcast & Time Warner Nov-15 Participated in a $30.5mn funding round for NextVR, which captures live events in VR Apple Nov-15 Acquired Faceshift, a facial recognition capture and animation company Fox Jan-16 Acquired minority stake in Osterhout Design Group, a VR/AR HMD maker
  • 10.
    January 13, 2016Americas: Technology Goldman Sachs Global Investment Research 10 Virtual reality vs augmented reality Virtual reality (VR) and augmented reality (AR) have different use cases, technologies, and market opportunities so it’s important to distinguish between the two.  Virtual reality immerses a user in an imagined or replicated world (like videogames, movies, or flight simulation) or simulates presence in the real world (like watching a sporting event live). The major hardware players in VR are Oculus, Sony PlayStation VR, HTC Vive, and Samsung Gear VR.  Augmented reality overlays digital imagery onto the real world. The major hardware players include Microsoft HoloLens, Google Glass, and Magic Leap. An easy way to differentiate between the two is that VR uses an opaque headset (which you cannot see through) to completely immerse the user in a virtual world whereas AR uses a clear headset so the users can see the real world and overlay information and imagery onto it. As we discuss in more detail in the use cases section of this report, we currently see AR geared towards serving business use cases, VR having both consumer and business applications, and some areas where the two overlap. For instance, most videogame development is in VR right now, but Microsoft HoloLens is also creating AR games such as Minecraft. While VR and AR can have different use cases, we view both technologies as driving the broader trend of HMDs as a computing form factor. Whether for consumer use or enterprise use, both VR and AR technology have the challenge of convincing the world that the value proposition is high enough to add another device to the current slate of offerings in desktops, notebooks, tablets, and smartphones. Further, both VR and AR are gesture- based where the controls are largely driven by head and hand movements; while we view these gesture-based controls as intuitive this will serve as a new way to navigate the computing environment. Summary of current HMD product offerings Pre-orders for the consumer version of Oculus launched on 1/6/16 (expected to ship in March) at a price of $599 (including two videogames and an Xbox controller) and the device will run on a PC requiring a high-end Nvidia or AMD graphics card and Intel processor. Nvidia estimates that only 13mn PCs are powerful enough to run Oculus (less than 1% of the PC installed base according to Gartner) and a PC meeting Oculus’ requirements is expected to cost at least ~$1,000 (Oculus-ready PC bundles are expected to cost $1,500). Given these high price points and small installed base of PCs that are powerful enough to run Oculus, we believe initial adoption might be limited. PlayStation VR (to run on the PlayStation 4 gaming console) and HTC Vive (to run on a PC) are expected to launch in 1H16 while the Samsung Gear VR (runs on a Samsung phone) was initially launched in September 2014 with a new product released in September 2015 for $99. Microsoft has announced that a developer’s version of HoloLens will launch in 1Q16 at a price point of $3,000. Google Glass was initially launched in 2013 with a limited release for $1,500 but was discontinued in 2015; it has been recently reported by the press (WSJ) that a new Google Glass version could launch in 2016. Finally, Magic Leap has yet to announce when its augmented reality product will be released. Currently, Apple has not indicated any major initiatives in VR/AR; however, we do expect them to participate over time, particularly following the recent acquisitions of several small VR/AR-related companies including Faceshift and Metaio. As the use cases of VR/AR are still in very early stages of development, we suspect that Apple is trying to gain a greater understanding of how consumers want to interact with the technology and the associated
  • 11.
    January 13, 2016Americas: Technology Goldman Sachs Global Investment Research 11 challenges before making its first move. As for Amazon, we note that in December 2015 the company filed for an AR patent outlining how a person could control devices with hand gestures. We believe AR technology could eventually tie into Amazon’s Echo product, the voice-activated personal assistant, where Amazon is trying to increase its presence in the home. We also note that Nintendo has yet to signal an entry into VR/AR. That said, given the company’s long history in the gaming market, there has been speculation that the company could enter the market in either consoles or content market with games. Using the past to predict the future To ascertain the ramp of VR/AR, we analyzed the adoption curves and trends we saw in PCs, smartphones, and tablets to try to draw from the similarities and differences. We see VR/AR having a quick ramp among early adopters like tablets did, and see adoption being driven by a mix of consumer and enterprise use cases (while the PC was driven by enterprise and smartphone/tablets were driven by consumer). The PC revolution PCs changed the way people worked and essentially made the workforce more productive. Since the release of Windows 95, the PC industry saw rapid growth going from 50mn annual PC shipments in 1995 to over 350mn by 2010. Given the attribute of a productivity tool, it’s no surprise that the business world drove PC adoption with the enterprise representing ~70% of PC shipments in the early years as illustrated in the exhibit below. While the PC was driven by the enterprise the smartphone and tablet were driven by consumer with 90-95% of tablet shipments initiated by the consumer from 2010-2012, according to IDC. As we discuss in the use cases section, we see both consumer and enterprise use cases of VR/AR technology taking shape and believe both forces can be a driver of adoption.
  • 12.
    January 13, 2016Americas: Technology Goldman Sachs Global Investment Research 12 Exhibit 8: PCs were revolutionary and driven by enterprise as they changed the way people work VR/AR has both consumer and enterprise use cases developing and we see both sides driving adoption Source: Goldman Sachs Global Investment Research, IDC The rise of the smartphone and tablet To understand what the pace of VR/AR adoption could look like, we analyzed smartphone adoption (as a function of share taken from feature phones) and tablet adoption (as a function of share taken from notebooks). We mapped the adoption of these technologies over Rogers’ innovation curve where the first 15% of the applicable user base are considered to be innovators and early adopters, the next 34% are the early majority, followed by 34% late majority, with the final 16% being the laggards. In this analysis, we consider the percentage of unit shipments for the new technology (smartphones and tablets) versus the total applicable base (total handsets, total notebooks + tablets) to indicate the new technology’s point on the adoption curve. For example, in 2007, 11% of total handset shipments were smartphones so we consider that year to still be in the early adopter phase (the first 15%). Overall, the adoption curve for smartphones was relatively fast as smartphones represented 1% of total handset shipments in 2003 and the GS communications equipment team estimates smartphones will represent 82% of handset shipments in 2016. For smartphones, we consider the early adopter stage (the first 15%) to be from 2003-2009, the early majority (the next 34%) to be from 2010-2012, followed by late majority (the next 34%) to be from 2013-2015, with the final 16% being the laggards (2016 and on). We consider the 2007 launch of Apple’s iPhone a significant accelerator of smartphone adoption as penetration began to significantly ramp after that point. Tablets saw a quicker ramp in adoption than smartphones as the tablet was launched in 2010 and represented 27% of total tablet and notebook shipments by 2011, making its early adopter phase just two years. That said, tablets have been hovering at 50%-60% penetration since 2013 in the “late majority” phase. 71% 69%71%71% 69% 63% 60% 62%61%61%61%60%59% 57% 53% 46%45%46%46% 49%50%51%52% 0.0% 10.0% 20.0% 30.0% 40.0% 50.0% 60.0% 70.0% 80.0% 0 50,000 100,000 150,000 200,000 250,000 300,000 350,000 400,000 Enterprise shipments Consumer shipments % enterprise shipments Rogers’ adoption curve: Early adopters – the first 15% of the applicable user base Majority – mass adoption by the next 64% of the applicable user base Laggards – adoption by the last 16% of the applicable user base
  • 13.
    January 13, 2016Americas: Technology Goldman Sachs Global Investment Research 13 Exhibit 9: Smartphone adoption curve The early adoption was slow at first but quickly accelerated due in part to the 2007 launch of the iPhone Exhibit 10: Tablet adoption curve Early adoption of the tablet was relatively fast, but the majority uptake has been slow as the technology and use cases evolve Source: Goldman Sachs Global Investment Research, IDC Source: Goldman Sachs Global Investment Research, IDC In comparing and contrasting the faster adoption of smartphones to the slower adoption curve of tablets, we believe one key difference is that the smartphone can be thought of as an enhanced version of the feature phone which built upon the functions of voice and text messaging and added email, internet, video, and social functionality. In a sense, the smartphone added use cases we were already familiar with from desktop computers but made that functionality completely mobile. The tablet, on the other hand, offers a new way to do things versus the notebook given the touch screen functionality. We see tablets as more of an evolution of the notebook where the use cases of the tablet are still being defined and the technology is still evolving. In this respect, we also see VR/AR technology as an evolution in how we do things, where we could see a quick early adopter ramp but a slowing pace as the adoption curve hits the late majority. The potential for VR/AR to become a generic computing platform Looking back at the history of computer interface evolution, from command line, Windows, to the latest touch interface, the addressable market was broadened as the user interface became more intuitive. Twenty-five years ago, one would need to be properly trained to use a computer with command line or programming codes, but now one can use a smartphone/tablet without any training at all. Fundamentally, virtual/augmented reality creates a new and even more intuitive way to interact with a computer. In the world of virtual/augmented reality, the controls of the computer become what we are already familiar with through gestures and graphics. VR/AR also gives us wider field of view, where the concept of virtual desktop is no longer confined by the size of a physical display screen on our desktop or in the palm of our hands. Given this attribute of ease of use and the multiple use cases across VR/AR, we see the potential for the technology to emerge from vertical specific use cases to a broader computing platform. 0% 10% 20% 30% 40% 50% 60% 70% 80% 90% 100% 0 500,000 1,000,000 1,500,000 2,000,000 2,500,000 % smartphone penetration  Units shipped (000s) Smartphones Feature phones Smartphone penetration (% of total handset shipments) The first 15% ‐ early  adopters and innovators The next 68% ‐ the majority The last 16% ‐ the laggards 0% 10% 20% 30% 40% 50% 60% 70% 80% 90% 100% 0 50,000 100,000 150,000 200,000 250,000 300,000 350,000 400,000 450,000 500,000 2010 2011 2012 2013 2014 2015E 2016E % tablet penetration  Units shipped (000s) Tablets Notebooks Tablet penetration (% total tablets + notebooks) The first 15% ‐ early adopters  and innovators The next 68% ‐ the majority
  • 14.
    January 13, 2016Americas: Technology Goldman Sachs Global Investment Research 14 Summary of our hardware and software forecasts To arrive at the VR/AR estimates, we considered the following: 1. The use cases for VR/AR and potential addressable market in terms of users 2. A volume adoption framework which considers technology enablers to reach mass adoption. 3. A pricing framework which projects how costs could decline over time as price elasticity should have an impact on end demand. In considering the use cases and addressable markets, and marrying the volume adoption and pricing frameworks, we arrive at three outcomes in 2025 for our VR/AR hardware and software revenue TAM at $182bn, $80bn and $23bn. Base case scenario: $80bn market ($45bn in hardware and $35bn in software) In our base case scenario, we are assuming that HMDs gain popularity as VR/AR technology improves over time but is limited by mobility and battery life. Hence the use cases would be mostly confined to stationary mobility (i.e., living room, or office space mobility).The hardware TAM of $45bn implies a market size closer to the tablet hardware market (~$65bn) today. “Accelerated uptake”: $182bn market ($110bn in hardware, $72bn in software) In this case, we are assuming that HMD evolves from a niche market device to a generic computing platform by 2025, as the user experience of VR/AR technology improves over time coupled with breakthroughs in cellular and battery technologies to enable true mobility. With improving VR/AR user experience combined with true mobility, we expect HMDs to proliferate from vertical markets to horizontal market adoption. Our $110bn hardware estimate represents a similar market size to what we are seeing in notebooks (~$111bn) and TV (~$99bn) today. “Delayed uptake”: $23bn market ($15bn in hardware, $8bn in software) In this case, we are assuming that user experience of VR/AR technology improves at a slower pace due to hindrance in adoption from latency, display, safety, privacy and other issues for it to have a widespread effect. As such, we estimate that VR HMDs will primarily only succeed in the videogaming and entertainment use cases. The $15bn hardware TAM represents a market size similar to the current game console hardware market at around $14bn.
  • 15.
    January 13, 2016Americas: Technology Goldman Sachs Global Investment Research 15 Exhibit 11: VR/AR HMD market has the potential of reach over $100bn annually by 2025 Source: Goldman Sachs Global Investment Research, IDC The following chart lays out our base case, accelerated uptake case, and delayed uptake case for VR/AR shipments and overlays the adoption curve for smartphones (starting in 2004) and tablets (starting in 2010). Exhibit 12: Our VR/AR shipment assumptions vs. the smartphone and tablet ramps Source: Goldman Sachs Global Investment Research, Gartner for tablet shipment data TV $99bn Notebook PC $111bn Desktop PC $62bn Tablet PC $63bn Game Console $14bn Accelerated Uptake $110bn Base Case $45bn Delayed Uptake $15bn $0 $50 $100 $150 $200 $250 $300 $350 $0 $100 $200 $300 $400 $500 $600 $700 $800 $900 Annualshipments(mns) ASP ($) 0 100,000 200,000 300,000 400,000 500,000 600,000 700,000 800,000 2015E 2016E 2017E 2018E 2019E 2020E 2021E 2022E 2023E 2024E 2025E Unitshipments(000's) Base case Accelerated uptake Delayed uptake Tablet shipments Smartphone shipments Tablet shipments from 2010-2016E Smartphone shipments from 2004-2012 Accelerated uptake Base case Delayed uptake
  • 16.
    January 13, 2016Americas: Technology Goldman Sachs Global Investment Research 16 Use cases and software market detail We believe VR and AR have the potential to not only create new markets but also disrupt existing ones. We’ve identified 9 use cases for VR/AR technology which we see currently emerging: videogames, live events, video entertainment, retail, real estate, education, healthcare, engineering, and military. For each of these use cases, we assess the following: 1) The potential market reach in terms of users 2) The current challenges to execute on this use case 3) The existing revenue pool that VR/AR adoption could disrupt 4) Revenue drivers and estimate the software/subscription revenue potential through 2025 The following exhibit summarizes our software estimates by use case and key data points to gauge the market. Exhibit 13: Our base case user and software revenue assumptions Source: Goldman Sachs Global Investment Research/ Data point stats from: Gartner, IDC, World Bank, US Bureau of Labor Statistics, National Center for Education Statistics, Nielsen, FIFA, American Medical Association, Research and Markets, National Association of Realtors, OC&C Strategy Consultants, the Japan Ministry of Land, Infrastructure, Transport and Tourism, the Land Institute of Japan, Borrell Associates, CAE, Eurostat, and Statistics Japan. The market VR/AR is playing into To gauge the magnitude, the population that VR/AR could sell into Users Software revenue Users Software revenue Videogames VR/AR $106bn videogame market ~230mn installed base of video game consoles ~150mn PC gamers in developed markets 70mn $6.9bn 216mn $11.6bn Live events VR $44bn in live sports ticketing revenue ~715mn viewers of World Cup ~160mn viewers of the Super Bowl ~92mn ESPN subscribers 28mn $0.8bn 95mn $4.1bn Video entertainment VR $50bn Netflix TAM ~450mn households for Netflix's addressable market 24mn $0.8bn 79mn $3.2bn Real estate VR $107bn total real estate commission market in US, Japan, UK, and Germany 1.4mn real estate agents in US, Japan, UK, and Germany 0.2mn $0.8bn 0.3mn $2.6bn Retail VR/AR $3bn in ecommerce software market (impacting $1.5tr ecommerce market) 1bn+ online shoppers In-store shoppers 9.5mn $0.5bn 31.5mn $1.6bn Education VR/AR Education software market: $5bn for K-12, $7bn for higher education ~200mn primary and secondary students in developed markets In US, ~50mn K-12 and ~20mn college students 7mn $0.3bn 15mn $0.7bn Healthcare VR/AR $16bn patient monitoring devices market ~8mn physicians and EMTs in developed markets In US, ~800k physicians and 240k EMTs 0.8mn $1.2bn 3.4mn $5.1bn Engineering VR/AR $20bn engineering software market ~6mn engineers in US, Europe and Japan ~2.4mn engineers/technicians in the US 1.0mn $1.5bn 3.2mn $4.7bn Military VR/AR $9bn defense industry training and simulation market ~6.9mn military personnel in "high income countries" (World Bank) ~1.3mn US military personnel Assuming proprietary HMDs $0.5bn Assuming proprietary HMDs $1.4bn Total 95mn $13.1bn 315mn $35.0bn Current market size VR/AR 2020 Base case assumptions 2025 Base case assumptions Datapoints on the population that could use VR/AR
  • 17.
    January 13, 2016Americas: Technology Goldman Sachs Global Investment Research 17 We believe VR devices will have multiple use cases similar to smartphones that serve the functions of voice communication, texting, email, video, internet browsing, and social platforms. In our view, consumers will be able to use a single VR device to play videogames, watch video programming and live events, and shop. That said, we believe the business use cases will likely use separate devices given that specialized software will be required along with potential enterprise security concerns. A software market driven by both consumer and enterprise We note that of our 9 use cases, videogames, live events, and video entertainment are the only 3 that are entirely driven by the consumer and make up ~60% of our total VR/AR revenue assumptions for 2025. The remaining ~40% is driven by enterprise and public sector spend with the largest revenue generating use cases in engineering, healthcare, and real estate. Exhibit 14: Our 2025 VR/AR estimates by use case Consumer-driven use cases in videogames, live events and video driving ~60% of software spend with the remainder from enterprise and public sector Exhibit 15: Our 2025 software estimates by VR and AR VR use cases driving 75% of our software estimate; as AR technology matures we expect more enterprise use cases to emerge Source: Goldman Sachs Global Investment Research. Source: Goldman Sachs Global Investment Research. As mentioned, we see use cases that are specific to VR, use cases that are specific to AR, and some cases where the two overlap. Our research indicates that AR technology still needs to mature, especially in display technology and the real-time processing and calibration of real-world physical environment. As AR technology matures, we see stronger enterprise use cases emerging especially considering AR enables you to see your physical environment whereas VR completely blocks it. The chicken-and-egg dilemma Before diving into the individual use cases, we note that a key challenge for videogame and entertainment VR use cases is a chicken-and-egg problem where content makers (e.g., videogame publishers, filmmakers) are hesitant to develop VR content without an installed base and consumers are reluctant to buy the technology without content to experience. That said, we see Google, Facebook, Sony and Microsoft trying to solve for this issue on both sides of the equation. On the installed base side, Google has already distributed 2mn Google Cardboard viewers (1mn provided for free via the New York Times) and Oculus is innovating with HMDs with Rift being the first major PC-based device coming to market. In terms of content, Facebook and YouTube have enabled 360-degree videos viewable in VR, and Oculus is creating its own video content with Oculus Story Studio which plans to release 20 VR videogames in 2016, and expects 100 games to be available in total by year- end. Videogames, $11.6bn Live events, $4.1bn Video entertainment, $3.2bn Retail, $1.6bn Real estate, $2.6bn Education, $0.7bn Healthcare, $5.1bn Engineering, $4.7bn Military, $1.4bn AR, $9bn, 25% VR, $26bn, 75%
  • 18.
    January 13, 2016Americas: Technology Goldman Sachs Global Investment Research 18 Videogames VR technology heightens the videogame experience by completely immersing a user in a virtual world while AR technology can turn your physical world into a videogame canvas. We see VR videogames as the first consumer market to develop as we see both the hardware and software further along in development (relative to our other highlighted use cases and to AR gaming) as well as the gamer community eagerly awaiting the technology. We estimate an installed base of ~230mn gaming consoles and ~150mn PC gamers. Our console estimate is based on the installed base of Xbox, PlayStation, and Wii. We believe hardcore gamers (defined as people that play over 15 hours of games per week) will be the first to adopt VR gaming and note that IDC estimates that roughly 30% of PS4 and Xbox One users fall into this category. As for PC gamers, we estimate ~700mn worldwide and ~150mn in developed countries. Given that Oculus will require a high-end PC, we assume that PC gamers in developed countries would be more likely to adopt. One of the key challenges is that current videogames cannot simply be ported to a VR/AR platform. Given our conversations with large videogame publishers like EA Sports and Activision, a new videogame franchise can cost up to ~$75-$100mn to create while subsequent versions of the game can cost as little as ~$10mn. Without a strong installed base of VR hardware devices, videogame publishers are cautious to make investments in new VR game franchises as they can’t be certain of the addressable market. That said, we note the gaming industry can quickly shift with IDC estimating that the mobile gaming market grew to $35bn in 2015, surpassing the console market for the first time. Further, Oculus said in September 2015 that it had 200k developers registered to create games on the VR platform. IDC estimates the total videogame market at $106bn for 2015. We see the potential for VR/AR to be a disruptive force in this market, while also growing the overall market size by attracting new users and increasing the videogame attach rate per user. Our base case, estimates $6.9bn in VR videogame revenue in 2020 and $11.6bn in 2025. To illustrate VR’s potential in the videogame software market, we consider the number of VR gamers, the number of games an average user will buy each year, and the cost that can be charged per game.  Gamers: Our base case assumes there are 70mn VR gamers in 2020 (which would represent 30% of the current 230mn console installed base) and 216mn VR gamers in 2025.  # of games bought per user: In our analysis, we assume VR gamers on average purchase 2.5 games a year then trend down towards 1.0 game per year, which are similar metrics we estimate for Xbox and PlayStation.  Price per game: We believe that VR games will come with pricing in line with current 2D games and assume an initial average price of $60 for a VR game. Exhibit 16: Estimating the potential of the VR videogame software market ($ in mn, users in 000s) Source: Goldman Sachs Global Investment Research. 2016E 2017E 2018E 2019E 2020E 2021E 2022E 2023E 2024E 2025E Installed base of VR gamers - Base case (000s) 3,114 10,320 24,314 45,090 69,646 97,539 117,209 143,070 175,395 215,803 % yoy 231% 136% 85% 54% 40% 20% 22% 23% 23% # of games bought a year 2.5 2.4 2.2 1.9 1.7 1.6 1.5 1.4 1.2 1.1 Price per game $60 $60 $60 $58 $57 $55 $53 $52 $50 $49 % yoy 0% 0% -3% -3% -3% -3% -3% -3% -3% VR video game software revenue $467 $1,486 $3,209 $4,986 $6,878 $8,596 $9,426 $10,044 $10,760 $11,558 % yoy 218% 116% 55% 38% 25% 10% 7% 7% 7% The potential user base The challenges The market disrupted Sizing the revenue opportunity VIDEOGAMES $11.6 billion (2025E base case) 216 million users • First consumer market to develop • Current games cannot be ported to VR/AR platform • New franchise costs are high, but decline with subsequent versions
  • 19.
    January 13, 2016Americas: Technology Goldman Sachs Global Investment Research 19 Live events One of the key VR use cases we see emerging is the streaming of live events (like sports, concerts, world affairs) which solves the problem of limited seating at events and makes events essentially available to anyone and anywhere. Radio once solved this problem with an audio experience, TV currently solves this problem with a 2D viewing experience, and VR has the potential to be the new format in which people watch and experience live events. Watching an event in VR will essentially make a user feel like they’re physically attending the event with the best seat in the house. We see this opportunity initially applying to sports, but also going beyond and note that CNN streamed the first US Democratic presidential debate in VR which was watched across 121 countries. We try to gauge the user base opportunity for live events in VR through TV viewership and subscriber statistics:  715mn people watched the 2006 World Cup final match according to FIFA  160mn people watched the 2015 Super Bowl according to Nielsen  There are ~92mn ESPN subscribers according to Nielsen Further, HBO and Showtime reported that 4.4mn people subscribed to the Mayweather vs Pacquiao boxing match for a $100 fee. While some of these are single events, we’re highlighting that sports events have mass worldwide appeal. The events that could be broadcast in VR go beyond sports to concerts and events of world interest like the wedding of Prince Charles and Lady Diana which drew 750mn viewers. One of the key challenges with VR live events is gaining the rights to broadcast the content. The NFL has TV contracts with Fox, NBC, and CBS but it’s not entirely clear whether or not virtual reality broadcasts fall under these contracts. Another challenge is on the user adoption side as many people watch live events as a social activity and wearing a virtual reality headset would limit interaction. In this respect, we expect much of the entertainment on virtual reality to be consumed individually. PwC estimates $44bn in gate revenue for sporting events in CY15, with the global sports market at $145bn when also including $35bn in media rights revenue, $45bn in sponsorships, and $20bn in merchandising. We don’t expect VR to cannibalize gate revenue as we always expect demand to see events in person. In fact, we believe VR has the potential to create new revenue pools in the form of new ticketing and subscription fees charged to sports fans that want to watch events in VR but can’t attend the event live. Further, media rights revenue is likely to be expanded as the likes of the NBA and FIFA will have more outlets to license to. Our base case assumptions lead to $750mn in revenue in 2020 and $4.1bn in 2025. To size the market, we consider the number of VR users for this use case, the number of events watched a year, and the price per event.  Users: We believe live events will be a popular use case for VR users and estimate 30% penetration of our base-case installed base which equates to 28mn users in 2020 and 95mn in 2025.  Events per year: We estimate that users initially watch 2 events per year, but that slowly increases as more content becomes available to nearly 4 events in 2025. We see this as low with 82 NBA games per season (for each 30 teams), 162 MLB games (for each of the 30 teams), and major sporting events each having playoff and championship games with broad appeal, in addition to the wide range of non-sporting events. The potential user base The challenges The market disrupted Sizing the revenue opportunity LIVE EVENTS $4.1 billion (2025E base case) 95 million users • Examples include sports, concerts and world affairs • Gaining VR broadcast rights is a challenge • Headsets also limit the amount of social interaction possible during streaming
  • 20.
    January 13, 2016Americas: Technology Goldman Sachs Global Investment Research 20  Price per event: Finally, we assume an initial price point of $10 per event, which is a steep discount to an NBA ticket costing $50 on average and events like the Mayweather vs Pacquiao fight costing $100 per TV viewer (and grossing over $300mn in revenue for HBO and Showtime). Exhibit 17: Estimating the potential of a VR live events market ($ in mn, users in 000s) Source: Goldman Sachs Global Investment Research. NextVR is leading the way in watching live sports courtside in virtual reality Feel like you’re at the game from the comfort of your living room The problem: There are only so many seats that a stadium or arena can hold, yet there are people around that world that want to attend sporting events. Costs and location are the primary factors that prevent sports fans from attending events. The NextVR Solution: We spoke with NextVR, a VC-backed company founded in 2009 whose most recent funding round included investments from Time Warner Cable and Comcast. We believe NextVR is furthest along in distributing live events to audiences using VR. It has content arrangements with Comcast and Madison Square Garden. It has partnered with Premier League, the NBA and Turner Sports. The first NBA game NextVR streamed was on October 27, 2015 between the Golden State Warriors and New Orleans Pelicans which was watched across 45 states. This use case has already gone outside of sports as NextVR partnered with CNN to stream a US Democratic presidential debate in VR which was watched across 121 countries. NextVR sees its addressable market as wide-ranging and including sports events, music events, and other popular events like Easter mass at the Vatican. Potential Bottlenecks: NextVR says that despite its attempts to engage all the stakeholders, broadcasting rights are the key challenge. 2016E 2017E 2018E 2019E 2020E 2021E 2022E 2023E 2024E 2025E Installed base of VR/AR headsets - Base case (000s) 3,838 13,391 33,550 60,893 94,587 128,764 165,508 206,316 255,678 315,208 % of installed base using the live events use case 30% 30% 30% 30% 30% 30% 30% 30% 30% 30% # of "live events" VR users 1,151 4,017 10,065 18,268 28,376 38,629 49,652 61,895 76,703 94,563 % yoy 249% 151% 82% 55% 36% 29% 25% 24% 23% # of events per year 2.0 2.0 2.0 2.2 2.5 2.8 3.0 3.2 3.4 3.5 % yoy 0% 10% 10% 10% 10% 8% 8% 5% 5% Implied number of events 8,035 20,130 40,189 70,940 106,230 147,468 198,534 258,335 334,409 Cost per event $0 $10 $10 $10 $11 $11 $11 $12 $12 $12 % yoy 0% 3% 3% 3% 3% 3% 3% 3% VR live event revenue $0 $80 $201 $414 $753 $1,161 $1,660 $2,302 $3,085 $4,113 % yoy 151% 106% 82% 54% 43% 39% 34% 33%
  • 21.
    January 13, 2016Americas: Technology Goldman Sachs Global Investment Research 21 Video entertainment We see VR creating a new form of movie and TV entertainment. Instead of watching a movie on two dimensional screens, users can be completely immersed in the film. The GS Internet Team sizes Netflix’s addressable market at 462mn households, based on the markets that Netflix is in and adjusting for access speeds and credit card penetration. While we see VR as a new form of content, we expect it to appeal to the masses and see the potential user base to be similar to viewers of online video today. We believe in the long-run, VR video content is addressing a similar market. Similar to videogames, creating content is a key challenge for virtual reality video entertainment. To gain the full VR experience, movies must be filmed with a 360-degree camera which means current films cannot simply be ported over. VR is essentially a new storytelling format that will require different writing and producing techniques than traditional movies and TV. In this regard, the cost to produce VR video entertainment is difficult to predict. We actually see the potential for the costs around camera work to be lower in VR as a 360-degree camera reduces the need for multiple cameras and editing work that is typical with 2D video. That said, similar to the challenges with videogames, Hollywood needs to be convinced of the opportunity in VR movies to begin making the investment. We use the GS Internet team’s Netflix TAM of $50bn. We see VR video disrupting the online movie and TV market. Our base case assumptions lead to $750mn in revenue in 2020 and $3.2bn in 2025. To size the market, we consider the number of VR users for this use case and the annual spend these users would pay for VR content.  Users: We believe video will be a popular use case for VR and estimate 25% penetration of the installed base of headsets which equates to 24mn users in 2020 and 79mn in 2025.  Annual spend per user: As VR video content is still in the phase of gaining user adoption and acceptance, we see content being free in the early years but then generating subscription revenue that is supplementary to their 2D video packages as we don’t expect VR video to be a replacement. In this sense, we consider the additional fee consumers would pay for an enhanced video experience and note that IMAX movies come at a 45% premium to a 2D movie ticket. Further, we note that when Netflix initially started offering Blu Ray, the company charged a ~25% premium to standard DVD packages and we view the step to VR video as an incrementally greater experience. For our VR annual subscription ARPU we use a 30% premium to the current Netflix ARPU of $108 (implying that a VR video subscription is incremental to a standard streaming video package). This equates to a VR subscription ARPU of $32 which we apply starting in 2017 and growing 5% annually starting in 2020. Exhibit 18: Estimating the potential of VR video entertainment ($ in mn) Source: Goldman Sachs Global Investment Research. 2016E 2017E 2018E 2019E 2020E 2021E 2022E 2023E 2024E 2025E Installed base of VR/AR headsets - Base case (000s) 3,838 13,391 33,550 60,893 94,587 128,764 165,508 206,316 255,678 315,208 % of installed base using the movie use case 25% 25% 25% 25% 25% 25% 25% 25% 25% 25% # of Video entertainment VR users (000) 959 3,348 8,387 15,223 23,647 32,191 41,377 51,579 63,919 78,802 % yoy 249% 151% 82% 55% 36% 29% 25% 24% 23% Annual subscription fee ($) $0 $32 $32 $32 $32 $34 $35 $37 $39 $41 % yoy 0% 0% 0% 5% 5% 5% 5% 5% VR video entertainment revenue $0 $107 $268 $487 $757 $1,082 $1,460 $1,911 $2,486 $3,218 % yoy 151% 82% 55% 43% 35% 31% 30% 29% The challenges The market disrupted Sizing the revenue opportunity The potential user base VIDEO ENTERTAINMENT $3.2 billion (2025E base case) 79 million users • Similar to videogames, existing films cannot be ported over • VR is creating a new medium for entertainment • A challenge is the availability of new content without a large installed base
  • 22.
    January 13, 2016Americas: Technology Goldman Sachs Global Investment Research 22 IG Port’s VR animated video is adding new value for mobile and amusement parks VR animation as an immersive mobile experience, and an economic makeover for theme parks The problem: Mobile has become a popular means of video consumption but it lacks the same level of engagement versus viewing at a movie theater or even a home television. A separate problem is that amusement parks face large investment risk when renewing attractions, as well as the necessity for closure during physical renovations. The IG Port solution: We spoke with IG Port, a Japanese animated film production company that has recently been investing in VR content. The company sees VR short films helping to solve both issues above. Downloading VR short movies via mobile and watching them through HMDs would enable users to slip into the immersive world, while keeping the value proposition of mobile. Amusement parks can install “VR entertainment centers” where virtual worlds are layered on top of the physical world. Amusement parks could then easily renovate attractions by changing VR video content to completely change the consumer experience. IG released the pilot movie “Ghost in the Shell” (3min, 31sec) on YouTube on November 24, 2015 and the unadvertised pilot has been viewed 400,000 times. The company is planning to release a full version of the movie (10 minutes) in February available at Google Play and the App Store for 480 yen per download (~$4 USD), and is expecting total downloads of 200,000. According to the company, production costs for the 10 minute movie were less than $1mn with no new equipment installation needed. The company estimates that the optimal amount of time viewed on VR content is about 10-20 minutes, so by creating such content, they could distribute via mobile apps as well as to amusement parks. The company now licenses its animated film “Attack on Titan” to Universal Studios Japan, and is aiming to introduce their animated VR content to other amusement parks going forward. The potential user base: There are more than 80 major amusement parks globally, and if each installs at least one 360- degree video attraction, and switches the VR content seasonally (4 times a year), the addressable market would be 320 VR short movies for attractions (Hollywood’s number of movies produced annually is around 600-700). Constraints: Uptake at amusement parks depends on parks’ installation of VR entertainment centers. In animated content, production costs do not seem to be a large concern. Exhibit 19: Image of IG Port’s VR movie “Ghost in the Shell” Source: IG Port
  • 23.
    January 13, 2016Americas: Technology Goldman Sachs Global Investment Research 23 Retail Ecommerce is a $1.5tr market today and represents 6% of all retail spending worldwide. While not frequently discussed, we believe high-end portions of the market that have been challenging for the internet to penetrate can be revolutionized due to the adoption of VR and AR technology.  Home Improvement store Lowe’s has a “Holoroom” at 6 of its stores where shoppers can configure kitchens and bathrooms and view their designs with Oculus devices.  Microsoft and Volvo announced a partnership and have performed a demo where HoloLens can be used by consumers to configure cars at a dealership.  There is also an apparel shopping use case, where consumers could use VR/AR to see how clothes look on them without physically trying them on. The key challenge is developing software that works with VR/AR devices for these specific commerce use cases. Whether you’re envisioning a remodeled kitchen, a new car, how certain pieces of furniture might look in your home, or how clothes look on you, the experience needs to be easy for the consumer to use and be realistic. We use the 1bn online shoppers (according to Internet Retailer) as a gauge. In the long- run, we see the shopping use case for VR/AR to be available to any shopper. We consider the $3bn ecommerce software market as the main revenue pool VR/AR software will play into, as this market is comprised of tech investments that retailers make to serve their customers. We see VR/AR disrupting retail markets where companies can garner a competitive advantage by using the technology and as such have the ability to increase share of their existing market. We see an opportunity for this in the near-term with the $180bn home improvement market (Bureau of Economic Analysis) and the $260bn apparel market (Euromonitor). Further, we see the potential for VR/AR to reduce the need for in-store displays and possible erode the value of a physical store. Our base case assumptions lead to $500mn in VR retail software revenue in 2020 and $1.6bn in 2025. We see VR/AR as a technology that retailers will have to invest in to serve their customers and keep ahead of their competition. Ecommerce software companies like Demandware charge their customers on a revenue/share basis where Demandware gets 1-2% of the sales that run through its platform. We believe VR/AR sales could operate in a similar model. To estimate the market size, we consider the number of users (assuming just 1 transaction per year), and the average size of transaction (assuming a 1% take rate similar to Demandware).  Users: On our base case, we’re assuming just 5% of the VR/AR installed base engages in VR shopping.  Average transaction size: We assume an average transaction size of $5k as we believe VR will be used for higher-end purchases, but this is still a steep discount to the average cost to remodel a kitchen at $19k (HomeAdvisor) and the average new car cost of $34k (Kelley Blue Book). These assumptions imply $158bn in 2025 of consumer sales transacted through VR/AR versus $1.5tr in ecommerce revenue today. For the retail use case of VR/AR, we’re less focused on the software revenue opportunity and instead focus on the disruption potentially caused in retail markets the technology can serve. The potential user base The challenges The market disrupted Sizing the revenue opportunity RETAIL $1.6 billion (2025E base case) 32 million users • Emerging use cases in home improvement, apparel and auto industries • Key challenge is developing realistic, easy-to-use software • We anticipate VR/AR will be used for higher-end purchases
  • 24.
    January 13, 2016Americas: Technology Goldman Sachs Global Investment Research 24 Exhibit 20: Estimating the potential of a VR/AR retail software market ($ in mn, users in 000s) Source: Goldman Sachs Global Investment Research. 2016E 2017E 2018E 2019E 2020E 2021E 2022E 2023E 2024E 2025E Installed base of VR/AR headsets - Base case (000s) 3,838 13,391 33,550 60,893 94,587 128,764 165,508 206,316 255,678 315,208 % of installed base using the shopping case 5.0% 8.0% 9.0% 10.0% 10.0% 10.0% 10.0% 10.0% 10.0% Shopping VR/AR users (000s) 670 2,684 5,480 9,459 12,876 16,551 20,632 25,568 31,521 % yoy 301% 104% 73% 36% 29% 25% 24% 23% Transaction per user 1.0 1.0 1.0 1.0 1.0 1.0 1.0 1.0 1.0 Average cost of transaction ($) $5,000 $5,000 $5,000 $5,000 $5,000 $5,000 $5,000 $5,000 $5,000 Retail sales through VR/AR $3,348 $13,420 $27,402 $47,294 $64,382 $82,754 $103,158 $127,839 $157,604 VR/AR take rate 1.0% 1.0% 1.0% 1.0% 1.0% 1.0% 1.0% 1.0% 1.0% VR/AR retail software revenue $0 $33 $134 $274 $473 $644 $828 $1,032 $1,278 $1,576 % yoy 301% 104% 73% 36% 29% 25% 24% 23%
  • 25.
    January 13, 2016Americas: Technology Goldman Sachs Global Investment Research 25 Volvo is using AR to enhance auto purchases AR can lead to a more efficient car buying experience. The problem: Shopping for a car can be frustrating when a specific color or trim you’re interested in isn’t available on the lot. This can lengthen the buying process if the buyer isn’t satisfied with the available inventory and decides to try another dealership. On the other hand, car manufacturers are burdened by the cost of dealer real estate in a world where the number of variants each manufacturer sells has been proliferating, so accommodating them in a building becomes even more challenging. More innovative manufacturers are trying to circumvent the dealer model altogether with direct online sales and urban showrooms, and servicing brought to the customer. The Volvo solution: We spoke with Volvo, which announced a partnership with Microsoft in November where HoloLens can be used by consumers to configure cars. Volvo recently hosted a demo of a virtual showroom in collaboration with Microsoft HoloLens. The demo showed the ability to construct and view a virtual car and strip away the body to see the underlying skeleton. Further down the line, Volvo also envisions AR technology improving the process of servicing cars and enhancing safety features. The value proposition: We see the ability to construct realistic images of cars on-site based on a customer’s specifications improving conversion of uncertain buyers that pass through dealerships. We also see efficiency gains as dealerships are able to market cars to consumers which have yet to be manufactured and reduce the number of cars on the lot, potentially saving on dealer real estate costs. For context, GS currently estimates full year 2015 auto sales of 17.5mn vehicles in the US. Potential bottlenecks: Volvo acknowledged that the Microsoft demo was in a controlled environment and that there will be particular challenges recreating this experience in pop-up locations. Still, Volvo expects to incorporate HoloLens into its shopping experience in 2016. Exhibit 21: Volvo plans to incorporate HoloLens into its customer experience in 2016 Source: Volvo, YouTube
  • 26.
    January 13, 2016Americas: Technology Goldman Sachs Global Investment Research 26 Real estate We see the potential for VR to drive consumer purchasing in real estate and note that Sotheby’s is experimenting with VR to show homes to prospective buyers. We see shifts like VR changing the industry as companies emerge to go after a portion of the commission dollars on these transactions. We see a potential user base of 1.4mn registered real estate agents. Real estate is a market where the lines between consumer use and business use begin to blur:  Real estate agents will want VR devices for the prospective clients to use.  Homebuyers would want their own devices to be able to view homes without an agent. In terms of the addressable user base, we focus on countries that have large online real estate classifieds markets including the US, Japan, Germany, and the UK. There are 1.2mn registered real estate agents in the US, 123k in Japan, 32k in Germany, and 22k in the UK according to data from the National Association of Realtors (NAR), OC&C Strategy Consultants, and the Japan Ministry of Land, Infrastructure, Transport and Tourism. The key challenge for the real estate use case is that VR content for homes must be captured with a 360-degree camera which can be costly and labor-intensive. We estimate an aggregate real estate commissions market of $107bn using our data sources for registered real estate agents as well as data from Borrell Associates and the Land Institute of Japan, with $52bn in the US, $38bn in Japan, $9bn in the UK, and $8bn in Germany. For the US commission pool, 53% ($27bn) is retained for profit, 17% ($9bn) goes to marketing, and 30% ($16bn) goes to the brokerage. We believe VR technology could draw spend from either the marketing budget or brokerage budget. Our base case assumptions lead to $750mn in revenue in 2020 and $2.6bn in 2025. To size the market, we consider the number of agents using VR as a selling tool and the potential average annual spend. The agents on Zillow’s platform have an average annual spend of $4,100. We believe the value proposition of a VR home listing ad can significantly outweigh that of an online ad. For 2020, we estimate 130k real estate agents using VR to show homes with an annual spend of $5,000 (a 20% premium to Zillow’s current ARPU) which we believe can grow 10% annually which is below Zillow’s ARPU growth rate for the last two years. In light of a $107bn real estate commission market and given that VR has the potential to change the business model, we see these estimates as conservative. Exhibit 22: Estimating the potential of a VR real estate market ($ in mn, users in 000s) Source: Goldman Sachs Global Investment Research. 2016E 2017E 2018E 2019E 2020E 2021E 2022E 2023E 2024E 2025E Real estate VR/AR users (000) 5 25 50 100 150 180 216 248 283 317 % yoy 100% 100% 50% 20% 20% 15% 14% 12% Average annual spend $0 $2,000 $4,000 $4,400 $5,000 $5,500 $6,050 $6,655 $7,321 $8,053 % yoy 100% 10% 14% 10% 10% 10% 10% 10% VR real estate revenue $0 $50 $200 $440 $750 $990 $1,307 $1,653 $2,073 $2,554 % yoy 300% 120% 70% 32% 32% 27% 25% 23% The potential user base The challenges The market disrupted Sizing the revenue opportunity REAL ESTATE $2.6 billion (2025E base case) 300,000 users • VR to draw spend from $107bn commissions market (US, Japan, Germany, UK) • Sotheby's is already experimenting with VR • Rate of capture for VR content a key challenge to broader adoption
  • 27.
    January 13, 2016Americas: Technology Goldman Sachs Global Investment Research 27 Matterport is building out the virtual real estate market VR can increase transparency and eliminate friction in real estate transactions The problem: Ecommerce has enabled people to buy products without going to the store. But with more complex or valuable purchases, a few pictures on a website aren’t enough to make a decision. This is particularly true with residential real estate, where buyers expect to see the house or apartment firsthand before moving forward as wide- angle photos in 2D can be deceiving. But this can be costly and time consuming, especially with international transactions. The Matterport solution: We spoke with Matterport, a VC-backed company founded in 2011 which aims to enable realtors to “immerse clients in 15 homes in 15 minutes.” Matterport builds 3D models of real-world spaces primarily targeting the real estate market, which are viewed on PCs, mobile devices, and increasingly HMDs. Matterport’s end-to- end platform for capturing, hosting and distributing 3D models includes a user-friendly 3D camera which sells for $4,500, a cloud based system for producing and hosting 3D models, and a portal for content creators to manage and distribute their 3D models. Customers pay Matterport a monthly rate based on the # of models captured, with models over a certain size counting as 2. Apartments.com recently partnered with Matterport to create 30,765 3D virtual tours of rental properties, giving online browsers a more accurate and immersive sense of each listing. The company has found that visitors to its site spend 3x the amount of time engaging with a listing that has a Matterport 3D tour compared to ones that don’t. VR is the next step: At this point, Matterport has rolled out a beta version of its VR showcasing service which lets customers convert 3D models for viewing through an HMD. Viewing models in VR gives prospective renters a sense of being at the site, and we see virtual walk-throughs as the key next step in narrowing or closing housing searches without an in-person visit. This leads to cost savings associated with travel, as well as potential market expansion as virtual real estate inventory in remote locations is captured and made accessible to more consumers. Potential bottlenecks: The process for capturing content is somewhat manual. While Matterport was able to provide Apartments.com with 1,000 3D models of listings per week since the start of their partnership, we see automation leading to a higher rate of capture and a general proliferation in content. Exhibit 23: Matterport’s VR showcase using HMDs is currently available in beta Source: Matterport
  • 28.
    January 13, 2016Americas: Technology Goldman Sachs Global Investment Research 28 Healthcare We see several use cases for VR/AR technology in healthcare: 1) as a tool to aid doctors in medical procedures and day-to-day tasks, 2) for physical therapy and to treat phobias like fear of heights, and 3) to increase access to doctors through virtual visits. 1. When Google Glass was first introduced, Google offered select hospitals Glass devices to test the product. During these trials, surgeons used Google Glass for a range of functions, like projecting CT scans and MRIs on to the field of vision as he or she would operate, scanning bar codes to gain basic medical information about the patient, and alerting the doctor with lab results. 2. In the therapy use case, VR can treat patients with anxiety disorders (such as PTSD) or phobias. These virtual worlds can create artificial, controlled stimuli in order to habituate the patient to those environments that cause anxiety. VR can also be used to rehabilitate patients, such as amputees. 3. We also see an opportunity for VR/AR to increase consumer access to doctors. Doctors are already conducting video-based visits and VR can enhance that experience. We estimate there are ~8mn physicians and EMTs globally that could use VR/AR technology according to data from the Organisation of Economic Co-operation and Development (OECD), the America Medical Association (AMA) and US Bureau of Labor Statistics. In the US, there are ~1.5mn medical professionals which could serve as the addressable user base of VR/AR, with ~740k specialty physicians, ~500k primary care physicians, and 240k EMTs. In speaking with doctors about Google Glass, privacy was a concern as data transmitted to the device was not encrypted and violated HIPAA regulations. Additionally, for specialty physician use cases the software required would need to be complex and precise. We see VR/AR applications in healthcare disrupting a $16bn market for patient monitoring devices according to Research and Markets. Our base case estimates $1.2bn in revenue in 2020 and $5.1bn in 2025. While the number of doctors that could potentially use VR/AR devices is relatively small when compared to the consumer market, we believe the bigger market opportunity will be in specialized software versus the hardware sold. While it’s difficult to gauge how much VR/AR software will cost for specialized medical use, we note that specialized computer- aided design (CAD) software for architects and engineers can range from $1,000-$5,000 per year and use this as a comp as we see specialized medical software also requiring a high- degree of precision. In our base case, we estimate that 800k EMTs and physicians use VR/AR technology in 2020 and 3.4mn in 2025 at an assumed subscription software cost of $1,500. Exhibit 24: Estimating the potential of a VR/AR healthcare market ($ in mn, users in 000s) Source: Goldman Sachs Global Investment Research. 2016E 2017E 2018E 2019E 2020E 2021E 2022E 2023E 2024E 2025E Healthcare VR/AR users (000s) 100 200 500 800 1,200 1,680 2,268 2,835 3,402 % yoy 100% 150% 60% 50% 40% 35% 25% 20% Annual software costs ($) $0 $1,500 $1,500 $1,500 $1,500 $1,500 $1,500 $1,500 $1,500 $1,500 VR/AR healthcare revenue $0 $150 $300 $750 $1,200 $1,800 $2,520 $3,402 $4,253 $5,103 % yoy 100% 150% 60% 50% 40% 35% 25% 20% The potential user base The challenges The market disrupted Sizing the revenue opportunity HEALTHCARE $5.1 billion (2025E base case) 3.4 million users • VR/AR has potential to treat phobias and aid in medical procedures • Can also aid in day-to-day tasks as a hands-free device • Data privacy and software development could limit uptake
  • 29.
    January 13, 2016Americas: Technology Goldman Sachs Global Investment Research 29 Atheer is enabling AR as a hands-free medical tool for doctors and EMTs AR improving patient care The problem: Medical professionals need quick and real-time access to information but often they’re already using their hands and need to focus on the patient. The Atheer solution: We spoke with Atheer Labs, a VC-backed startup founded in 2011 which makes an augmented reality HMD (AiR Glasses) and a software platform (AiR Suite) targeting “deskless professionals” that need rich information without having to hold a computer. Atheer breaks deskless professionals down into four categories: fixing, assembling, surveying, and treating. Atheer sells its AR glasses for $4,000 and sells its software on a subscription basis for $600 per user per year for the basic suite. With regards to “treating”, Atheer’s AR platform can provide real-time information to medical professionals without using their hands. They can interact with information presented within their field of view with gestures, voice commands, and motion controls. Given that the system is hands free, it can reduce contamination. The demand is there: We also spoke with a doctor at the Hospital of the University of Pennsylvania who had tested Google Glass and sees value in EMTs and trauma centers providing video feeds to doctors with a needed expertise. She also sees potential for AR to help in walking medical professionals through uncommon scenarios. For example, since cardiac arrests are uncommon in pediatrics, a doctor could rely on the algorithm for cardiac arrest popping up in her peripheral. Exhibit 25: Atheer’s vision of AR in use in the medical industry Source: Atheer
  • 30.
    January 13, 2016Americas: Technology Goldman Sachs Global Investment Research 30 Education We believe VR/AR technology has the potential to be a standard tool in education and could revolutionize the way in which students are taught for both the K-12 segment and higher education (college and beyond). Teachers can use VR/AR as a way for students to interact with objects in a 3D environment. For example, students can learn about the solar system or a historical event by interacting with those virtual worlds. Google is pushing forward in this market by offering Cardboard to schools for free and has already developed over 100 “virtual field trips.” We’re also seeing traction of virtual reality at the higher end of the market with medical schools experimenting with AR. The iPad has had strong success in the education market and we believe VR/AR can provide an incremental experience. Apple does not frequently provide granular metrics around unit shipments, but in March 2013 the company said that since the 2010 launch, the company had shipped 8mn iPads to educational institutions worldwide with 4.5mn shipments in the US. This means in 3 years, 7% of Apple’s 121mn shipments were for education alone. There are 200mn primary and secondary students in the developed countries according to the World Bank. In the US, there are 50mn K-12 students and 20mn college students, according to the National Center for Education. New educational content can be difficult to create, especially as students move from preliminary schooling to higher education. Gartner sizes the global education software market at ~$12bn for 2015, consisting of the K-12 education software market at $5.2bn and the higher education (college and beyond) software market at $6.6bn. We assume $300mn in educational software revenue in 2020 and $700mn in 2025. While we believe in the impact that VR/AR could have in education, we’re being conservative in our assumptions and estimate that it would take 5 years to sell 8mn VR/AR units versus Apple selling 8mn iPads in its first 3 years. Further, we believe that VR/AR will first take shape in the K-12 market as more of an interactive tool and believe that graduate educational VR/AR software in subjects like medicine and engineering could be given away for free to get users accustomed to the software as this is a typical marketing strategy for engineering software vendors like Autodesk. After this initial phase, we’re estimating the average annual cost of educational software per K-12 student of $50 versus an iPad curriculum costing $75. While we believe VR can revolutionize education, we don’t expect full curriculums to be taught in VR at this point and acknowledge the education budgets are strapped as it is. We don’t see education as a material revenue generator, but greater benefits in growing adoption as students become accustomed to the VR/AR technology. Exhibit 26: Estimating the potential of the education VR/AR market ($ in mn, users in 000s) Source: Company data, Goldman Sachs Global Investment Research. 2016E 2017E 2018E 2019E 2020E 2021E 2022E 2023E 2024E 2025E K-12 educational VR/AR users (000s) 200 700 1,500 3,000 6,500 8,000 9,600 11,040 12,696 14,600 % yoy 250% 114% 100% 117% 23% 20% 15% 15% 15% Annual software cost ($) $0 $0 $50 $50 $50 $50 $50 $50 $50 $50 VR/AR Educational revenue $0 $0 $75 $150 $325 $400 $480 $552 $635 $730 % yoy 100% 117% 23% 20% 15% 15% 15% The potential user base The challenges The market disrupted Sizing the revenue opportunity EDUCATION $700 million (2025E base case) 15 million users • Use cases span K-12, higher education • Apple shipped 8mn iPads to educational institutions in the first 3 years since launch • Strapped education budgets could limit uptake
  • 31.
    January 13, 2016Americas: Technology Goldman Sachs Global Investment Research 31 Military The US military has been using virtual reality for training purposes since at least 2012 with proprietary hardware and software. Examples of simulations currently used include flight simulations, battlefield simulations, and medic training. These simulations help soldiers train for dangerous settings in a more cost effective manner than traditional approaches. According to the World Bank, there are ~6.9mn military personnel in “high- income” countries. In the US, there are about 475k personnel in the US Army, 320k in the Airforce, 330k in the Navy, and 185k in the Marines. A survey conducted by the Government Business Council (GBC) in 2014 notes that the main challenge with simulation training was “fidelity”, implying that simulations did not feel real enough. The global military simulation and training market is estimated to be $9.3bn according to CAE, a military contractor. Of this budget, $3.8bn is allocated to flight simulation which saves costs versus training on actual fighter jets; indeed, the US Airforce is expected to save $1.7bn from FY12-16 (~$400mn annually) by using flight simulators according to GBC. That said, while flight simulation is driving cost savings, the list price of a full-flight air simulator is still over $10mn. If some portions of flight simulation training can be replaced with VR hardware and software, the incremental cost savings could be material. Flight simulation is just one example of how VR could drive cost savings in the military and we see battlefield simulations and medic training as other potential opportunities. Our base case estimates $500mn in software revenue in 2020 and $1.4bn in 2025. We believe the number of VR/AR headsets that the military purchases could be widespread, but believe these are likely to be proprietary headsets that are only for sale to the military, similar to night vision goggles and as such we’re not incorporating these unit sales into our forecast at this time. To size the VR/AR software market, we believe we are being conservative in our assumptions to take small portions of the global $9.3bn military simulation and training budgets. For 2025, we assume 15% of the military simulation and training spend can go toward VR which equates to $1.4bn. To test the reasonableness of this assumption, we note that this would imply 700k users (vs 6.9mn military personnel in “high income” countries) at an annual VR software cost of $2,000. Exhibit 27: Estimating the potential Military VR software market ($ in mn) Source: Goldman Sachs Global Investment Research. 2016E 2017E 2018E 2019E 2020E 2021E 2022E 2023E 2024E 2025E Defense and Training market $9,300 $9,300 $9,300 $9,300 $9,300 $9,300 $9,300 $9,300 $9,300 $9,300 % VR revenue 1% 2% 3% 4% 5% 7% 9% 11% 13% 15% VR/AR Military revenue $93 $186 $279 $372 $465 $651 $837 $1,023 $1,209 $1,395 % yoy 100% 50% 33% 25% 40% 29% 22% 18% 15% The potential user base The challenges The market disrupted Sizing the revenue opportunity MILITARY $1.4 billion (2025E base case) 700,000 users • US military has been using VR technology for training for several years • Potential use cases include flight and battle simulation, medic training • “Fidelity” cited as a main challenge to adoption
  • 32.
    January 13, 2016Americas: Technology Goldman Sachs Global Investment Research 32 Engineering We see VR/AR technology disrupting both the computer-aided manufacturing (CAM) and computer-aided design (CAD) markets. In product manufacturing, VR/AR can enable engineers to test scenarios and designs before the products are made, driving productivity and cutting down on the cost of wasted materials. According to Forbes, Ford has been using virtual technology to design cars since 2000. We estimate 6mn engineers in the US, Europe and Japan according to data from the US Bureau of Labor, Eurostat, and Statistics Japan. While large automotive companies might have the resources to develop their own VR software, not all engineers have this access. Engineering software needs to be developed by specific industry and there could be a learning ramp to use the software and adjust engineering techniques. The global engineering software market is $20bn in 2015 according to Research and Markets. We estimate $1.5bn in software revenue in 2020 and $4.7bn in 2025. To size the market, we consider the number of engineers that could use VR/AR and the annual subscription cost of the software.  Users: In our base case, we estimate that 1mn engineers use VR/AR technology in 2020 and 3.2mn in 2025.  Annual subscription fee: As mentioned, computer-aided design (CAD) software for architects and engineers can range from $1,000-$5,000 per year and we use this as a comp for VR engineering software, which we conservatively assume costs $1,500. Exhibit 28: Estimating the potential of a VR/AR engineering software market ($ in mn, users in 000s) Source: Goldman Sachs Global Investment Research. 2016E 2017E 2018E 2019E 2020E 2021E 2022E 2023E 2024E 2025E Engineering VR/AR users (000s) 200 600 900 1,000 1,350 1,755 2,194 2,633 3,159 % yoy 200% 50% 11% 35% 30% 25% 20% 20% Annual subscription fee ($) $0 $1,500 $1,500 $1,500 $1,500 $1,500 $1,500 $1,500 $1,500 $1,500 VR/AR engineering revenue $0 $300 $900 $1,350 $1,500 $2,025 $2,633 $3,291 $3,949 $4,739 % yoy 200% 50% 11% 35% 30% 25% 20% 20% The challenges The market disrupted Sizing the revenue opportunity The potential user base ENGINEERING $4.7 billion (2025E base case) 3.2 million users • Potential to disrupt the computer-aided design and manufacturing markets • Allows engineers to test scenarios and designs before products are made • Challenges to adoption include software development, learning curve
  • 33.
    January 13, 2016Americas: Technology Goldman Sachs Global Investment Research 33 Autodesk is using AR to enhance CAD Designers can use AR to visualize 3D models in real-world context, avoiding costly errors and improving collaboration The problem: While CAD software has come a long way in improving the design process, it still has its limits. For example, CAD is still generally constrained by the need to work on a 2D monitor. This limits the ability to view full-sized objects in real-world context and hinders true collaboration when multiple people are working on the same design. The Autodesk solution: Autodesk is a leading design software company with $2.5bn in annual revenues and with customers primarily in the architecture, engineering, construction and manufacturing verticals. We spoke with Autodesk’s emerging technology division, which is working with Microsoft HoloLens to incorporate AR into CAD. Autodesk’s VRED 3D visualization software product is currently used by auto makers to project things like doors and colors onto clay car models. Wide-ranging applications: Autodesk envisions AR improving the design of items as small as videogame controllers or as large as buildings, with the view that having the true 1-to-1 scale that’s not possible in 2D can go a long way toward avoiding errors. Autodesk also sees value in looking at a 3D model and having metadata information behind the CAD at your fingertips. Finally, if two people are collaborating on a project, they are better able to work through issues as they go as opposed to working on separate desktops and realizing there are issues when they come together. Given the wide range of CAD use cases, we see potential for AR to impact Autodesk’s base of 5mn customers worldwide. Potential bottlenecks: The computing power of AR systems needs to improve to run large CAD files. Exhibit 29: Autodesk is working with Microsoft Source: Autodesk
  • 34.
    January 13, 2016Americas: Technology Goldman Sachs Global Investment Research 34 While we’ve outlined 9 core use cases for VR/AR where major markets can be disrupted, we also see niche use cases developing like the following highlighted example in athletic training. STRIVR Labs is using VR headsets to train athletes VR can provide a true game-like training experience The problem: Athletic teams want to get as much practice as possible. But they are bound by time and resource constraints, such as gathering players and staff at a practice facility during set times. In the case of training a quarterback, this means assembling 21 other players to simulate in-game scenarios, as well as various coaching and medical staff. The STRIVR Labs solution: We spoke with STRIVR Labs, a privately-held startup co-founded in 2015 by former Stanford University football players Derek Belch and Trent Edwards and Stanford professor Jeremy Bailenson (VR expert and head of Stanford’s Virtual Human Interaction Lab). STRIVR builds an inventory of on-field scenarios by using multitudes of cameras to shoot from various angles, enabling a player to get the full 360-degree in-game perspective (compared with the 3rd-party POV enabled by watching game film). STRIVR uses real video as opposed to animations or CGI because its research has shown that the brain scientifically "shuts off" if it isn't visualizing the real human game. VR enables players to get realistic practice reps anywhere they can connect a head mounted device. Value proposition driven by on-field results: Quarterback Kevin Hogan’s and Stanford’s overall offensive statistics improved in many areas subsequent to Hogan’s use of VR training, including pass completion percentage and overall points per game. STRIVR has contracts in place with 6 of 32 NFL teams and 12 collegiate teams. The startup also has deals in place for other sports, including three teams in the DC metro area. Potential bottlenecks: There is a challenge in virtualizing scenarios where the player is moving a lot. Current use cases are for practicing relatively stationary positions such as a quarterback in football or a goalie in soccer. Exhibit 30: STRIVR enables quarterbacks to get realistic practice reps off the field Source: STRIVR Labs
  • 35.
    January 13, 2016Americas: Technology Goldman Sachs Global Investment Research 35 Details behind our hardware forecasts In this section, we lay out the details underlying our three hardware forecast scenarios introduced in the “Our hardware and unit forecasts” section from earlier in this report. Building a framework for volume adoption 1. We begin by laying out our “accelerated uptake”, base, and “delayed uptake” scenarios for HMD shipments in the medium-term (2015-2020). For this period, we believe it is important to understand specific players, applications and end markets that could adopt virtual/augmented reality HMDs. As such, we see a bottom-up forecast as more suitable and contemplate three penetration scenarios into (1) console and PC gamers, (2) the Samsung Galaxy installed base, (3) the high-end TV installed base, and (4) enterprise markets per our use cases (e.g., healthcare, engineering). 2. Using our base case scenario for HMD shipments through 2020 described above, we then lay out three scenarios for longer-term shipments (2020-2025). We believe in the long term, virtual/augmented reality has an opportunity to become the next major computing platform. As such, we see a top down-approach using the mass adoption curves of past computing platforms as more appropriate to gauge the growth potential for this period. We contemplate scenarios which mirror the mass adoption rates of smartphones (accelerated uptake case), tablets (base case) and PCs (delayed uptake case). Exhibit 31: We believe VR/AR could be the next computing platform if technology barriers are overcome Framework to size the HMD hardware unit growth Source: Goldman Sachs Global Investment Research.
  • 36.
    January 13, 2016Americas: Technology Goldman Sachs Global Investment Research 36 1. Medium-term hardware forecast The following exhibit outlines our unit shipment forecasts by type: game console and PC games, Samsung Galaxy smartphones, TV and other vertical markets. Exhibit 32: We assume 43mn headset shipments in our base case by 2020 Our VR headset estimates Source: Goldman Sachs Global Investment Research VR gaming hardware market The gaming industry has seen growth in two directions over the past 5 years. The emergence of online multiplayer games like “Call of Duty” has created a sticky and growing user base of over 60mn hardcore console users, while the proliferation of smartphones has opened up a gaming market for billions. We note that gamers have been interested in VR in the past and in 1995 Nintendo sold 770k units of the Virtual Boy console in its first year but the technology was limited and the product was discontinued the following year. Since 1995, VR has made significant advances and we don’t expect the technology to let gamers down in 2016. The following exhibit shows the active user base for PS4, Xbox One, and Steam. Adoption of PlayStation 4 has been the fastest of any of the PlayStation branded consoles in history. We estimate that the PlayStation and Xbox franchises collectively have 188mn of the global console installed base by 2020 (we assume hardware renewal along the way). In terms of active users, we also considered the presence of Steam, which is a PC gaming platform operated by Valve Corporation. In 2015, Valve claimed that Steam had 125mn active users, although the term “active user” was not defined. According to company statistics, the platform does have 10mn log-ins per day, which we assume is comparable to the monthly active user base of the console platforms. 3.8 9.6 20.2 30.9 42.9 6.8 13.3 30.1 44.4 57.0 2.1 5.1 7.6 16.3 27.1 0 10 20 30 40 50 60 2016E 2017E 2018E 2019E 2020E 2016E 2017E 2018E 2019E 2020E 2016E 2017E 2018E 2019E 2020E VRheadsetunits(mn) Other vertical markets TV add-on GearVR Console and PC Gaming Base case Delayed uptakeAccelerated uptake
  • 37.
    January 13, 2016Americas: Technology Goldman Sachs Global Investment Research 37 Exhibit 33: Installed base by platform Active userbase (monthly active users for PS4/Xbox, undefined by Steam) Source: Company data, IDC, Goldman Sachs Global Investment Research We define hardcore gamers as people who play over 15 hours of games per week, with IDC revealing 30% of PS4 and Xbox One users fall into this category. In 2014, NPD Group reported there were 34mn core gamers on PlayStation 3 & 4, Xbox One & 360, PC, and Mac who played an average of 22 hours of gaming per week. Base case. Given the 30% ratio of the console installed base consisting of hardcore gamers, we set this as the 5 year-term penetration goal of VR headsets. We favor Sony’s PlayStation platform as an initial driver of VR penetration due to the high concentration of hardcore gamers on the platform, the likely seamless integration of the VR and host machines (due to the same company designing and selling the VR, software, and hardware), and content availability. Sony has announced its flagship racing title, GranTurismo, will be available on PSVR. Steam, in our view, is second most likely to penetrate VR gaming, with wide availability of content and its collaboration with HTC and Oculus. Exhibit 34: 30% adoption would imply the conversion of most hardcore users Our assumption of VR gamers as % of console active users Source: Goldman Sachs Global Investment Research The following exhibit highlights unit shipment assumptions for 4 major players in VR gaming. 100  125  141  148  155  163  171  180  4  18  35  50  65  79  94  105  4  11  18  24  31  40  47  52  0 50 100 150 200 250 300 350 400 2013 2014 2015E 2016E 2017E 2018E 2019E 2020E Active users (mn ) Xbox One (and later) PlayStation 4 (and later) Steam 3% 30% 1% 9% 1% 15% 0% 5% 10% 15% 20% 25% 30% 35% 2016E 2017E 2018E 2019E 2020E PlayStation 4 Xbox One Steam
  • 38.
    January 13, 2016Americas: Technology Goldman Sachs Global Investment Research 38 Exhibit 35: Our assumptions on VR gaming Source: Company data, Goldman Sachs Global Investment Research Console and PC Gaming 2015E 2016E 2017E 2018E 2019E 2020E 12/2015 12/2016 12/2017 12/2018 12/2019 12/2020 Global shipment PlayStation 4 (and later) 18,700 18,000 18,000 18,000 17,500 17,000 Xbox One (and later) 7,490 8,000 8,500 9,000 8,000 7,500 Steam - N/A VR user base as % of total PlayStation 4 0% 3% 7% 15% 22% 30% Xbox One 0% 1% 2% 5% 7% 9% Steam 0% 1% 3% 6% 10% 15% VR gaming users by platform (000s) PlayStation 4 0 1,511 4,543 11,807 20,589 31,648 Xbox One 0 122 622 2,006 3,264 4,673 Steam 0 1,481 4,664 9,794 17,139 26,993 Other PC platforms 0 491 708 4,099 6,331 Total 0 3,114 10,320 24,314 45,090 69,646 VR users by device(000s) PlayStation VR 0 1,511 4,543 11,807 20,589 31,648 Xbox One (device not determined) 0 122 622 2,006 3,264 4,673 Oculus 0 444 1,424 3,059 9,241 19,828 HTC Vive 0 1,036 3,731 7,443 11,997 13,497 Total 0 3,114 10,320 24,314 45,090 69,646 New headset shipment (000s) PlayStation VR 0.0 1,511.2 3,031.9 7,263.4 8,782.2 11,059.2 Xbox One (device not determined) 0.0 122.2 499.8 1,383.9 1,257.7 1,409.8 Oculus 0.0 444.2 980.0 1,634.5 6,182.1 10,587.5 HTC Vive 0.0 1,036.4 2,694.5 3,712.2 4,554.0 1,499.6 Total 0 3,114 7,206 13,994 20,776 24,556 VR user base as % of total PlayStation 4 0% 3% 7% 15% 22% 30% Xbox One 0% 3% 7% 15% 22% 30% Steam 0% 3% 7% 15% 22% 30% VR gaming users by platform (000s) PlayStation 4 0 1,511 4,543 11,807 20,589 31,648 Xbox One 0 733 2,177 6,018 10,257 15,578 Steam 0 4,442 10,882 24,484 37,705 53,987 Other PC platforms 0 880 1,269 6,855 10,121 Total 0 6,686 18,482 43,577 75,406 111,334 VR users by device(000s) PlayStation VR 0 1,511 4,543 11,807 20,589 31,648 Xbox One (device not determined) 0 733 2,177 6,018 10,257 15,578 Oculus 0 1,332 3,056 7,145 18,167 37,115 HTC Vive 0 3,109 8,705 18,608 26,394 26,993 Total 0 6,686 18,482 43,577 75,406 111,334 New headset shipment (000s) PlayStation VR 0.0 1,511.2 3,031.9 7,263.4 8,782.2 11,059.2 Xbox One (device not determined) 0.0 733.1 1,444.0 3,840.8 4,239.2 5,320.8 Oculus 0.0 1,332.5 1,724.0 4,088.9 11,021.2 18,948.0 HTC Vive 0.0 3,109.1 5,596.3 9,902.3 7,785.8 599.9 Total 0 5,953 10,352 21,255 27,589 30,607 VR user base as % of total PlayStation 4 0% 2% 4% 5% 7% 10% Xbox One 0% 0% 0% 0% 0% 0% Steam 0% 1% 2% 3% 6% 10% VR gaming users by platform (000s) PlayStation 4 0 756 2,272 3,936 6,551 10,549 Xbox One 0 0 0 0 0 0 Steam 0 740 2,332 4,897 10,283 17,996 Other PC platforms 0 230 265 1,683 2,854 Total 0 1,496 4,834 9,097 18,518 31,399 VR users by device(000s) PlayStation VR 0 756 2,272 3,936 6,551 10,549 Xbox One (device not determined) 0 0 0 0 0 0 Oculus 0 222 697 1,440 5,797 10,053 HTC Vive 0 518 1,865 3,722 6,170 10,797 Total 0 1,496 4,834 9,097 18,518 31,399 New headset shipment (000s) PlayStation VR 0.0 755.6 1,516.0 1,663.9 2,615.5 3,998.4 Xbox One (device not determined) 0.0 0.0 0.0 0.0 0.0 0.0 Oculus 0.0 222.1 474.5 743.7 4,356.5 4,256.0 HTC Vive 0.0 518.2 1,347.3 1,856.1 2,448.4 4,627.4 Total 0 1,496 3,338 4,264 9,420 12,882 BaseCaseAcceleratedDelayeduptakeAssumptions
  • 39.
    January 13, 2016Americas: Technology Goldman Sachs Global Investment Research 39 Accelerated uptake case: An accelerated uptake case scenario could happen if VR becomes a killer device for games and results in high penetration. In the base case scenario, we assumed a case where 30% of gamers (equivalent to the proportion of hardcore gamers on PS4 and Xbox One) would adopt VR headsets on the most integrated platform, PS4. Penetration on other platforms we assumed would be lower. For the accelerated uptake case, we assume that all hardcore gaming platforms (PS4, Xbox One, Steam, and other PC platforms) would seamlessly integrate VR headsets into the gaming experience and achieve 30% penetration. In the accelerated case, we assume a 2020E global VR installed base at 111mn, vs. 2015 global console gaming population of 378mn, and 706mn PC gaming population. Delayed uptake case: In this case, we assume only 10% of PS4 users and Steam/PC users adopt virtual reality. Xbox One will not have a VR headset in this case. This case may be realized if cyber-sickness and content availability remain as issues. The installed base will remain small in 2020 in this case, at 32mn. Gear VR hardware market Samsung announced a partnership with Oculus and introduced Gear VR in September 2014. The virtual reality headset uses the Samsung Galaxy smartphone for its processor and display, while using Oculus for the software. Unlike Oculus Rift and PlayStation VR, Samsung’s Gear VR headset does not need to be plugged into a computer, as it is powered by a smartphone. The Gear VR for Note 4 only works with the Galaxy Note 4 and the Gear VR for S6 only with Galaxy S6 and Galaxy S6 Edge, as both Gear VR models are made to fit only the exact size of each smartphones. Smartphones are inserted and snapped to the front of the Gear VR and act as its display as well as processor. Users are able to experience a 96 degree viewing angle with a 360-degree panoramic view with the device. Currently, both Gear VRs for Note 4 and S6 are sold at $99 down from an original price of $199. We note that both amazon.com and Best Buy sold out of Samsung’s new headsets 48 hours after consumer shipments began in November 2015, an indication of strong demand at the low price point. Samsung does not disclose the number of Gear VR sold or shipped as the market is still small and the percentage of the company’s total sales is negligible. Base case: We believe Samsung will strategically focus more on VR volume growth to gain share, driven by an aggressive pricing strategy. As such, we expect Samsung’s Gear VR shipments will increase from around 0.1mn in 2015 to around 12mn in 2020 in our base case. Accelerated uptake case: In the accelerated case, we assume the Gear VR attachment rate will increase to 5% by 2020 (vs. 3% for the base case), driven by either better demand from consumers or Samsung’s more aggressive pricing strategy. In this case, we expect Gear VR shipments will reach 20.3mn in 2020, 67% higher than our base case scenario. Delayed uptake case: In this case, we assume the Gear VR attachment rate will reach only 2% by 2020 (vs. 3% for the base case), driven mostly by weaker demand and lack of killer content for Gear VR. In this case, we expect Gear VR shipments will reach 8.1mn in 2020, roughly 33% lower than our base case scenario.
  • 40.
    January 13, 2016Americas: Technology Goldman Sachs Global Investment Research 40 Exhibit 36: Gear VR shipments to reach 12mn units by 2020 Gear VR shipment forecast from 2015-2020 (000) Source: Goldman Sachs Global Investment Research. High-end TV penetration We believe that virtual reality HMDs could serve as an incremental viewing experience for the high-end consumer segment of the TV market. Even when viewing regular content (non-virtual reality), HMDs could be used as a large virtual screen (i.e. >100” screen) to watch the traditional content. However we think the impact to the traditional TV or large display market could be limited as it is not a shared experience and could create discomfort for long periods of usage. Therefore, we think that HMDs should be viewed as incremental to TV and base our 3 scenarios on varying penetration. Base case: We estimate that HMDs could reach around an 8% penetration of the large screen TV market (>60”) by 2025 assuming that only high-end consumers that own a large TV would want to have a personalized virtual screen. Accelerated uptake case: For the accelerated case, we assumed VR could reach a 10% penetration of the 60” plus LCD TV market. We kept our penetration rate scenario more conservative than the 50% penetration of 4K, as HMDs do not replace functions of TV. Delayed uptake case: In this case, we assumed the penetration rate to be lower at 3%. TV use cases could be slow to adapt if film makers and TV program makers are reluctant to develop content. GearVR 2015E 2016E 2017E 2018E 2019E 2020E 12/2015 12/2016 12/2017 12/2018 12/2019 12/2020 Galaxy Smartphone Attachment Galaxy 6S shipment 39,500 0 0 0 0 0 Galaxy Note 4 shipment 12,500 0 0 0 0 0 Galaxy SP VR compatible models shipment 9,000 61,300 63,108 66,263 69,576 73,055 Galaxy SP VR compatible installed base 72,000 133,300 196,408 262,671 332,247 405,302 GearVR attachment % 0% 0% 1% 2% 2% 3% GearVR installed base 59 192 1,174 5,114 11,759 23,918 Gear VR shipment 58 133 982 3,940 6,645 12,159 Galaxy Smartphone Attachment Galaxy 6S shipment 39,500 0 0 0 0 0 Galaxy Note 4 shipment 12,500 0 0 0 0 0 Galaxy SP VR compatible models shipment 9,000 61,300 63,108 66,263 69,576 73,055 Galaxy SP VR compatible installed base 72,000 133,300 196,408 262,671 332,247 405,302 GearVR attachment % 0% 0% 1% 3% 4% 5% GearVR installed base 66 333 1,904 8,471 21,760 42,026 Gear VR shipment 65 267 1,571 6,567 13,290 20,265 Galaxy Smartphone Attachment Galaxy 6S shipment 39,500 0 0 0 0 0 Galaxy Note 4 shipment 12,500 0 0 0 0 0 Galaxy SP VR compatible models shipment 9,000 61,300 63,108 66,263 69,576 73,055 Galaxy SP VR compatible installed base 72,000 133,300 196,408 262,671 332,247 405,302 GearVR attachment % 0% 0% 0% 0% 1.0% 2.0% GearVR installed base 37 130 523 1,574 4,896 13,002 Gear VR shipment 36 93 393 1,051 3,322 8,106 BaseCaseAcceleratedDelayeduptake
  • 41.
    January 13, 2016Americas: Technology Goldman Sachs Global Investment Research 41 Exhibit 37: HMDs could see 8% penetration of the high-end TV or home projector market by 2020 HMD shipment forecast for the home entertainment market from 2015-2020 Source: Goldman Sachs Global Investment Research. 2. Long-term hardware forecast To understand the longer term adoption of virtual/augmented reality HMDs for the period from 2020-2025, we draw from the adoption patterns of major computing platforms (desktop, notebook and smartphone) in the past 20 years. We note that historically, the level of mobility has been a key factor in determining the long-term trajectory for these platforms. We look at the growth rates of the major computing devices from mass adoption to their maturity, as the growth rates in the early stages could be misleading due to a very small base. We defined entering into the mass adoption phase by surpassing 50mn units in annual shipments for desktops and notebooks, and 300mn units for smartphones. Maturity is defined at the peak of annual shipments. By capturing these timeframes from mass adoption to maturity, we found that desktop/notebook/smartphone have experienced a CAGR of 10%, 24% and 43% respectively. 1. Base case – Notebook scenario. To gauge the long term potential of the HMD hardware market by year 2025, we defined the notebook growth rate as our base case scenario, assuming HMDs will have a great VR user experience but limited by mobility (battery life and/or cellular connectivity). In this scenario, we apply the historical notebook mass adoption growth rate of 20%-25% to the HMD long term growth rate. We assume that HMDs gain wider popularity as VR/AR technology improves over time, but are limited by mobility and battery life. Hence, the use cases would be mostly confined to stationary mobility environments (i.e. Livingroom mobility). 2. Accelerated uptake case – Smartphone scenario. To gauge the long term potential of the HMD hardware market by 2025, we used smartphone growth rates as our accelerated uptake scenario, assuming HMDs will become highly mobile and as such enable a great VR user experience. In this scenario, we take the HMD base-case units assumption in 2020 and apply a 1.15 multiplier to form the starting year (2021) estimates. Then we apply the historical smartphone mass adoption growth rate of 40- 45% to the HMD long term growth rate. We assume that HMDs evolve to a generic computing platform by 2025, as the user experience of VR/AR technology improves TV Add-on 2015E 2016E 2017E 2018E 2019E 2020E 12/2015 12/2016 12/2017 12/2018 12/2019 12/2020 TV add-on (000s) Global LCD TV shipment 220,000 220,000 220,000 220,000 220,000 220,000 >60" segment 8,800 8,800 8,800 8,800 8,800 8,800 Home projector market 2,100 2,100 2,100 2,100 2,100 2,100 VR share in large screen 0% 3% 5% 6% 7% 8% VR installed base 0 327 872 1,526 2,289 3,161 VR headset shipment 0 327 545 654 763 872 TV add-on (000s) Global LCD TV shipment 220,000 220,000 220,000 220,000 220,000 220,000 >60" segment 8,800 8,800 8,800 8,800 8,800 8,800 Home projector market 2,100 2,100 2,100 2,100 2,100 2,100 VR share in large screen 0% 4% 5% 6% 9% 10% VR installed base 11 392 883 1,537 2,463 3,553 VR headset shipment 10 382 491 654 927 1,090 TV add-on (000s) Global LCD TV shipment 220,000 220,000 220,000 220,000 220,000 220,000 >60" segment 8,800 8,800 8,800 8,800 8,800 8,800 Home projector market 2,100 2,100 2,100 2,100 2,100 2,100 VR share in large screen 0% 0% 0% 1% 2% 3% VR installed base 0 8 51 160 378 705 VR headset shipment 0 8 44 109 218 327 BaseCaseAcceleratedDelayed
  • 42.
    January 13, 2016Americas: Technology Goldman Sachs Global Investment Research 42 over time coupled with breakthroughs in cellular and battery technologies to enable true mobility. In this scenario, we expect HMDs to proliferate from vertical markets to horizontal market adoption. 3. Delayed uptake case – PC scenario. We assume that the user experience of VR/AR technology improves at a slower pace due to hindrance in adoption from latency, display, safety, privacy and other issues that prevent it from having a widespread effect. As such we define the desktop growth rate as our delayed uptake scenario. In this scenario, we take the HMD base-case unit assumption in 2020 and applied a 0.8 multiplier to form the starting year (2021) estimates. Then we apply the historical desktop mass adoption growth rate of 7-10% to the HMD long term growth rate. As such, we estimate that VR/AR HMDs will only be used in specific end markets (i.e. games and other niche markets). The improvement in processor power, lower price points and shrinking footprint (i.e. Moore’s law) is the driver of hardware adoption. Since mobility has had an inherent influence on device growth rates in the past, we delve into greater detail on what factors contribute to true mobility and how these apply to VR/AR: 1) Display technology and computing power: We believe that cyber-sickness is the most critical problem to solve as this has been one of the biggest barriers to adoption in the past. Cyber-sickness occurs when there is a gap in user perceived positioning and his/her field of view. In general, higher resolution (reduces visible pixels) and quicker refresh rate (reduces latency) of the display combined with faster processing power (improves graphics rendering), would generate a better user experience and reduce cyber-sickness. Thanks to the evolution of smartphones, the panel resolution, refresh rates and computing power, all have improved significantly over the past decade to allow acceptable levels of user experience for virtual/augmented reality HMDs to become a viable consumer product. Moving forward, we believe display technology (resolution and refresh rate) and processing power will continue to improve over time, similar to the last decade. As such the user experience of virtual/augmented reality HMD should continue to improve. 2) Wireless connectivity: We have found that most of the HMDs launching in 2016 have a “wired” configuration, which means there is a wire (i.e. HDMI cable) for data transmission from the host system (i.e. PC) to the virtual reality HMD. We believe this is due to large amounts of data needed to be transmitted on a higher frequency for virtual reality graphics rendering, which the current WiFi / cellular data technologies are not able to carry seamlessly. This limits the usage to a sitting down experience similar to a desktop PC. Therefore we believe that for HMDs to take off, similarly like the movement from desktop PC to notebook PC/smartphone, wireless connectivity will need to be enabled. We believe with faster WiFi or cellular technologies to carry the heavily loaded data transmission required for virtual reality graphics would be an important enabler for mass adoption. On the other hand, new compression technology could also accelerate the wireless connectivity if it is able to reduce data transmission rates while maintaining the same quality. 3) All day battery life for true mobility: For virtual/augmented reality HMDs to reach their full potential, we believe that having true mobility, similar to smartphone, would be a requirement. To enable true mobility for HMDs, not only will it have to have wireless connectivity as mentioned previously, it will also need to have all-day battery life. Packing on large numbers of battery cells on a HMD would add more weight to the headset and as such creates the potential for user discomfort. Therefore we believe battery cell technology could be a critical bottleneck for true mobility. On the other hand, fast charging could be a medium-term solution.
  • 43.
    January 13, 2016Americas: Technology Goldman Sachs Global Investment Research 43 Building a framework for price reductions Price declines have been the key catalyst for hardware adoption. In this section, we develop a framework to estimate how HMD cost could decline over time as price elasticity should have impact to end demand. We draw upon the historical pattern of price declines from major end devices (desktops, TVs, tablets, notebooks and smartphones) as a proxy of how virtual/augmented reality HMDs could see prices decline over time. We believe it is sensible to use past pricing decline rates of existing hardware devices as long term HMD growth rates could resemble similar volume growth curves. We found that major hardware devices have experienced pricing declines in the range of 5-10% annually over the past 20 years. Exhibit 38: HMD price declines could resemble historical patterns from desktop, notebook or smartphone Historical price decline of major computing platforms Source: Goldman Sachs Global Investment Research. In addition, we also need a starting price point for the different types of HMDs. Given the limited commercially available HMDs in the market today, we constructed BoM (bill of material) estimates for major vendors (Sony, Oculus, HTC, Google Cardboard, Gear VR and HoloLens) that are launching in 2016. By applying the cost reduction rates to the estimated selling price, we project where the pricing could drop for three types of HMDs by 2025. Based on this framework, retail pricing of slide-on/discrete/integrated HMDs could be around USD$76, $221, and $581 with annualized shipments of 25mn, 44mn, and 56mn respectively by 2025.
  • 44.
    January 13, 2016Americas: Technology Goldman Sachs Global Investment Research 44 Exhibit 39: Retail pricing of slide-on/discrete/integrated HMDs could reach USD$76/$221/$581 by 2025 HMD price decline estimates Source: Goldman Sachs Global Investment Research. VR/AR HMD Hardware Categories We see four main devices that can be used to experience VR/AR: 1) a head-mounted display, 2) a host system, 3) a tracking system and 4) a controller or controllers.  Head-mounted-display (HMD) – A HMD is a hardware device that a user can place in front of their eyes that allows the user to see into an augmented or virtual environment. HMDs include Samsung’s Gear VR and Facebook’s Oculus Rift. Our VR/AR hardware TAM only forecasts the revenue generated by HMDs.  Host system – A host system refers to a device whose functionality is drawn upon by a HMD, such as smartphones, PCs or game consoles. The way that a host system is leveraged by a HMD depends on how sophisticated and autonomous the HMD is. Furthermore, VR/AR vendors are inclined to work with host system makers to ensure a rich VR/AR experience. This is forming new partnerships within the consumer electronics industry. For example, Oculus’ Ready PC Program is a partnership program initiated by Oculus to offer PC brand vendors certification of running Oculus Rift. Several high-spec PC models have been approved by Oculus, including ASUSTeK (2357.TW) and Alienware.  Tracking system – Tracking systems can be integrated within an HMD and/or external to an HMD. A tracking system helps create an active and immersive VR/AR experience by capturing a user’s movements and feeds that information back into the HMD. For example, if a user wearing an HMD looks up, the HMD’s screen also moves in that direction, allowing the user to see what is directly above them. Hardware used for a tracking system includes built-in sensors (commonly used in smartphones and tablet PCs), gyroscopes, and magnetometers. To enhance the accuracy of their tracking system, vendors may separate their sensors from the HMD and adopt internally-facing cameras or LED lights.  Controller(s) – Controllers are separate devices, such as the anticipated Oculus Touch (expected 2H16) or Samsung Gear VR Rink, which are handheld devices that allow users to track their motions or gestures intuitively. For example, a user can play a first person shooter game and aim their controller at the enemy. In the HMD, it will appear as if the weapon is directed at the enemy. Controllers may also have the ability to offer haptic experiences, which allow the user to feel vibrations or force. For example, if the enemy shoots back at the user’s right hand, the right hand controller would vibrate. 2015E 2016E 2017E 2018E 2019E 2020E 2021E 2022E 2023E 2024E 2025E 12/2015 12/2016 12/2017 12/2018 12/2019 12/2020 12/2021 12/2022 12/2023 12/2024 12/2025 Retail Price ($USD) Slide-On 100$ 100$ 97$ 94$ 91$ 89$ 86$ 83$ 81$ 78$ 76$ Discrete 350$ 350$ 333$ 316$ 300$ 285$ 271$ 257$ 244$ 232$ 221$ Integrated 1,500$ 1,500$ 1,350$ 1,215$ 1,094$ 984$ 886$ 797$ 717$ 646$ 581$
  • 45.
    January 13, 2016Americas: Technology Goldman Sachs Global Investment Research 45 HMD Hardware Components We note the following hardware components that are often used in HMDs:  Display: Most HMDs have one or two displays. We believe VR/AR HMDs will primarily use 4K UHD or higher display resolutions. We also believe OLEDs will be the prominent display technology for discrete VR devices, while a micro projection system will be the prominent display technology for integrated AR devices (we explain the difference between discrete and integrated in the following section). o Resolution – Although it is challenging for the human eye to distinguish details beyond 2K QHD on smartphones, 4K UHD and higher display resolutions will be able to substantially enhance VR/AR viewing experiences. Accordingly, we believe incremental demand for VR/AR will translate into higher demand for UHD display panels. o OLEDs – OLEDs have an advantage over LCDs, due to faster refresh rates, creating less latency and therefore less cyber-sickness. The PlayStation VR uses a 5.7” OLED display at a 1,920 x 1,080 resolution while Facebook’s Oculus Rift screen is reported to be 1,080 x 1,200 resolutions per eye (i.e. 2,160 x 1,200 in total) using OLED panels. o Micro Projection Systems – In integrated AR devices, we believe micro projection systems will be the most used technology, which has been adopted by Google Glass and we believe is likely to be adopted by Microsoft’s HoloLens. This opens up opportunities for micro-display module makers such as Himax, which manufactures LCoS micro-display modules for Google and Microsoft, reportedly.  Processors: One or more processing units are commonly found in integrated AR HMDs. We believe Microsoft HoloLens will have a high-end CPU (central processing unit), GPU (graphic processing unit) and a new chip called HPU (holographic processing unit) on the device. In order to support higher display resolutions, we believe GPU performance for VR/AR will be improved. Slide-on and discrete HMDs do not need their own processors, as they typically leverage a host system to run VR games or applications.  Sensors: Sensors can be place inside or external to a HMD. Eye and head tracking is critical for better VR/AR user experience as it could reduce the latency of the image refresh to match precisely with the viewer’s movement. The lower the latency, the more real the virtual environment feels to the viewer, and less cyber-sickness. The sensors used to measure movements include a: FOV (Field of View) depth sensor, front facing camera, gyroscope, accelerometer, magnetometer, proximity and ambient light sensor. Furthermore, for a discrete VR HMD, a position tracking system is also important. Currently, each VR hardware vendor develops its own technology. Sony uses its PlayStation camera as a position tracker, while Vive and Oculus have invented their own technology.  Cameras: Some VR/AR HMDs have front facing cameras for photo-taking, positional tracking, environmental mapping or allowing users to see through the headset when needed. Some AR HMDs adopt inner-facing cameras to sense the environment and surrounding objects.  Wireless connectivity: We believe there will be a wireless connection between the HMD and controller(s). However, wireless connectivity between the HMD and PC/game console still has many technological hurdles to overcome, in particular the high resolution and refresh rates required.
  • 46.
    January 13, 2016Americas: Technology Goldman Sachs Global Investment Research 46  Memory/battery: While there is limited information available about memory and battery requirements for HMDs, in the short term, we believe memory will be essential for both VR/AR HMDs, and battery will be essential for AR integrated HMDs. First, memory is needed to store/buffer VR/AR imagery/video during operation. Given VR/AR uses relatively higher resolution content, we believe HMDs will require high NAND density per device. In addition, we view improving GPU performance will lead to larger DRAM contents per device. Second, battery life is crucial for an integrated HMD as it does not leverage a host system for power. In addition, over the long run, as more discrete VR HMDs will adopt wireless connection, battery life will be important to take a VR HMD into a mobile environment.  Lenses: FOV (field of view) of a VR HMD is positively correlated to the immersive VR experience it can offer, as human FOV is up to 220 degrees horizontally. Aspheric Fresnel lenses are being widely adopted in Slide-on and discrete VR HMDs as they can have shorter focal length, implying higher magnifying rate and higher FOV, compared to other forms of convex lenses. VR discrete HMDs to be released in 1H16, including Oculus Rift, HTC Vive and PlayStation VR will adopt aspheric Fresnel lenses offering FOV of 100-110 degrees. We expect FOV to keep increasing in the long run. HMD Types, Vendors, BoM Costs and ASP Estimates Below, we identify and describe three types of HMDs in the market today (slide-on, discrete and integrated), based on their complexity of hardware and dependency on host machines. We then describe vendors for each, followed by BoM costs and ASPs. We summarize our BoM cost estimates by HMD below: Exhibit 40: VR/AR HMD BoM cost summary Source: Goldman Sachs Global Investment Research. $20 $87 $500 $400 $350 $1,500 $0 $200 $400 $600 $800 $1,000 $1,200 $1,400 $1,600 $1,800 Google Cardboard Samsung Gear VR Oculus Rift HTC Vive Sony PSVR Microsoft HoloLens Slide‐on Discrete Integrated
  • 47.
    January 13, 2016Americas: Technology Goldman Sachs Global Investment Research 47 Slide-on HMDs These are the most primitive and lowest priced HMDs. A smartphone can slide into the HMD unit, which turns an original 2D display into 3D virtual reality. Slide-on HMDs have the highest dependency on host systems (smartphones) as most components necessary to perform VR are not built-in. Vendors: Slide-on HMDs include Google Cardboard and Samsung Gear VR, which we discuss below:  Google Cardboard: Released in 2014, Google Cardboard was one of the pioneers of VR hardware. It offers consumers the cheapest HMD solution (as low as ~US$20) but inevitably, relatively low VR experience versus other HMD models. Google Cardboard has relatively simple architecture compared to other HMD devices. It uses cardboard as the structure of the HMD, which doesn’t have advanced sensors for head/motion tracking as other devices do. It is extremely cheap to build, but offers a relatively poor experience in our view when compared to higher-end devices. We believe this is an entry gateway product for users to experience virtual reality with very low cost of ownership.  Samsung Gear VR: Samsung Gear VR was developed by Samsung in collaboration with Oculus. Although its mechanism of offering VR experiences is similar to Google Cardboard, Gear VR offers a better user experience with in-built head-tracking sensors, enabling more accurate and lower-latency head tracking than purely relying on the motion sensors in the smartphone. While Gear VR shares a similar fundamental mechanism with Google Cardboard, adopting advanced 3D lenses, plastic casing and adding in several sensors offers a superior VR experience but also increases the cost. BoM Costs: We also estimate a BoM cost for a slide-on HMDs with similar specs to Gear VR to be $80-$90. ASPs: The most recent version of Samsung Gear VR (launched in 3Q15), is priced at $99. We use this as a benchmark, and believe other to-be-released slide-on models will be priced at around $100. Discrete HMDs Discrete HMDs are more sophisticated and contain more electronic components than slide- on HMDs. The key difference in hardware is that discrete HMDs have their own displays and may be equipped with processors, which offer simple computing capability. Although they cannot function independently without support from host systems (similar to slide-on HMDs), they open new opportunities in the VR market as the host system is no longer limited to smartphones. Superior computing power of PCs and game consoles brings in greater possibilities of developing a VR experience, such as gaming. Also, having basic built-in computing power enables a discrete HMD to support a complex sensory system and further fine tune visual/audio input from host machines. Together this offers superior VR experiences to users. Vendors: Discrete HMDs include Facebook Oculus Rift, HTC Vive and PlayStation VR, which we describe below:  Facebook Oculus Rift: This HMD is reported to be designed to adapt to Windows 10 PCs. We assume it will leverage the CPU of the host PC for primary processing. However, it is reported that Oculus Rift will have a built-in processor to compute head- tracking and positioning tracking. What’s special about Oculus Rift is its “Constellation Positioning Tracker”, which consists of at least 40 IR LEDs on the HMD and a standalone camera station. The mechanism of this tracking system is that the LEDs emit infrared intermittently and the camera station, which sits in a corner of the room,
  • 48.
    January 13, 2016Americas: Technology Goldman Sachs Global Investment Research 48 can sense detailed changes of IR light from the HMD. As the LEDs face different directions, not only can the user’s position in a room be measured but also the user’s orientation.  HTC Vive: This is a discrete HMD co-developed by HTC (2498.TW) and Valve. Similar to Oculus Rift, HTC Vive is reported to target PC users as well. As it mainly targets gamers, it adopts slightly superior displays to Oculus Rift. However, we do not assume HTC Vive to have a built-in chip and SSD storage as it has a different position tracking system from Oculus Rift, which lowers its BoM cost a bit. We also assume that HTC Vive’s lenses system is slightly cheaper than Oculus Rift as it might not adopt adjustable dial design. The “Lighthouse” tracking system, developed by Valve, has an opposite mechanism to the Constellation Tracking System. While the Constellation system emits light from the HMD to a standalone camera, the Lighthouse emits light from two standalone base stations to a number of light sensors on the HMD.  Sony PlayStation VR: Unlike Oculus Rift and HTC Vive, PlayStation VR’s host system will be a PlayStation 4 game console. PlayStation VR’s positioning tracker technology is based on a PS (PlayStation) camera and LED lights on the HMD. To improve the quality of input signal, Sony will separate the digital signal processing units into a PU (processor unit) box, which can fine tune the digital signal from the game console and send to the HMD and a TV. We assume PlayStation VR to have the lowest BoM cost among the three discrete HMD models. The main gap comes from the fact that it does not have an independent sophisticated positioning tracking system as it is likely to leverage a PS camera to do the job. Similarly, being bundled with PS4, PlayStation VR does not have to come with its own processing units, storage, battery and controllers. These together drive the cost down. BoM Costs: Oculus has said that it is selling Rift at its BoM cost and we expect Sony and HTC to follow suit. That said, we believe the BoM for all three of these offerings can decrease as the products gain scale. We estimate an average HMD discrete BoM of $350- 500, with Oculus at $500 (excluding our estimate for the cost of an Xbox controller and 2 games that come in the current package), HTC Vive at $400, and PSVR at $350. ASPs: As we expect vendors to sell discrete HMDs at no gross profit to drive product adoption, we assume ASPs in line with our BoM estimate at $350-500 which excludes accessories and games that come in the retail package. Integrated HMDs Integrated HMDs have high computing power and sophisticated tracking capabilities. Today, integrated HMDs are primarily AR HMDs. However, we believe that as the technology gradually improves, more VR HMD models will also become integrated HMDs. As an independent computing device, an integrated HMD will likely be equipped with a complete set of components that together are higher-priced than a consumer PC. VR/AR digital signals demand more computing power than traditional 2D graphics. And in the case of AR, taking actual surroundings into consideration also requires substantial computing hardware resources. Vendors: Integrated HMDs include Microsoft HoloLens, which we describe below.  Microsoft HoloLens: The 3 major components in a HoloLens are processors, displays (micro projection systems) and cameras. First, Microsoft is reported to have adopted Intel’s most powerful CPU, Atom Cherry Trail, which has a 2.7GHz clock rate and supports wireless charging. GPUs and HPUs substantially increase the total cost mainly because the chips are so unique that Microsoft is unlikely to gain economies of scale in the short run. Second, for displays, Microsoft uses two HD micro projectors
  • 49.
    January 13, 2016Americas: Technology Goldman Sachs Global Investment Research 49 (one for each side of the glass) to keep the lenses transparent. Google adopted liquid crystal on silicon (LCoS) display modules for Google Glass and Microsoft is reportedly using LCoS for HoloLens as well. Finally, HoloLens has at least 7 cameras to track the motion of the user and make sense of the surrounding environment. BoM Costs: An integrated HMD typically has superior specs to consumer PCs or smart devices, which significantly increases the cost. For example, Microsoft’s yet to-be-released HoloLens would adopt three processing units, which together cost approximately $375 in our estimates. All-in, we estimate a BoM of $1,500. ASPs: Taking HoloLens as a benchmark, we estimate integrated AR HMD models launched in 2016 would be priced at around $1,500.
  • 50.
    January 13, 2016Americas: Technology Goldman Sachs Global Investment Research 50 Virtual Reality and Augmented Reality Enablers Alphabet (GOOGL, $745.34, CL-Buy) Company profile As the online advertising pioneer, we estimate Alphabet 2015 revenues of $75bn (+13% yoy) with 90% as online advertising (referred to as Google) and 10% in non-core revenue. Alphabet is known for its innovation edge with management saying it spends 10% of its resources on non-core businesses. This non-core spend includes a number of initiatives including Google Fiber (wireless services), Google Nest (Internet of Things), and Life Sciences but the company has not specified the size or order of magnitude for these individual initiatives. Exposure to VR/AR An innovator in augmented reality. We view Alphabet as one of three vendors focused on augmented reality hardware along with Microsoft HoloLens and Magic Leap. Google launched its augmented reality product Google Glass in 2013 but discontinued sales in 2015. Press reports speculate (WSJ, Engadget) that Google will launch a new version of Glass, but the company has not confirmed. As discussed, we see strong business use cases for AR and as the technology advances Google has strong potential to benefit given its focus on the space. Positioning for VR advertising. We see Google’s VR efforts to be positioning itself for a virtual reality advertising market. Like Facebook has done on its app, Google has enabled 360-degree video on YouTube as another driver of adoption. Google has already distributed 2mn Google Cardboard viewers (low cost devices costing ~$20) in an effort to drive adoption of VR. In October 2015, Google distributed over 1mn Cardboard viewers for free to New York Times subscribers and has developed over 100 virtual field trips for the K- 12 education market. Cardboard is a low-end VR experience as latency is significantly higher than Oculus and we have yet to see signs of Google engaging in a higher-end VR hardware market but don’t rule out the possibility. Advanced Micro Devices (AMD, $2.39, Not Covered) Company profile AMD’s core business is computing and graphics processors, which it sells into the PC, server, embedded and gaming markets. FactSet consensus estimates 2015 revenues of $4.0bn (-28% yoy). Exposure to VR/AR AMD develops graphics processor technology that is required for VR gaming PCs, and Mercury Research estimates that AMD held 25%-30% unit share of the discrete GPU market in 1H15. The PC requirements for Oculus Rift specify that only high-end GPUs from AMD and Nvidia will work, which currently ship at ASPs of ~$350 and higher. AMD has stated that it has partnerships in place with several OEMs, headset manufacturers and software developers.
  • 51.
    January 13, 2016Americas: Technology Goldman Sachs Global Investment Research 51 Facebook (FB, $99.37, Buy) Company profile Facebook runs the leading social platform with 1.5bn monthly active users (MAU). We estimate 2015 revenues of $17bn (+39% yoy) of which 95% is advertising. Exposure to VR/AR Initially focused on gaming charge with bigger aspirations on the horizon. In March 2014, Facebook announced the acquisition of virtual reality technology vendor Oculus for $2bn with CEO Mark Zuckerberg saying the first initiative will be in immersive gaming but that the vision is for Oculus to be extended to other experiences as a communications platform. Oculus Rift is the company’s head-mounted display product with the first developer kit launched in 2012, the second developer kit launched in 2014, and pre-orders for the consumer version launched on 1/6/16 at a price of $599 and are expected to start shipping in March. Positioning for VR advertising. By developing an ecosystem of applications around Oculus, Facebook would be well-positioned to take advantage of virtual reality advertising. Much like the way TV, Internet, and mobile have changed the way companies connect with their customers, virtual reality would do the same and as an innovator in the space Facebook would be at the center of this transformation. We see Facebook trying to drive virtual reality adoption primarily through its Oculus efforts and also note that the company has enabled 360-degree video on its main app. Facebook has said it will sell Oculus Rift headsets at cost, which would make Oculus margin-dilutive to Facebook’s P&L. That said, given Facebook’s scale with our 2016 revenue estimate of $24bn and 2017 at $30bn, we estimate that Oculus would be just 100-200bps dilutive to Facebook’s gross margins which currently stand at 83%. If Facebook sold 400k Oculus headsets in FY16 for $599 at zero gross profit, we estimate that Oculus would be 100bps gross margin dilutive and if 1mn units were sold Oculus would be 200bps gross margin dilutive. We believe the incremental longer-term advertising opportunity would offset this margin dilution as virtual reality would equip Facebook with more user data driving better targeting across its platform and new immersive VR ads which would likely come at higher CPMs. GoPro (GPRO, $14.60, Neutral) Company Profile GoPro is the leading action camera vendor, with an estimated market share of over 50% of the digital camcorder market. It sells capture devices under the HERO brand as well as accompanying accessories. We estimate the company is on track to grow revenues 23% yoy in 2015, though this is down from 41% growth in 2014 and we forecast a high-teens percent decline in 4Q15. GoPro has stated that it plans to enter the drone market in 2016. GoPro also creates, curates, and enables content creation through the use of its capture devices, though direct monetization of the content remains fairly limited. GoPro has over 7.5mn Instagram followers and 3.6mn YouTube subscribers (and over 1bn views). Exposure to Virtual Reality As a leader in content creation and capture devices, we view GoPro as an enabler (and potential beneficiary) of VR. GoPro currently offers spherical video capture by harnessing 6 cameras in a single mount (four on the sides and one on the top and bottom). In April 2015, GoPro acquired Kolor, offering software to combine or stitch together multiple photos or videos. According to GoPro’s press release, ‘spherical media enables a range of immersive viewing experiences and is an essential building block of virtual reality. GoPro has also partnered with Google, offering a mount with 16 cameras (the Google Odyssey). Overall, GoPro currently sells the mount for professional applications, but expects to make a consumer-ready version over time, which could present a larger monetization opportunity.
  • 52.
    January 13, 2016Americas: Technology Goldman Sachs Global Investment Research 52 HTC Corporation (2498.TW, TWD70.70, Not Covered) Company profile HTC Corporation designs, manufactures, and sells smart devices, and provides after-sales services worldwide. Over 90% of HTC’s revenue comes from smartphones while the rest, 10%, is from tablet PCs and PDAs. HTC had approximately 1%-2% unit shipments globally in 2015 according to Gartner. The company also has expertise in system-level design of smart devices and in-house production capabilities. Exposure to VR/AR HTC developed VR system technology by co-developing VR HMD with Valve, one of the biggest PC game platform companies. HTC brings its research and development experiences from smartphone technology into the VR HMD design while Valve provides its software expertise from PC game development in creating virtual worlds. Valve’s online platform has over 100mn members globally and sold over 3,500 PC games. In the near term, HTC benefits by tapping into the videogame market by leveraging Steam’s established PC game channel, distribution and installed base. Largan Precision (3008.TW, NT$1,840.00, CL-Buy) Company profile Largan Precision Company Limited manufactures camera lens and optoelectronic components such as VCM (volatility control mechanism) and OIS (Optical Image Stabilization). The company has a leading position in lenses for consumer electronic devices such as smartphones, tablet PCs, and projectors (>90% of sales). It also has exposure in emerging lens applications such as car cameras and contact lenses. Largan’s major clients include Apple (73% of 2015E sales), as well as major Android phone and notebook PC brands. 2015E and 2016E pro forma sales totaled NT$59.1 billion (+29% YoY) and NT$74.7 billion (+26% YoY), respectively. Exposure to VR/AR Leading technology applicable to VR lens. Largan has maintained its sustainable leadership in miniaturized lens technology in the past. Capable of securing high yield rate and maintaining superior performance to competitors, Largan has become the primary source of supply of major consumer electronic brands, represented by its dominant market share in smartphone plastic camera lenses. We believe this trend will continue in VR/AR HMD lenses. Given the ability to produce a wide variety of lens products, Largan can meet a range of requirements from different HMD makers. In our research on VR hardware, plastic Fresnel convex lenses would be the mainstream VR HMD magnifying lenses. We believe Largan’s expertise in plastic lenses could enable it to outperform its competitors with superior performance by offering higher FOV (field of view) and reducing aberration and light scattering, which boost the overall VR experience of the clients’ HMD. VR lens to be a new addressable market for Largan. VR/AR will represent a large addressable market for lens makers when the market takes off. In our accelerated uptake case scenario, VR/AR HMD annual shipments would exceed 250mn units, implying at least 500mn units of magnifying lenses. Furthermore, cameras adopted on the HMDs as sensors will also make this market even bigger. As mentioned in the previous paragraph, we believe Largan’s leading technology would enable it to capture meaningful share of this market. Although Largan’s management has not commented on any specific VR/AR project as of yet, they did indicate that VR would be a new addressable market for them.
  • 53.
    January 13, 2016Americas: Technology Goldman Sachs Global Investment Research 53 Microsoft (MSFT, $52.78, Neutral) Company profile Microsoft is a leading enterprise software company with 1.2bn Office users worldwide. We estimate CY15 revenues of $91bn (-2% yoy). Exposure to VR/AR Potential in augmented reality. We see Microsoft having strong potential in the augmented reality market as we see AR use cases more focused on the enterprise where Microsoft has a widely-penetrated customer base. Microsoft is already partnering with companies such as Autodesk to develop an engineering AR application and medical schools (e.g., Case Western) for the healthcare use case. Further, Microsoft is a vendor that seems closest to releasing an AR product to market with the company announcing that a HoloLens developer’s kit will be launched in 2016 while Magic Leap and Google have yet to announce product releases (though press outlets like the WSJ speculate that a new Google Glass product is currently in development). Nvidia (NVDA, $30.18, Sell) Company profile Nvidia’s core business is graphics processors, which it sells into the gaming, data center and automotive end markets. We estimate 2015 revenues of $4.9 bn (+5% yoy), of which 50%-60% is gaming. Exposure to VR/AR Adoption of VR could catalyze GPU upgrade cycle, positive mix shift. We believe Nvidia’s best-in-class graphics processor technology positions it well to benefit from the adoption of VR technology longer term, although it is unclear to us to what extent VR will drive total revenue growth over the medium term. Nvidia has partnerships in place with approx. 250 companies to work on VR applications with its DesignWorks and GameWorks platforms, including vendors such as Oculus and HTC. Most VR applications require high- end GPUs (which currently ship at ~$350 and higher), which could catalyze a GPU refresh cycle and/or mix shift toward products with higher ASPs and margins. Nvidia would also stand to benefit if VR sees adoption amongst a broader set of customers in its enterprise/professional markets. Qualcomm (QCOM, $46.52, Buy) Company Profile Qualcomm is the leading smartphone cellular chipset and application processor provider, with an estimated market share of about 60%s of CDMA/WCDMA/LTE devices. Its customers include essentially all major handset and tablet companies, and many of the emerging handset vendors as well. Qualcomm has led the LTE cellular baseband market and also has a leading presence in the Wi-Fi market as a result of its 2011 acquisition of Atheros. Beyond handsets and tablets, Qualcomm’s end markets include Wi-Fi access points, automobiles, small cells, and healthcare, to name a few. Over two-thirds of company revenues come from the sale of chipsets. Qualcomm’s licensing business accounts for the remaining one-third of revenues; however, this segment accounts for over two-thirds of operating profit given its high margins. Owning most of the IP behind CDMA/WCDMA and much of LTE, Qualcomm gets a royalty from every device that uses its technology.
  • 54.
    January 13, 2016Americas: Technology Goldman Sachs Global Investment Research 54 Exposure to Virtual Reality Qualcomm stands to benefit from the proliferation of connected devices, whether it be via cellular, WiFi, Bluetooth, etc. Its application processor (AP) technology supports GPU and CPU functionality. In October 2015, the company launched a reference design platform designed specifically for advanced cameras (the Snapdragon 618 IP). This camera platform supports video analytics, object and facial detection, multi object tracking, 4K HEVC video, dual image signal processors (ISPs), battery efficiency, and multiple forms of connectivity (LTE Cat 7, WiFi, GPS, Bluetooth). Qualcomm similarly has introduced a chipset targeting consumer drones. While Qualcomm’s revenue exposure is dominated by smartphones and tablets, virtual reality and image capture devices could become an adjacent market opportunity. In late 2015, Qualcomm sold its Vuforia business, a developer ecosystem for virtual reality applications, to PTC. Thus, we would not expect Qualcomm to participate in software/applications of VR, but remain focused on chipset processors and connectivity. Samsung Electronics (005930.KS, W1,146,000.00, Neutral) Company profile Samsung Electronics (SEC) is the world’s largest mobile phone and TV manufacturer. The company is a producer of both hardware and components, and has four main operating segments, including: IT & Mobile (46% of FY15E sales); Consumer Electronics (21% of sales); Semiconductor (21% of sales), and Display Panel (12% of sales). Total company sales in FY15E is expected to total W200tn (down 3% yoy), with an operating margin of 13%. We expect SEC to ship 395mn mobile phones (down 2% yoy) and 48mn TVs (down 10% yoy) in FY15E. We have a Neutral rating on the stock as we expect the structural improvement it exhibited during the smartphone product cycle of 2010-13 to be limited in the next couple of years. Exposure to VR Gear VR, a device compatible with high-end Galaxy phones: SEC announced a partnership with Oculus and introduced the first Gear VR Innovator Edition in September 2014. The virtual reality headset uses the Samsung Galaxy smartphone for its processor and display, while using Oculus for the software. Unlike Oculus Rift and PlayStation VR, Samsung’s Gear VR headset does not need to be plugged into a computer, as it is powered by a smartphone. Gear VR Innovator Edition for Note 4 only works with Galaxy Note 4 and Gear VR Innovator Edition for S6 only with Galaxy S6 and Galaxy S6 edge, while the consumer edition released in November 2015 works with four different Galaxy models (Galaxy S6, Galaxy S6 edge, Galaxy S6 edge+, and Galaxy Note5). Each Gear VR models are made to fit only the compatible smartphones, as the phones are inserted and snapped to the front of the Gear VR and act as its display as well as processor. Users are able to experience a 96 degree viewing angle with a 360-degree panoramic view with the device.   Gear VR to enhance product loyalty. The innovator editions of the Gear VR used to be sold at $199.99, while the price of the recently launched consumer edition was lowered to $99.99. We believe this is not a hefty price in itself, but for a non-Samsung phone user, the burden will likely be on the high price needed to pay for a compatible Samsung high-end smartphone. In this regard, while Gear VR has the potential to become a device that attracts new customers to Samsung smartphones with the increasing number of contents offered and entertainment value it adds, at the current stage we believe Gear VR is more of a product that enhances product loyalty for current Samsung smartphone users. We expect that sales contribution from Gear VR will be limited for the next couple of years, but it could still become a product that prevents switching out of SEC’s high-end smartphone.
  • 55.
    January 13, 2016Americas: Technology Goldman Sachs Global Investment Research 55 Sony (6758.T, ¥2,675.00, CL-Buy) Company profile Sony is a large entertainment and consumer electronics conglomerate, comprised of a games business which owns and operates the PlayStation platform and internal game studios (22% of operating profits in 2015, 26% by 2020), and pictures and music businesses where Sony is one of the largest Hollywood film studios, TV program distributors, and one of the top 3 music record companies/publishers in the world (23% of operating profits in 2015, 30% by 2020). In the electronics businesses, Sony has the challenged smartphone business, improving yet risky home entertainment, and stable camera businesses. Three consumer electronics businesses in aggregate are breakeven in 2015, and we expect 7% of group operating profits to be generated from trimmed down electronics business. Sony’s device business includes the CMOS image sensors, we expect profit contribution of 21% in 2015, 18% in 2020. Our bullish stance on Sony is based on the increasing weight of the entertainment business and valuation rerating of Sony from tech conglomerate to a collection of top tier entertainment assets. Exposure to VR Decades of research to a promising PSVR launch. As a leading provider of audio visual products, Sony has long been providing VR products, starting with Glasstron in 1990s, which worked with PCs and re-created 50+ inch screen in front of user’s eyes. In 1H2016, Sony plans to release the PlayStation VR, the first high-end virtual reality headset to work with a contemporary gaming console. We are confident in the PlayStation VR launch for 3 reasons. 1) Large installed base of the host machine: PlayStation 4 has been the fastest penetrating console of any of PlayStation series to date, and we estimate the current installed base is over 40mn. Activity and engagement is high, with 30% of users being hardcore, and 90%+ being active gamers; 2) Availability of internal as well as third party content: Sony intends to launch Gran Turismo Sports, the latest of Sony’s flagship racing games on PSVR. Also, multiple third parties developers have expressed interest and have begun early work on launching major titles on virtual reality; 3) Good developer environment: we believe proliferation of third party game engines, i.e. Unity and Unreal, and their compatibility with both PSVR and competitor devices like Oculus will significantly lower the entry barrier for third party developers. We believe PlayStation VR will spread gradually as a device for hardcore gamers to dive into immersive gaming environment. We expect the 2020 PSVR installed base to be 31mn, on 105mn PlayStation 4 installed base. We assume PSVR shipments start gradually with 1.5mn units in 2016 (Sony revenue of ¥60bn in 2016), gradually exceeding 10mn by 2020. We do not assume PSVR hardware sales will be a profit driver for Sony. Rather, they will be positioned as differentiator against Xbox and Steam platforms, and also help to extend the console cycle further.
  • 56.
    January 13, 2016Americas: Technology Goldman Sachs Global Investment Research 56 Disclosure Appendix Reg AC We, Heather Bellini, CFA, Wei Chen, Masaru Sugiyama, Marcus Shin, Shateel Alam and Daiki Takayama, hereby certify that all of the views expressed in this report accurately reflect our personal views about the subject company or companies and its or their securities. We also certify that no part of our compensation was, is or will be, directly or indirectly, related to the specific recommendations or views expressed in this report. Unless otherwise stated, the individuals listed on the cover page of this report are analysts in Goldman Sachs' Global Investment Research division. Investment Profile The Goldman Sachs Investment Profile provides investment context for a security by comparing key attributes of that security to its peer group and market. The four key attributes depicted are: growth, returns, multiple and volatility. Growth, returns and multiple are indexed based on composites of several methodologies to determine the stocks percentile ranking within the region's coverage universe. The precise calculation of each metric may vary depending on the fiscal year, industry and region but the standard approach is as follows: Growth is a composite of next year's estimate over current year's estimate, e.g. EPS, EBITDA, Revenue. Return is a year one prospective aggregate of various return on capital measures, e.g. CROCI, ROACE, and ROE. Multiple is a composite of one-year forward valuation ratios, e.g. P/E, dividend yield, EV/FCF, EV/EBITDA, EV/DACF, Price/Book. Volatility is measured as trailing twelve-month volatility adjusted for dividends. Quantum Quantum is Goldman Sachs' proprietary database providing access to detailed financial statement histories, forecasts and ratios. It can be used for in-depth analysis of a single company, or to make comparisons between companies in different sectors and markets. GS SUSTAIN GS SUSTAIN is a global investment strategy aimed at long-term, long-only performance with a low turnover of ideas. The GS SUSTAIN focus list includes leaders our analysis shows to be well positioned to deliver long term outperformance through sustained competitive advantage and superior returns on capital relative to their global industry peers. Leaders are identified based on quantifiable analysis of three aspects of corporate performance: cash return on cash invested, industry positioning and management quality (the effectiveness of companies' management of the environmental, social and governance issues facing their industry). Disclosures Coverage group(s) of stocks by primary analyst(s) Heather Bellini, CFA: America-Software. Wei Chen: Asia Pacific Technology. Masaru Sugiyama: Japan Internet and Games, Japan-Consumer Electronics. Marcus Shin: Korea Technology. Daiki Takayama: Japan-Electronic Components. America-Software: Adobe Systems Inc., Akamai Technologies Inc., Alarm.com Holdings, Alphabet Inc., Atlassian Corp., Autodesk Inc., Citrix Systems Inc., Facebook Inc., Microsoft Corp., Mimecast Ltd., MobileIron Inc., Oracle Corp., Rackspace Hosting Inc., Red Hat Inc., RingCentral, Salesforce.com Inc., VMware Inc., Workday Inc.. Asia Pacific Technology: AAC Technologies, Acer, Advanced Semiconductor Engineering, ASUSTeK Computer, Casetek Holdings, Catcher Technology, Compal Electronics, Hon Hai Precision, Largan Precision, Lenovo Group, Pegatron, Quanta Computer, Siliconware Precision Industries, TPK Holding, Wistron. Japan Internet and Games: Bandai Namco Holdings, Capcom, CyberAgent, DeNA Co., Gree, Kakaku.com, Konami, mixi, Nexon, Nintendo, Rakuten, Sega Sammy Holdings, Square Enix Holdings, Yahoo Japan. Japan-Consumer Electronics: Panasonic Corporation, Sony. Japan-Electronic Components: Alps Electric, Hirose Electric, Ibiden, IRISO Electronics, Japan Aviation Electronics Industry, Japan Display Inc., Kyocera, Mabuchi Motor, Minebea, Mitsumi Electric, Murata Mfg., NGK Insulators, NGK Spark Plug, Nichicon, Nidec, Nippon Ceramic, Nippon Chemi-Con, Nitto Denko, Pacific Industrial, Shinko Electric Industries, Taiyo Yuden, TDK. Korea Technology: Samsung Electro-Mechanics, Samsung Electronics, Samsung SDI Co., Samsung SDS Co., Seoul Semiconductor, SK Hynix Inc.. Company-specific regulatory disclosures Compendium report: please see disclosures at http://www.gs.com/research/hedge.html. Disclosures applicable to the companies included in this compendium can be found in the latest relevant published research Distribution of ratings/investment banking relationships Goldman Sachs Investment Research global coverage universe Rating Distribution Investment Banking Relationships Buy Hold Sell Buy Hold Sell Global 31% 53% 16% 63% 58% 52% As of January 1, 2016, Goldman Sachs Global Investment Research had investment ratings on 3,254 equity securities. Goldman Sachs assigns stocks as Buys and Sells on various regional Investment Lists; stocks not so assigned are deemed Neutral. Such assignments equate to Buy, Hold and Sell for the purposes of the above disclosure required by NASD/NYSE rules. See 'Ratings, Coverage groups and views and related definitions' below. Price target and rating history chart(s) Compendium report: please see disclosures at http://www.gs.com/research/hedge.html. Disclosures applicable to the companies included in this compendium can be found in the latest relevant published research
  • 57.
    January 13, 2016Americas: Technology Goldman Sachs Global Investment Research 57 Regulatory disclosures Disclosures required by United States laws and regulations See company-specific regulatory disclosures above for any of the following disclosures required as to companies referred to in this report: manager or co-manager in a pending transaction; 1% or other ownership; compensation for certain services; types of client relationships; managed/co- managed public offerings in prior periods; directorships; for equity securities, market making and/or specialist role. Goldman Sachs usually makes a market in fixed income securities of issuers discussed in this report and usually deals as a principal in these securities. The following are additional required disclosures: Ownership and material conflicts of interest: Goldman Sachs policy prohibits its analysts, professionals reporting to analysts and members of their households from owning securities of any company in the analyst's area of coverage. Analyst compensation: Analysts are paid in part based on the profitability of Goldman Sachs, which includes investment banking revenues. Analyst as officer or director: Goldman Sachs policy prohibits its analysts, persons reporting to analysts or members of their households from serving as an officer, director, advisory board member or employee of any company in the analyst's area of coverage. Non-U.S. Analysts: Non-U.S. analysts may not be associated persons of Goldman, Sachs & Co. and therefore may not be subject to NASD Rule 2711/NYSE Rules 472 restrictions on communications with subject company, public appearances and trading securities held by the analysts. Distribution of ratings: See the distribution of ratings disclosure above. Price chart: See the price chart, with changes of ratings and price targets in prior periods, above, or, if electronic format or if with respect to multiple companies which are the subject of this report, on the Goldman Sachs website at http://www.gs.com/research/hedge.html. Additional disclosures required under the laws and regulations of jurisdictions other than the United States The following disclosures are those required by the jurisdiction indicated, except to the extent already made above pursuant to United States laws and regulations. Australia: Goldman Sachs Australia Pty Ltd and its affiliates are not authorised deposit-taking institutions (as that term is defined in the Banking Act 1959 (Cth)) in Australia and do not provide banking services, nor carry on a banking business, in Australia. This research, and any access to it, is intended only for "wholesale clients" within the meaning of the Australian Corporations Act, unless otherwise agreed by Goldman Sachs. In producing research reports, members of the Global Investment Research Division of Goldman Sachs Australia may attend site visits and other meetings hosted by the issuers the subject of its research reports. In some instances the costs of such site visits or meetings may be met in part or in whole by the issuers concerned if Goldman Sachs Australia considers it is appropriate and reasonable in the specific circumstances relating to the site visit or meeting. Brazil: Disclosure information in relation to CVM Instruction 483 is available at http://www.gs.com/worldwide/brazil/area/gir/index.html. Where applicable, the Brazil-registered analyst primarily responsible for the content of this research report, as defined in Article 16 of CVM Instruction 483, is the first author named at the beginning of this report, unless indicated otherwise at the end of the text. Canada: Goldman Sachs Canada Inc. is an affiliate of The Goldman Sachs Group Inc. and therefore is included in the company specific disclosures relating to Goldman Sachs (as defined above). Goldman Sachs Canada Inc. has approved of, and agreed to take responsibility for, this research report in Canada if and to the extent that Goldman Sachs Canada Inc. disseminates this research report to its clients. Hong Kong: Further information on the securities of covered companies referred to in this research may be obtained on request from Goldman Sachs (Asia) L.L.C. India: Further information on the subject company or companies referred to in this research may be obtained from Goldman Sachs (India) Securities Private Limited. Goldman Sachs may beneficially own 1% or more of the securities (as such term is defined in clause 2 (h) the Indian Securities Contracts (Regulation) Act, 1956) of the subject company or companies referred to in this research report. Japan: See below. Korea: Further information on the subject company or companies referred to in this research may be obtained from Goldman Sachs (Asia) L.L.C., Seoul Branch. New Zealand: Goldman Sachs New Zealand Limited and its affiliates are neither "registered banks" nor "deposit takers" (as defined in the Reserve Bank of New Zealand Act 1989) in New Zealand. This research, and any access to it, is intended for "wholesale clients" (as defined in the Financial Advisers Act 2008) unless otherwise agreed by Goldman Sachs. Russia: Research reports distributed in the Russian Federation are not advertising as defined in the Russian legislation, but are information and analysis not having product promotion as their main purpose and do not provide appraisal within the meaning of the Russian legislation on appraisal activity. Singapore: Further information on the covered companies referred to in this research may be obtained from Goldman Sachs (Singapore) Pte. (Company Number: 198602165W). Taiwan: This material is for reference only and must not be reprinted without permission. Investors should carefully consider their own investment risk. Investment results are the responsibility of the individual investor. United Kingdom: Persons who would be categorized as retail clients in the United Kingdom, as such term is defined in the rules of the Financial Conduct Authority, should read this research in conjunction with prior Goldman Sachs research on the covered companies referred to herein and should refer to the risk warnings that have been sent to them by Goldman Sachs International. A copy of these risks warnings, and a glossary of certain financial terms used in this report, are available from Goldman Sachs International on request. European Union: Disclosure information in relation to Article 4 (1) (d) and Article 6 (2) of the European Commission Directive 2003/126/EC is available at http://www.gs.com/disclosures/europeanpolicy.html which states the European Policy for Managing Conflicts of Interest in Connection with Investment Research. Japan: Goldman Sachs Japan Co., Ltd. is a Financial Instrument Dealer registered with the Kanto Financial Bureau under registration number Kinsho 69, and a member of Japan Securities Dealers Association, Financial Futures Association of Japan and Type II Financial Instruments Firms Association. Sales and purchase of equities are subject to commission pre-determined with clients plus consumption tax. See company-specific disclosures as to any applicable disclosures required by Japanese stock exchanges, the Japanese Securities Dealers Association or the Japanese Securities Finance Company. Ratings, coverage groups and views and related definitions Buy (B), Neutral (N), Sell (S) -Analysts recommend stocks as Buys or Sells for inclusion on various regional Investment Lists. Being assigned a Buy or Sell on an Investment List is determined by a stock's return potential relative to its coverage group as described below. Any stock not assigned as a Buy or a Sell on an Investment List is deemed Neutral. Each regional Investment Review Committee manages various regional Investment Lists to a global guideline of 25%-35% of stocks as Buy and 10%-15% of stocks as Sell; however, the distribution of Buys and Sells in any particular coverage group may vary as determined by the regional Investment Review Committee. Regional Conviction Buy and Sell lists represent investment recommendations focused on either the size of the potential return or the likelihood of the realization of the return. Return potential represents the price differential between the current share price and the price target expected during the time horizon associated with the price target. Price targets are required for all covered stocks. The return potential, price target and associated time horizon are stated in each report adding or reiterating an Investment List membership. Coverage groups and views: A list of all stocks in each coverage group is available by primary analyst, stock and coverage group at http://www.gs.com/research/hedge.html. The analyst assigns one of the following coverage views which represents the analyst's investment outlook on the coverage group relative to the group's historical fundamentals and/or valuation. Attractive (A). The investment outlook over the following 12 months is favorable relative to the coverage group's historical fundamentals and/or valuation. Neutral (N). The investment outlook over the
  • 58.
    January 13, 2016Americas: Technology Goldman Sachs Global Investment Research 58 following 12 months is neutral relative to the coverage group's historical fundamentals and/or valuation. Cautious (C). The investment outlook over the following 12 months is unfavorable relative to the coverage group's historical fundamentals and/or valuation. Not Rated (NR). The investment rating and target price have been removed pursuant to Goldman Sachs policy when Goldman Sachs is acting in an advisory capacity in a merger or strategic transaction involving this company and in certain other circumstances. Rating Suspended (RS). Goldman Sachs Research has suspended the investment rating and price target for this stock, because there is not a sufficient fundamental basis for determining, or there are legal, regulatory or policy constraints around publishing, an investment rating or target. The previous investment rating and price target, if any, are no longer in effect for this stock and should not be relied upon. Coverage Suspended (CS). Goldman Sachs has suspended coverage of this company. Not Covered (NC). Goldman Sachs does not cover this company. Not Available or Not Applicable (NA). The information is not available for display or is not applicable. Not Meaningful (NM). The information is not meaningful and is therefore excluded. Global product; distributing entities The Global Investment Research Division of Goldman Sachs produces and distributes research products for clients of Goldman Sachs on a global basis. Analysts based in Goldman Sachs offices around the world produce equity research on industries and companies, and research on macroeconomics, currencies, commodities and portfolio strategy. This research is disseminated in Australia by Goldman Sachs Australia Pty Ltd (ABN 21 006 797 897); in Brazil by Goldman Sachs do Brasil Corretora de Títulos e Valores Mobiliários S.A.; in Canada by either Goldman Sachs Canada Inc. or Goldman, Sachs & Co.; in Hong Kong by Goldman Sachs (Asia) L.L.C.; in India by Goldman Sachs (India) Securities Private Ltd.; in Japan by Goldman Sachs Japan Co., Ltd.; in the Republic of Korea by Goldman Sachs (Asia) L.L.C., Seoul Branch; in New Zealand by Goldman Sachs New Zealand Limited; in Russia by OOO Goldman Sachs; in Singapore by Goldman Sachs (Singapore) Pte. (Company Number: 198602165W); and in the United States of America by Goldman, Sachs & Co. Goldman Sachs International has approved this research in connection with its distribution in the United Kingdom and European Union. European Union: Goldman Sachs International authorised by the Prudential Regulation Authority and regulated by the Financial Conduct Authority and the Prudential Regulation Authority, has approved this research in connection with its distribution in the European Union and United Kingdom; Goldman Sachs AG and Goldman Sachs International Zweigniederlassung Frankfurt, regulated by the Bundesanstalt für Finanzdienstleistungsaufsicht, may also distribute research in Germany. General disclosures This research is for our clients only. Other than disclosures relating to Goldman Sachs, this research is based on current public information that we consider reliable, but we do not represent it is accurate or complete, and it should not be relied on as such. We seek to update our research as appropriate, but various regulations may prevent us from doing so. Other than certain industry reports published on a periodic basis, the large majority of reports are published at irregular intervals as appropriate in the analyst's judgment. Goldman Sachs conducts a global full-service, integrated investment banking, investment management, and brokerage business. We have investment banking and other business relationships with a substantial percentage of the companies covered by our Global Investment Research Division. Goldman, Sachs & Co., the United States broker dealer, is a member of SIPC (http://www.sipc.org). Our salespeople, traders, and other professionals may provide oral or written market commentary or trading strategies to our clients and principal trading desks that reflect opinions that are contrary to the opinions expressed in this research. Our asset management area, principal trading desks and investing businesses may make investment decisions that are inconsistent with the recommendations or views expressed in this research. The analysts named in this report may have from time to time discussed with our clients, including Goldman Sachs salespersons and traders, or may discuss in this report, trading strategies that reference catalysts or events that may have a near-term impact on the market price of the equity securities discussed in this report, which impact may be directionally counter to the analyst's published price target expectations for such stocks. Any such trading strategies are distinct from and do not affect the analyst's fundamental equity rating for such stocks, which rating reflects a stock's return potential relative to its coverage group as described herein. We and our affiliates, officers, directors, and employees, excluding equity and credit analysts, will from time to time have long or short positions in, act as principal in, and buy or sell, the securities or derivatives, if any, referred to in this research. The views attributed to third party presenters at Goldman Sachs arranged conferences, including individuals from other parts of Goldman Sachs, do not necessarily reflect those of Global Investment Research and are not an official view of Goldman Sachs. Any third party referenced herein, including any salespeople, traders and other professionals or members of their household, may have positions in the products mentioned that are inconsistent with the views expressed by analysts named in this report. This research is not an offer to sell or the solicitation of an offer to buy any security in any jurisdiction where such an offer or solicitation would be illegal. It does not constitute a personal recommendation or take into account the particular investment objectives, financial situations, or needs of individual clients. Clients should consider whether any advice or recommendation in this research is suitable for their particular circumstances and, if appropriate, seek professional advice, including tax advice. The price and value of investments referred to in this research and the income from them may fluctuate. Past performance is not a guide to future performance, future returns are not guaranteed, and a loss of original capital may occur. Fluctuations in exchange rates could have adverse effects on the value or price of, or income derived from, certain investments. Certain transactions, including those involving futures, options, and other derivatives, give rise to substantial risk and are not suitable for all investors. Investors should review current options disclosure documents which are available from Goldman Sachs sales representatives or at http://www.theocc.com/about/publications/character-risks.jsp. Transaction costs may be significant in option strategies calling for multiple purchase and sales of options such as spreads. Supporting documentation will be supplied upon request. All research reports are disseminated and available to all clients simultaneously through electronic publication to our internal client websites. Not all research content is redistributed to our clients or available to third-party aggregators, nor is Goldman Sachs responsible for the redistribution of our research by third party aggregators. For research, models or other data available on a particular security, please contact your sales representative or go to http://360.gs.com. Disclosure information is also available at http://www.gs.com/research/hedge.html or from Research Compliance, 200 West Street, New York, NY 10282. © 2016 Goldman Sachs. No part of this material may be (i) copied, photocopied or duplicated in any form by any means or (ii) redistributed without the prior written consent of The Goldman Sachs Group, Inc.