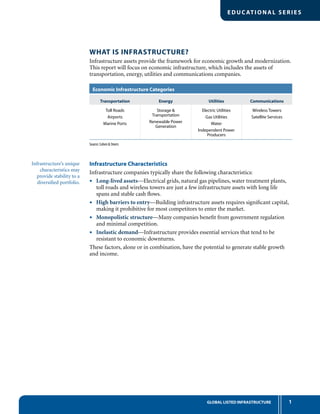
This document discusses the growing need for global infrastructure investment totaling over $40 trillion by 2030. Rapid economic growth and urbanization in developing nations is straining existing infrastructure networks and necessitating massive upgrades. Developed nations also need to upgrade deteriorating infrastructure assets. The document outlines the attractive characteristics of listed infrastructure securities as an investment class to help meet this growing need, including stable cash flows, high barriers to entry, and low correlation to other asset classes.

![EDUC ATIONAL SERIES
3GLOBAL LISTED INFRASTRUCTURE
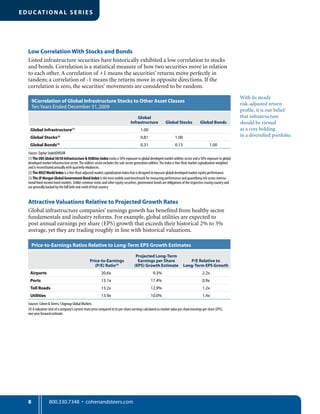
The $40 Trillion Infrastructure Challenge: 2005–2030
Projected Infrastructure Spending (in trillions)
Sources: Booz Allen Hamilton, Global Infrastructure Partners,World Energy Outlook, Organisation for Economic Co-operation and Development (OECD), Boeing,
Drewry Shipping Consultants, U.S. Department ofTransportation
Water $0.23
Power $0.18
Road Rail $0.31
Air/Seaport $0.14
MIDDLE
EAST
Total: $0.86
Water $0.23
Power $0.54
Road Rail $0.31
Air/Seaport $0.02
AFRICA
Total: $1.10
Water $3.62
Power $1.53
Road Rail $0.94
Air/Seaport $0.43
NORTH
AMERICA
Total: $6.52
Water $4.97
Power $1.44
Road Rail $1.01
Air/Seaport $0.06
LATIN/
SOUTH
AMERICA
Total: $7.48
Water $4.52
Power $1.08
Road Rail $3.12
Air/Seaport $0.43
EUROPE
Total: $9.15 Water $9.04
Power $4.23
Road Rail $2.11
Air/Seaport $0.51
ASIA/
OCEANIA
Total: $15.89
Water 55%
Power 22%
Road Rail 19%
Air/Seaport 4%
Percentage of
Infrastructure
Spending by Sector,
Through 2030:
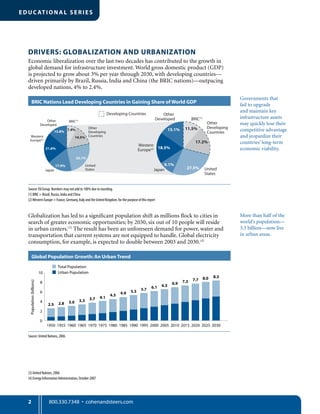
In most developing nations, the lion’s share of infrastructure spending will target new
construction as governments strive to expand inadequate networks. In developed
countries, the immediate need is to upgrade and maintain existing infrastructure.(1)
Global demand
for infrastructure
demand is diversified
by geography and
by industry.
Global Leaders Weigh in on Infrastructure
Presidents and prime ministers around the world have made infrastructure
creation and upkeep a priority.
Brazil—“As a government priority we have taken on the construction of major
infrastructure projects in our region. More than just a large group of paths of
integration, it will be a channel for development, bringing economic progress to
areas that have been left out of the benefits of modern society.”
–President Luiz Inácio Lula da Silva, 2004
Canada—“In collaboration with the private sector and other levels of government,
our government is embarking on the largest infrastructure development program
in half a century (C$33 billion). Not since the great national transportation mega
projects of the post-war era has the federal government launched such a massive
undertaking.”
–Prime Minister Stephen Harper, 2007
Australia—“Many urban water pipe systems have been laid down a century ago,
leak like hell, resulting in certain cities [having] up to 30% loss in leakage. That’s
why we’ve established a quarter of a billion dollar fund to partner with local
authorities and state governments, where appropriate, to deal with that.”
–Prime Minister Kevin Rudd, 2008
(1)“Policy Brief: Infrastructure to 2030,”Organisation for Economic Co-operation and Development (OECD), January 2008](https://image.slidesharecdn.com/3fd6f80a-4685-464a-9e34-7193e340177a-151126004225-lva1-app6892/85/GlobInfrastructure-5-320.jpg)