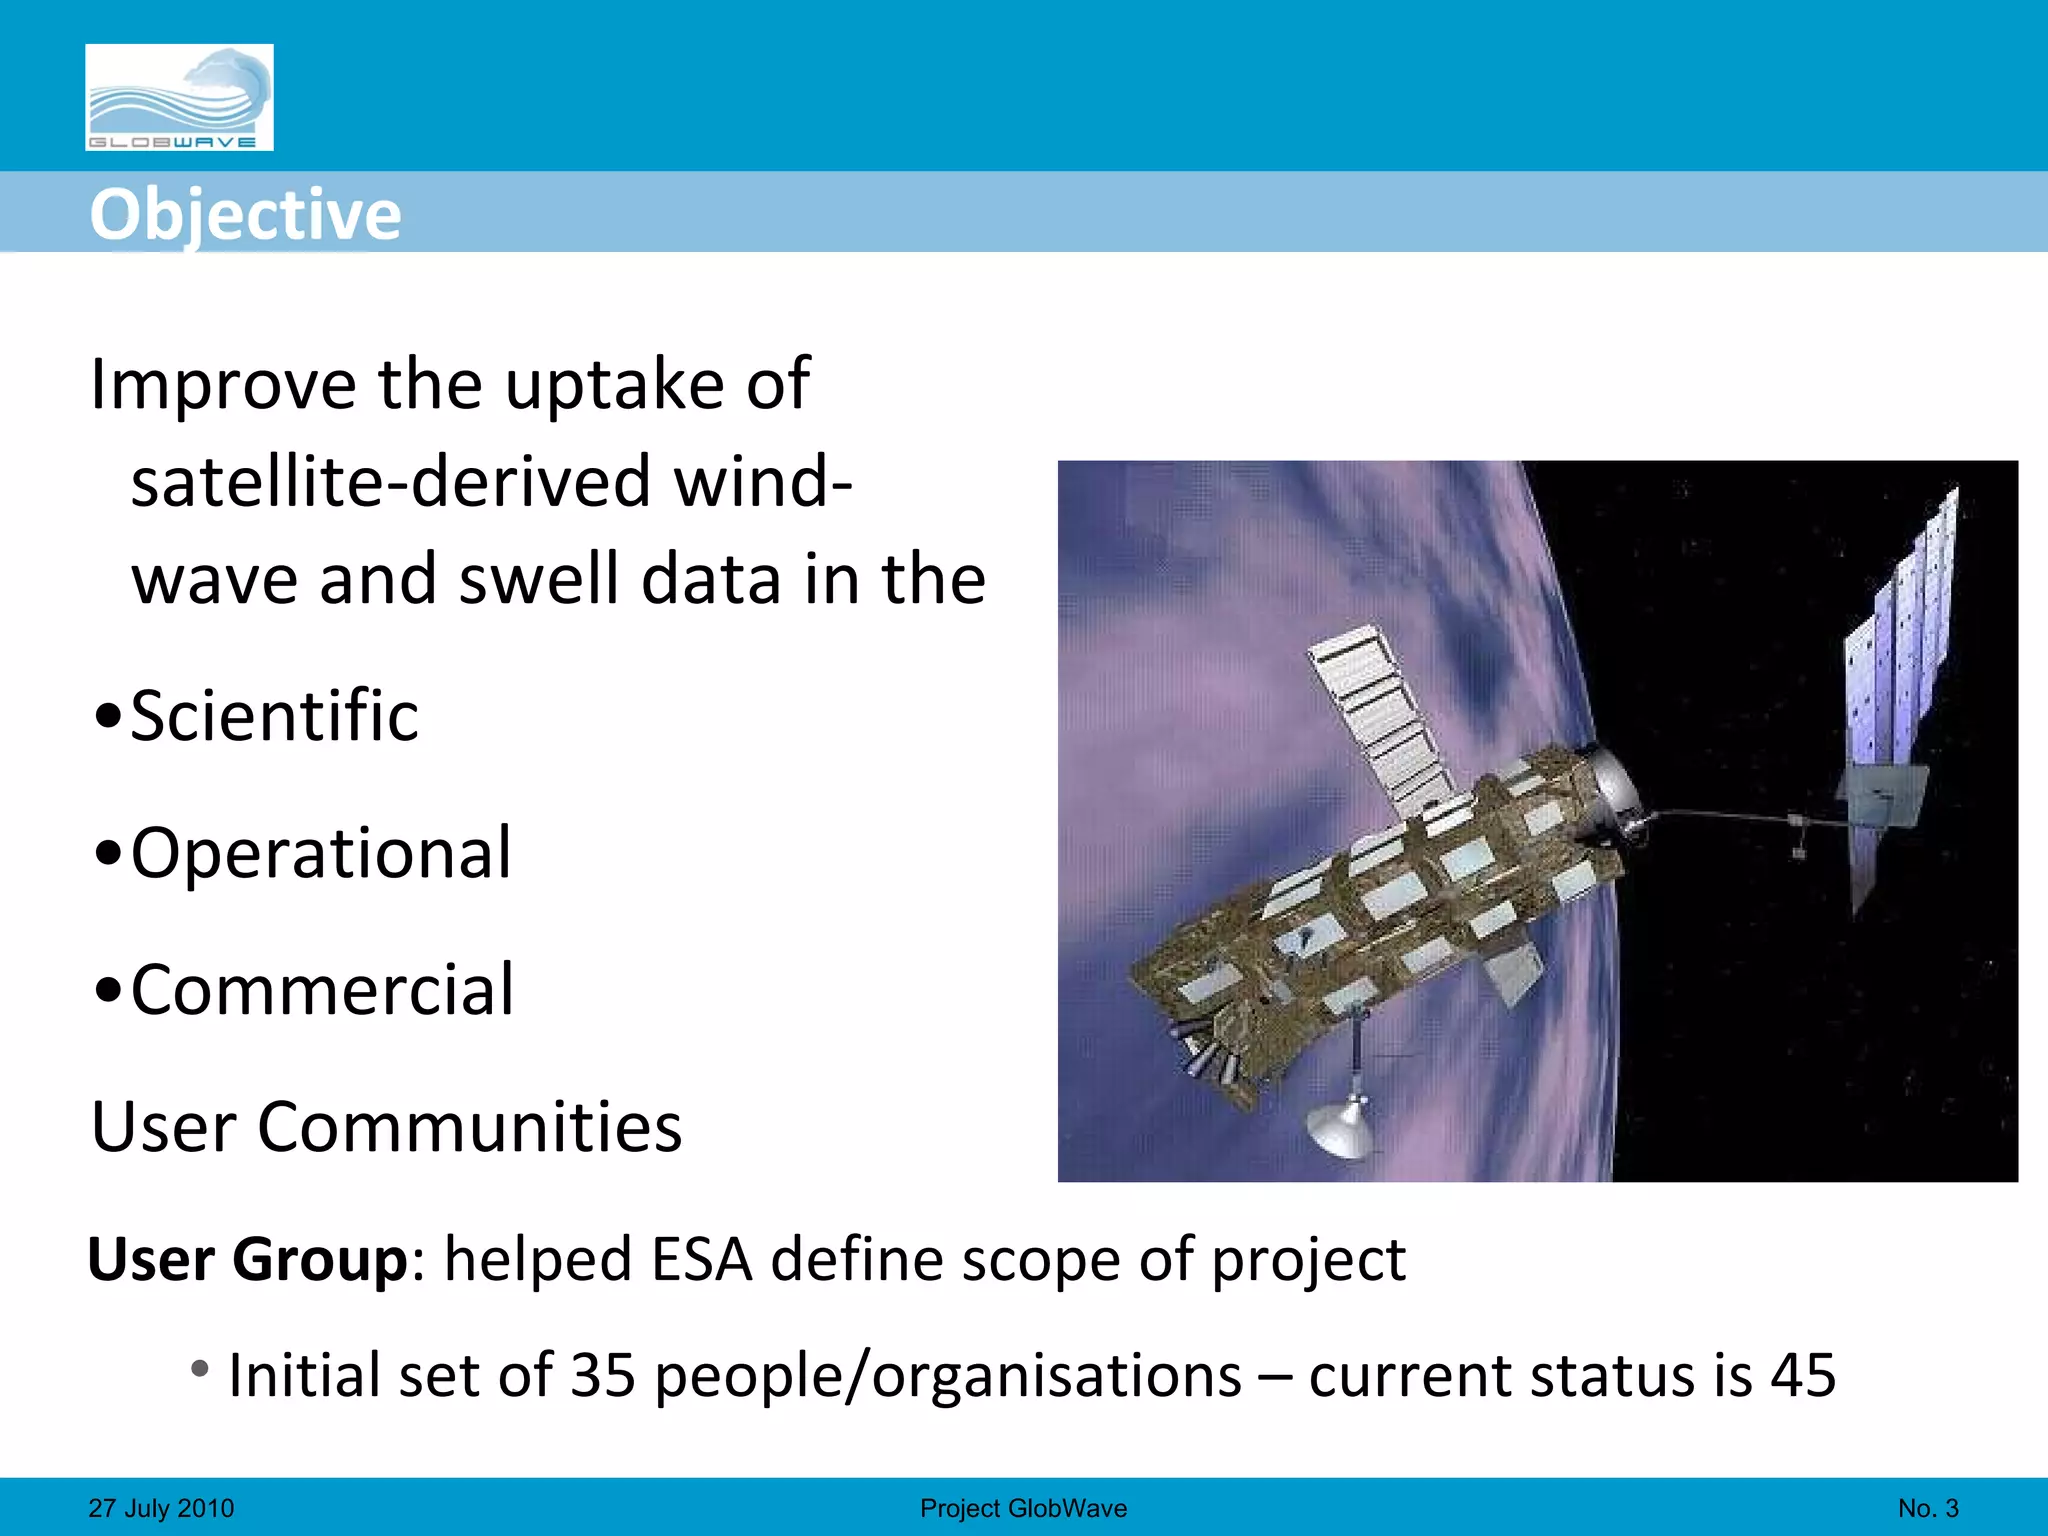
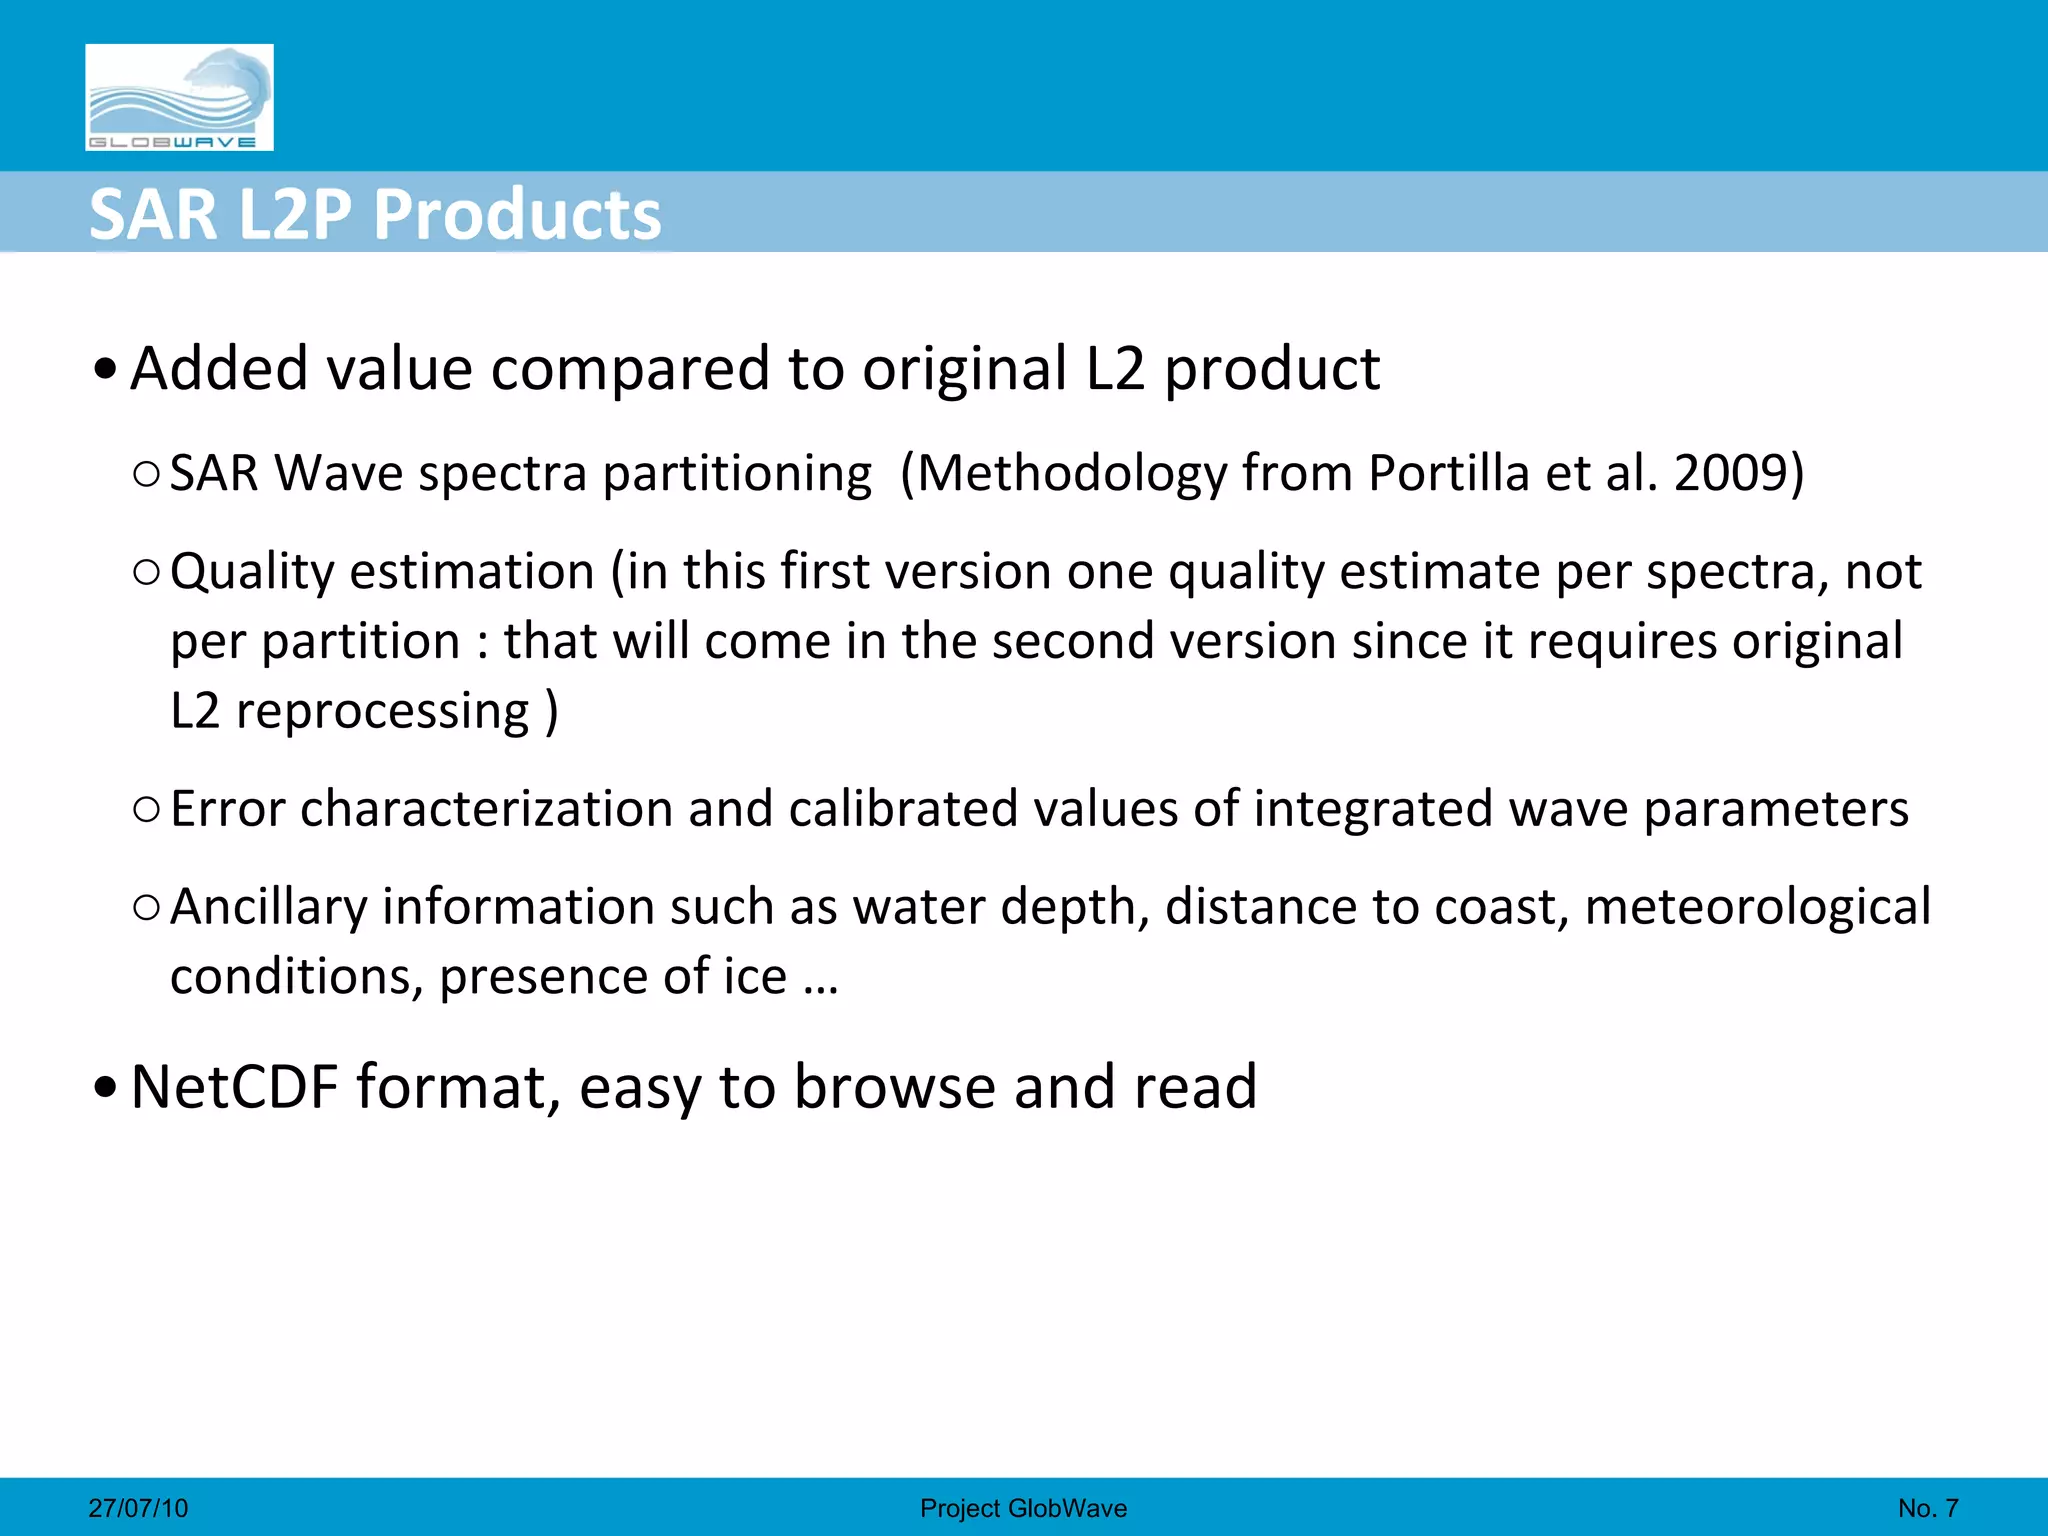
Fabrice Collard, CLS Geoff Busswell, Logica GlobWave project  applications of global satellite wave observations
Partners ESA: Funding the project through its Data User Element Programme CNES: Providing co-funding and advice during the project Logica: Prime Contractor – responsible for all development, delivery and public outreach of GlobWave for ESA. Ifremer: Responsible for development of the portal, in situ database and hosting of the data and operational system SatOC: Responsible for the Altimeter processing, error characterisation methodologies and documentation CLS: Responsible for the SAR processing and error characterisation NOC: Responsible for the Pilot Spatial WFVS and HR-DDS No.  27 July 2010 Project GlobWave
Objective Improve the uptake of satellite-derived wind-wave and swell data in the Scientific Operational Commercial  User Communities  No.  27 July 2010 Project GlobWave User Group : helped ESA define scope of project Initial set of 35 people/organisations – current status is 45
Strategy Develop a GlobWave web portal  Single point of reference for satellite wave data Clear documentation about satellite data acquisition techniques Access to on-line tools, reports, cal/val info, etc. Provision of: A multi-sensor set of satellite wave data in a common format and meta-data standard.  A set of demonstration data products Inter-comparison of different wave data sources  SAR and altimeter wave data error characterisation using collocated in situ measurements  Cross characterisation between different satellite data streams  No.  27 July 2010 Project GlobWave
Exemple of Error characterisation results
Satellite Products All satellite products available in a “common” L2P format NetCDF-3 Meta-data standard is CF-1.4 compliant Data are available for the full archive of each satellite (released on 22nd April 2010) NRT data will be available within 1 hour of receipt (available in late summer) Future Satellite Data Cryosat-2 – successful launch in March, 2010 Altika – due for launch at the end of 2010 No.  27 July 2010 Project GlobWave ERS-1, ERS-2, ENVISAT ERS-1, ERS-2, ENVISAT, TOPEX/POSEIDON, Jason-1, Jason-2, GEOSAT, GFO Altimeter SAR
SAR L2P Products Added value compared to original L2 product SAR Wave spectra partitioning  (Methodology from Portilla et al. 2009) Quality estimation (in this first version one quality estimate per spectra, not per partition : that will come in the second version since it requires original L2 reprocessing ) Error characterization and calibrated values of integrated wave parameters Ancillary information such as water depth, distance to coast, meteorological conditions, presence of ice … NetCDF format, easy to browse and read No.  27/07/10 Project GlobWave
Satellite vs In Situ Matchup Database A satellite vs. in situ matchup database has been constructed using: The full archive of L2P satellite data An initial set of in situ data sources from: POSEIDON Puertos del Estado NODC UKMO CDIP MEDS (Aug 2010) Derived error statistics are beeing inserted into satellite data (to be completed by mid August 2010) No.  27 July 2010 Project GlobWave
Satellite vs Satellite Matchup Database Database of satellite crossovers will be produced Collocation criteria will be used of: 60 km 1hour Full archives of data will be used Each year the new crossovers will be produced Differences analysed wrt wind speed and H No.  27 July 2010 Project GlobWave GFOSAT ERS-1 ERS-2 TOPEX/ Poseidon Jason-1 Jason-2 Envisat GFOSAT ERS-1 ERS-2 TOPEX/Poseidon Jason-1 Jason-2 Envisat Same orbit track Different time frames Matchups possible
GlobWave Diagnostic Data Set (DDS) Allows the following interactive inter-comparisons over fixed sites of interest: Satellite vs. satellite Satellite vs. model Model vs. model Calculations are of a diagnostic nature  (i.e. not based on a matchup database) For each parameter, various statistics  can be generated (mean, min, max,  standard deviation, skew, kurtois, median) Interactive plot generation, 2-D and 1-D plots Allows the request of periodic (offline) and interactive reports No.  27 July 2010 Project GlobWave
Online Tools Data Dissemination  FTP (browsable directories by satellite/year/day, etc.) THREDDS/OpenDAP  External links to 3rd party tools for:  Data search Data sub-setting Visualisation Satellite vs. in situ query interface  Query criterion (Space/time window, etc) Extraction in NetCDF format Statistical and graphical displays HR-DDS services  Satellite and model diagnostic inter-comparisons Statistics and visualisation No.  27 July 2010 Project GlobWave
Pilot Spatial Wave Forecast Verification Scheme Existing WFVS scheme: Initiated by ECMWF and operated since 1995 Monthly inter-comparison of in situ and model data 12 participating Meteorological organisations GlobWave Pilot Spatial WFVS will extend the existing scheme: Operate for a demonstration period of 2 years Allow inter-comparison of satellite and model data Ingest model data on a monthly basis from participating organisations Provide (configurable) offline reports on a monthly basis illustrating the previous months inter-comparisons Allow interactive inter-comparisons using the GlobWave DDS No.  27 July 2010 Project GlobWave
Demonstration Products GlobWave will host “demo products” which could be: New types of info derived from SAR/Altimetry Merged SAR/Altimeter products Satellite wave retrievals augmented with model data Analysis from assimilations of satellite wave data into wave models The initial set of demonstration products is: Hs-Tz scatterplots (SatOC) Fireworks (CLS) Soprano (CLS) Win-win! Demo products concept designed to stimulate wave  community to get involved Great publicity/outreach for your organisation No.  27 July 2010 Project GlobWave
Demonstration product  : Swell Source Identification Principle: Identify regions and time of  refocusing  of observed swell partitions propagated back in time following linear theory of wave propagation For each detected source, separated identification in space and time for groups of long, mid and short swell.
Over 300 detected sources, good spreading of time of refocusing depending on wavelength: Any reference to the generating storm?  Demonstration product  : Swell Source Identification Wavelength Time of refocusing [hours] (long wavelengths are taken as reference time) Mid 5h Short 14h
Comparison with Storm tracks: storms are tracked using JRA-25 model with local maximum vorticity as criteria: Identifies storm center: Good for tracing the storm life cycle, but can be far from region of highest winds. Vorticity value used as indicator on storm strength (since max wind difficult to attach to a certain storm) Storm track from JRA-25 Track of max refocusing  for all wl groups Long WL – 8 Janv 0H  Mid WL – 8 Janv 6H  Short WL – 9 Janv 6H  Demonstration product  : Swell Source Identification
Comparison of time of max. vorticity (≈max. strength) with time of swell generation given by refocusing:  Swell is generated after occurrence of the max. (strong winds)  Swell generation time mostly depends on the  remaining fetch Demonstration product  : Swell Source Identification Wavelength Time of refocusing [hours] (reference time is time of max vorticity) Long 11,5h Mid 16,5h Short 24h
 
GlobWave Portal Products area Product User Guide Wave data handbook Demo Product Access Validation area L2P Quality Control Reports Global Wave Statistics info Tools area Workshops & events area Community News No.  27 July 2010 Project GlobWave www.globwave.info
Outreach User Group of 45 people/organisations Spans scientific, operational and commercial user communities We consulted closely with participants to define user requirements Bi-annual Newsletter First issue distributed at the end of 2009. Second issue distributed during Autumn 2010 Conference posters/presentations WISE 2009, OceanSAR 2009, OceanObs, SeaSAR 2010, ESA Living Planet 2010, IGARSS 2010 Hosting of demo products –help stimulate wave community User Consultation Meetings 3 planned (at end of each phase), allows us to gather feedback 1st UCM was held at Ifremer on 29th, 30th April 2010 No.  27 July 2010 Project GlobWave
Timeline Started in Jan 2009 Started with Requirements Baseline and Technical Specification (published 2009) All delayed mode GlobWave data available via ftp  Final version of portal Producing Pilot Spatial WFVS Reports Initial demo products Satellite-satellite inter-comparisons for archived products (July 2010) MDB for archived satellite and in situ data (July 2010) NRT data will be available via ftp (August 2010) Due early 2011 Wave Data Handbook Updates of Inter-comparisons Online tools for query of MDB. End of Project - early 2012 -> transfer from ESA to EU GMES services ? No.  27 July 2010 Project GlobWave
Questions No.  27 July 2010 Project GlobWave

TU1.L10 - Globwave and applications of global satellite wave observations

  • 1.
    Fabrice Collard, CLSGeoff Busswell, Logica GlobWave project applications of global satellite wave observations
  • 2.
    Partners ESA: Fundingthe project through its Data User Element Programme CNES: Providing co-funding and advice during the project Logica: Prime Contractor – responsible for all development, delivery and public outreach of GlobWave for ESA. Ifremer: Responsible for development of the portal, in situ database and hosting of the data and operational system SatOC: Responsible for the Altimeter processing, error characterisation methodologies and documentation CLS: Responsible for the SAR processing and error characterisation NOC: Responsible for the Pilot Spatial WFVS and HR-DDS No. 27 July 2010 Project GlobWave
  • 3.
    Objective Improve theuptake of satellite-derived wind-wave and swell data in the Scientific Operational Commercial User Communities No. 27 July 2010 Project GlobWave User Group : helped ESA define scope of project Initial set of 35 people/organisations – current status is 45
  • 4.
    Strategy Develop aGlobWave web portal Single point of reference for satellite wave data Clear documentation about satellite data acquisition techniques Access to on-line tools, reports, cal/val info, etc. Provision of: A multi-sensor set of satellite wave data in a common format and meta-data standard. A set of demonstration data products Inter-comparison of different wave data sources SAR and altimeter wave data error characterisation using collocated in situ measurements Cross characterisation between different satellite data streams No. 27 July 2010 Project GlobWave
  • 5.
    Exemple of Errorcharacterisation results
  • 6.
    Satellite Products Allsatellite products available in a “common” L2P format NetCDF-3 Meta-data standard is CF-1.4 compliant Data are available for the full archive of each satellite (released on 22nd April 2010) NRT data will be available within 1 hour of receipt (available in late summer) Future Satellite Data Cryosat-2 – successful launch in March, 2010 Altika – due for launch at the end of 2010 No. 27 July 2010 Project GlobWave ERS-1, ERS-2, ENVISAT ERS-1, ERS-2, ENVISAT, TOPEX/POSEIDON, Jason-1, Jason-2, GEOSAT, GFO Altimeter SAR
  • 7.
    SAR L2P ProductsAdded value compared to original L2 product SAR Wave spectra partitioning (Methodology from Portilla et al. 2009) Quality estimation (in this first version one quality estimate per spectra, not per partition : that will come in the second version since it requires original L2 reprocessing ) Error characterization and calibrated values of integrated wave parameters Ancillary information such as water depth, distance to coast, meteorological conditions, presence of ice … NetCDF format, easy to browse and read No. 27/07/10 Project GlobWave
  • 8.
    Satellite vs InSitu Matchup Database A satellite vs. in situ matchup database has been constructed using: The full archive of L2P satellite data An initial set of in situ data sources from: POSEIDON Puertos del Estado NODC UKMO CDIP MEDS (Aug 2010) Derived error statistics are beeing inserted into satellite data (to be completed by mid August 2010) No. 27 July 2010 Project GlobWave
  • 9.
    Satellite vs SatelliteMatchup Database Database of satellite crossovers will be produced Collocation criteria will be used of: 60 km 1hour Full archives of data will be used Each year the new crossovers will be produced Differences analysed wrt wind speed and H No. 27 July 2010 Project GlobWave GFOSAT ERS-1 ERS-2 TOPEX/ Poseidon Jason-1 Jason-2 Envisat GFOSAT ERS-1 ERS-2 TOPEX/Poseidon Jason-1 Jason-2 Envisat Same orbit track Different time frames Matchups possible
  • 10.
    GlobWave Diagnostic DataSet (DDS) Allows the following interactive inter-comparisons over fixed sites of interest: Satellite vs. satellite Satellite vs. model Model vs. model Calculations are of a diagnostic nature (i.e. not based on a matchup database) For each parameter, various statistics can be generated (mean, min, max, standard deviation, skew, kurtois, median) Interactive plot generation, 2-D and 1-D plots Allows the request of periodic (offline) and interactive reports No. 27 July 2010 Project GlobWave
  • 11.
    Online Tools DataDissemination FTP (browsable directories by satellite/year/day, etc.) THREDDS/OpenDAP External links to 3rd party tools for: Data search Data sub-setting Visualisation Satellite vs. in situ query interface Query criterion (Space/time window, etc) Extraction in NetCDF format Statistical and graphical displays HR-DDS services Satellite and model diagnostic inter-comparisons Statistics and visualisation No. 27 July 2010 Project GlobWave
  • 12.
    Pilot Spatial WaveForecast Verification Scheme Existing WFVS scheme: Initiated by ECMWF and operated since 1995 Monthly inter-comparison of in situ and model data 12 participating Meteorological organisations GlobWave Pilot Spatial WFVS will extend the existing scheme: Operate for a demonstration period of 2 years Allow inter-comparison of satellite and model data Ingest model data on a monthly basis from participating organisations Provide (configurable) offline reports on a monthly basis illustrating the previous months inter-comparisons Allow interactive inter-comparisons using the GlobWave DDS No. 27 July 2010 Project GlobWave
  • 13.
    Demonstration Products GlobWavewill host “demo products” which could be: New types of info derived from SAR/Altimetry Merged SAR/Altimeter products Satellite wave retrievals augmented with model data Analysis from assimilations of satellite wave data into wave models The initial set of demonstration products is: Hs-Tz scatterplots (SatOC) Fireworks (CLS) Soprano (CLS) Win-win! Demo products concept designed to stimulate wave community to get involved Great publicity/outreach for your organisation No. 27 July 2010 Project GlobWave
  • 14.
    Demonstration product : Swell Source Identification Principle: Identify regions and time of refocusing of observed swell partitions propagated back in time following linear theory of wave propagation For each detected source, separated identification in space and time for groups of long, mid and short swell.
  • 15.
    Over 300 detectedsources, good spreading of time of refocusing depending on wavelength: Any reference to the generating storm? Demonstration product : Swell Source Identification Wavelength Time of refocusing [hours] (long wavelengths are taken as reference time) Mid 5h Short 14h
  • 16.
    Comparison with Stormtracks: storms are tracked using JRA-25 model with local maximum vorticity as criteria: Identifies storm center: Good for tracing the storm life cycle, but can be far from region of highest winds. Vorticity value used as indicator on storm strength (since max wind difficult to attach to a certain storm) Storm track from JRA-25 Track of max refocusing for all wl groups Long WL – 8 Janv 0H Mid WL – 8 Janv 6H Short WL – 9 Janv 6H Demonstration product : Swell Source Identification
  • 17.
    Comparison of timeof max. vorticity (≈max. strength) with time of swell generation given by refocusing:  Swell is generated after occurrence of the max. (strong winds)  Swell generation time mostly depends on the remaining fetch Demonstration product : Swell Source Identification Wavelength Time of refocusing [hours] (reference time is time of max vorticity) Long 11,5h Mid 16,5h Short 24h
  • 18.
  • 19.
    GlobWave Portal Productsarea Product User Guide Wave data handbook Demo Product Access Validation area L2P Quality Control Reports Global Wave Statistics info Tools area Workshops & events area Community News No. 27 July 2010 Project GlobWave www.globwave.info
  • 20.
    Outreach User Groupof 45 people/organisations Spans scientific, operational and commercial user communities We consulted closely with participants to define user requirements Bi-annual Newsletter First issue distributed at the end of 2009. Second issue distributed during Autumn 2010 Conference posters/presentations WISE 2009, OceanSAR 2009, OceanObs, SeaSAR 2010, ESA Living Planet 2010, IGARSS 2010 Hosting of demo products –help stimulate wave community User Consultation Meetings 3 planned (at end of each phase), allows us to gather feedback 1st UCM was held at Ifremer on 29th, 30th April 2010 No. 27 July 2010 Project GlobWave
  • 21.
    Timeline Started inJan 2009 Started with Requirements Baseline and Technical Specification (published 2009) All delayed mode GlobWave data available via ftp Final version of portal Producing Pilot Spatial WFVS Reports Initial demo products Satellite-satellite inter-comparisons for archived products (July 2010) MDB for archived satellite and in situ data (July 2010) NRT data will be available via ftp (August 2010) Due early 2011 Wave Data Handbook Updates of Inter-comparisons Online tools for query of MDB. End of Project - early 2012 -> transfer from ESA to EU GMES services ? No. 27 July 2010 Project GlobWave
  • 22.
    Questions No. 27 July 2010 Project GlobWave

Editor's Notes

  • #2 27. Juli 2010 | Title of Presentation
  • #5 27. Juli 2010 | Title of Presentation
  • #7 • Added value compared to original L2 product.• Wave spectra partitioning (Methodology from Portilla et al. 2009)• Quality estimation (in this first version one quality estimate per spectra, not per partition : that will come in the second version since it requires original L2 reprocessing )• Error characterisation and calibrated values of integrated wave parameters.• Ancillary information such as water depth, distance to coast, meteorological conditions, presence of ice ... • NetCDF format, easy to browse and read 27. Juli 2010 | Title of Presentation