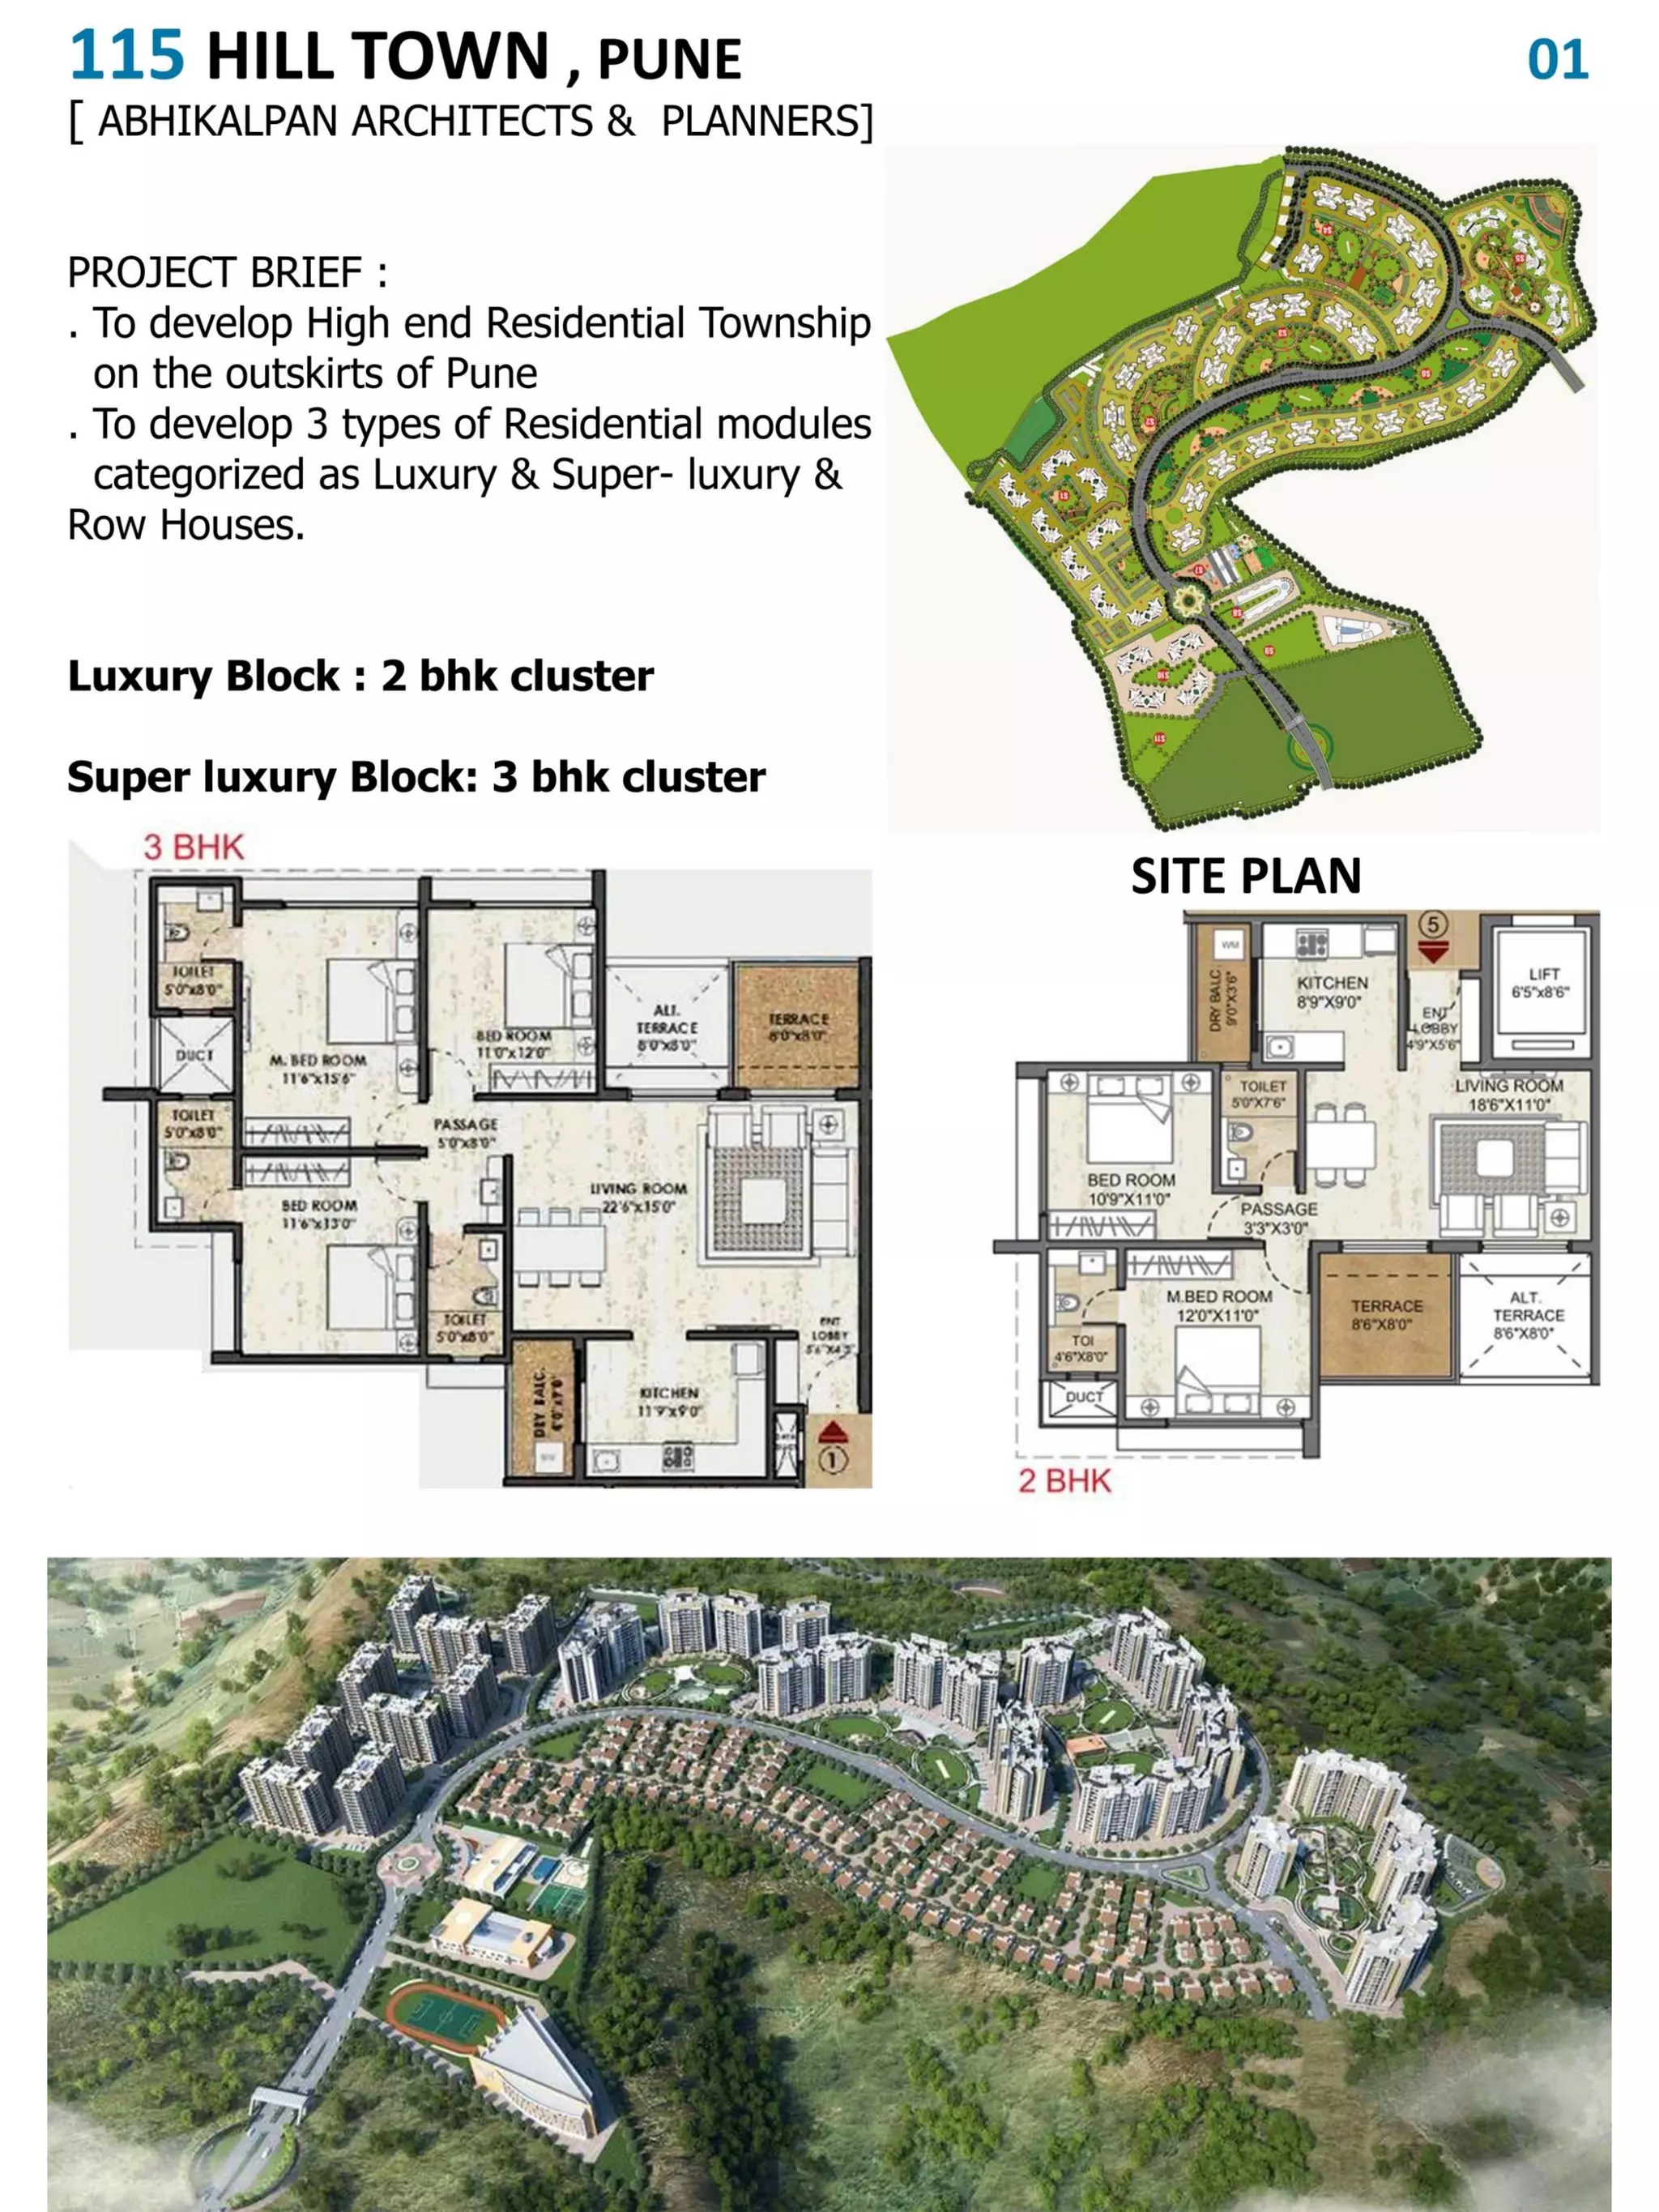
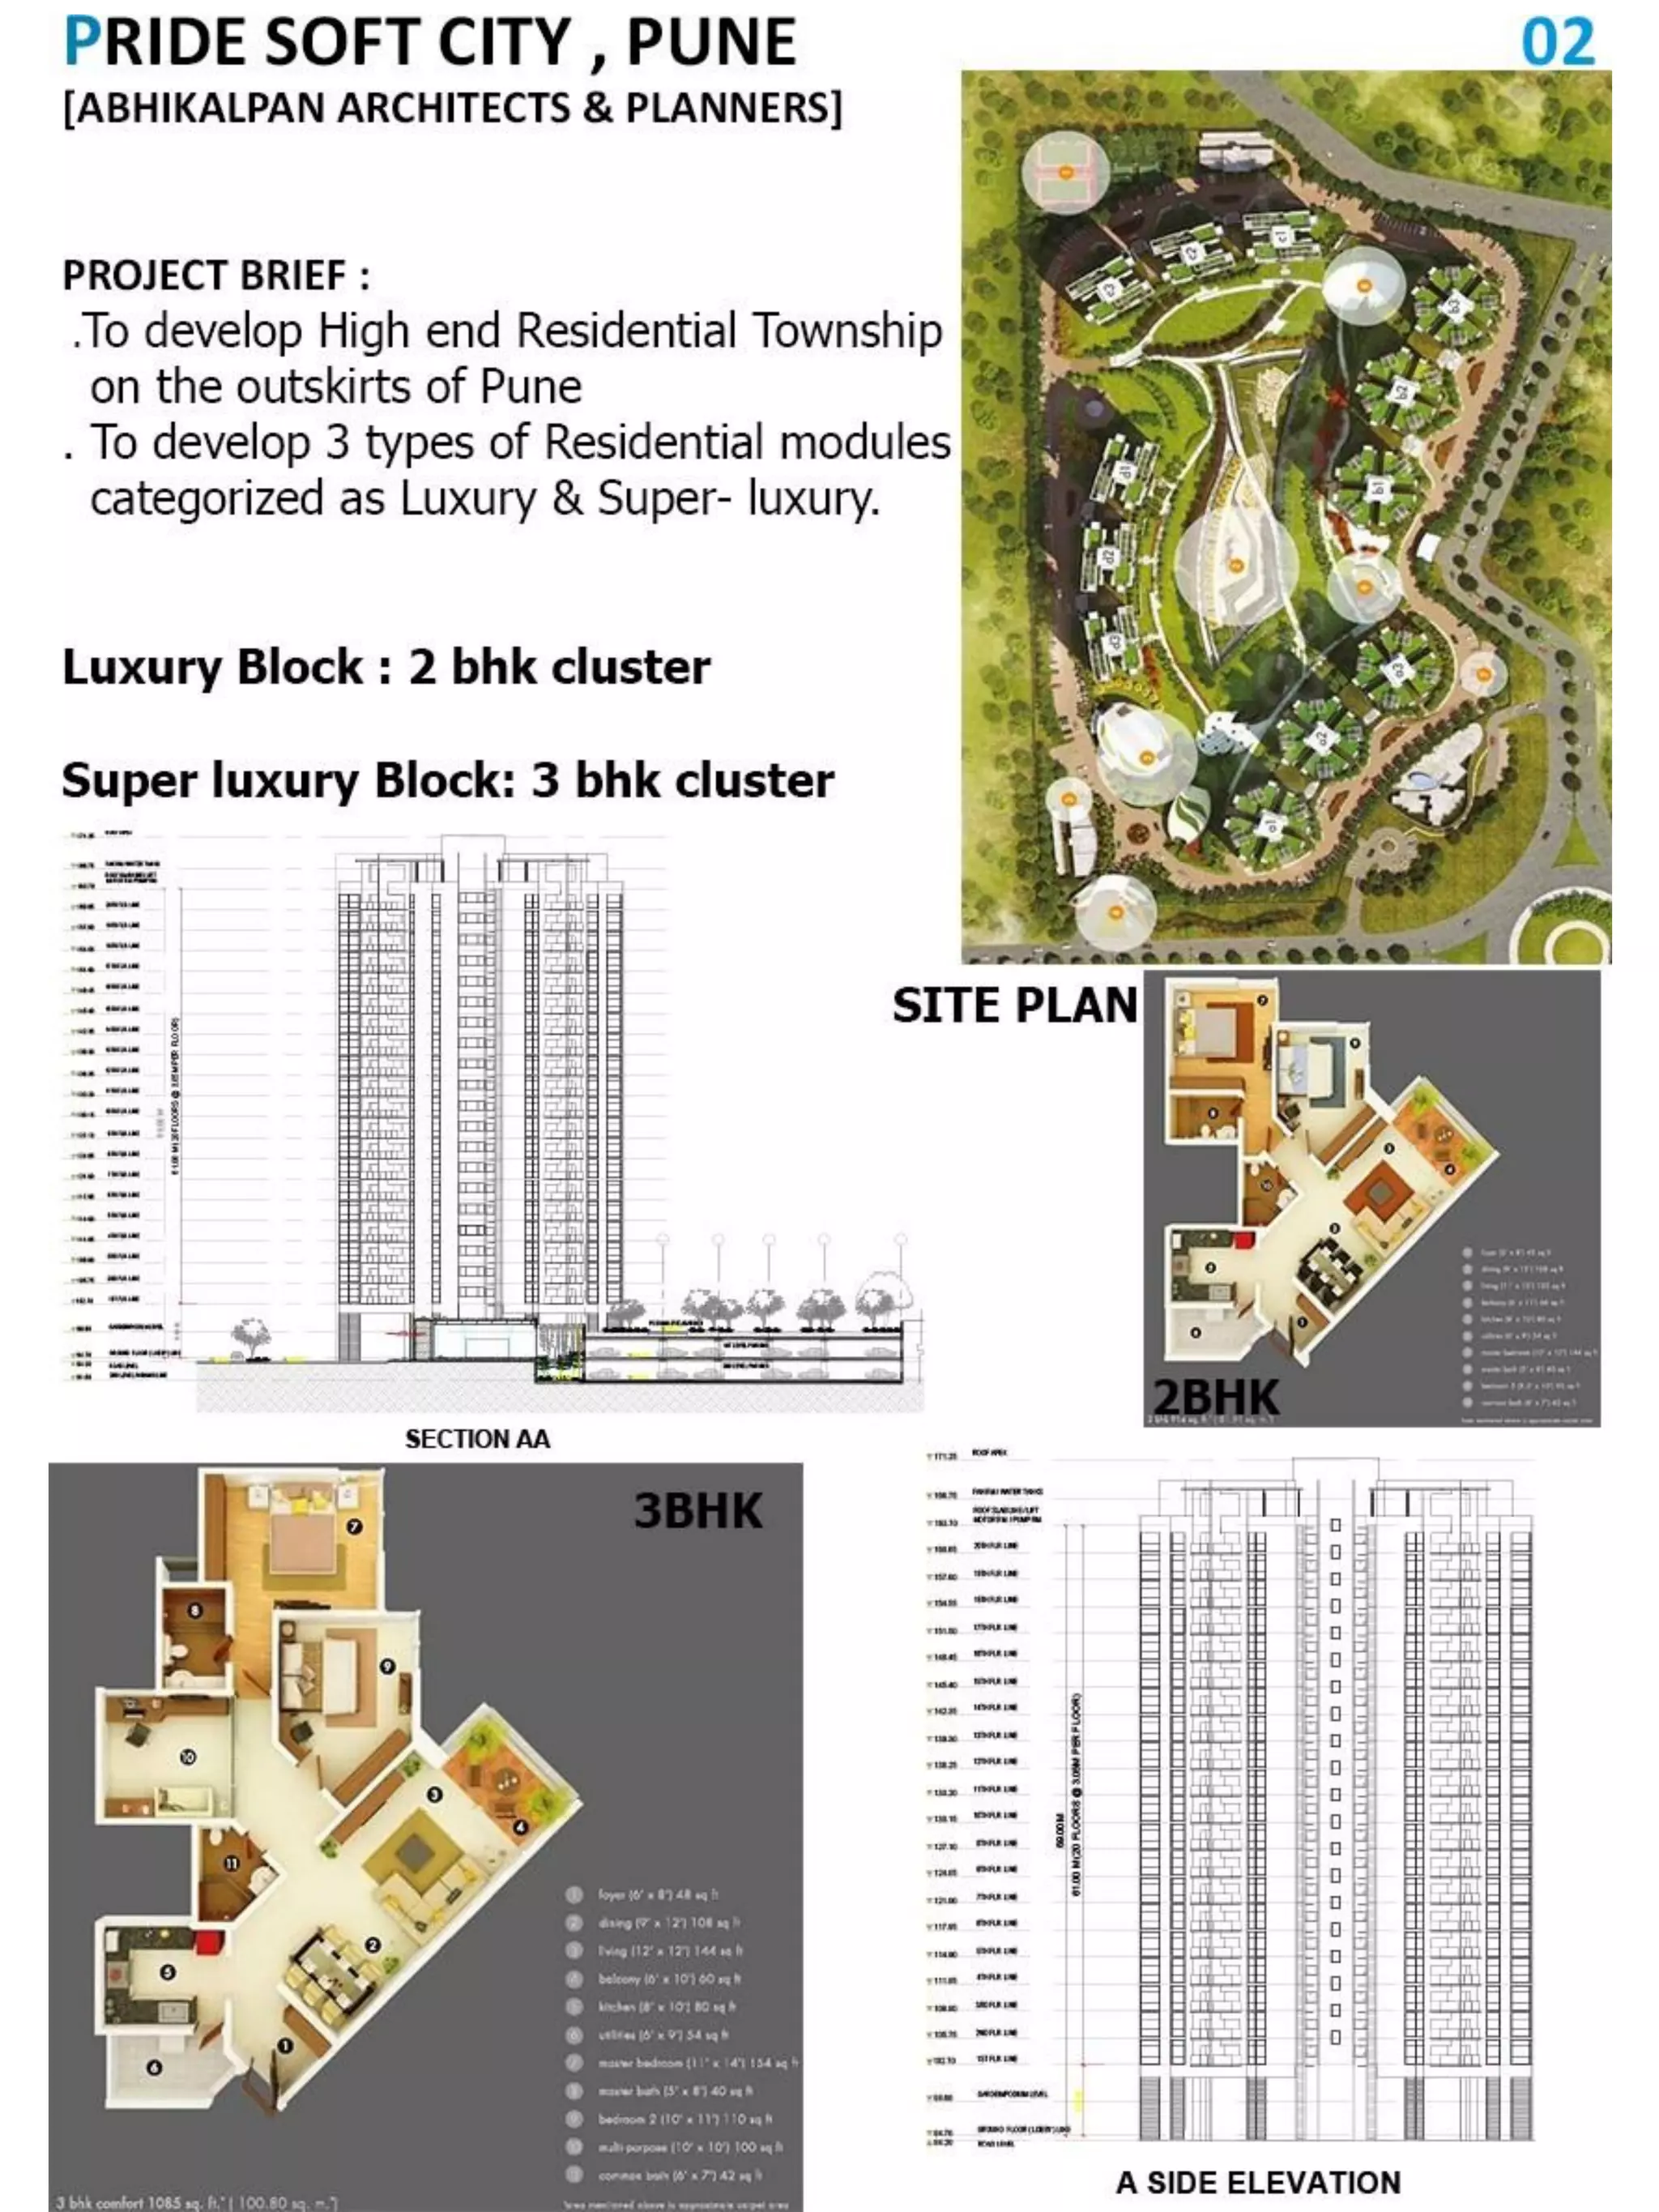
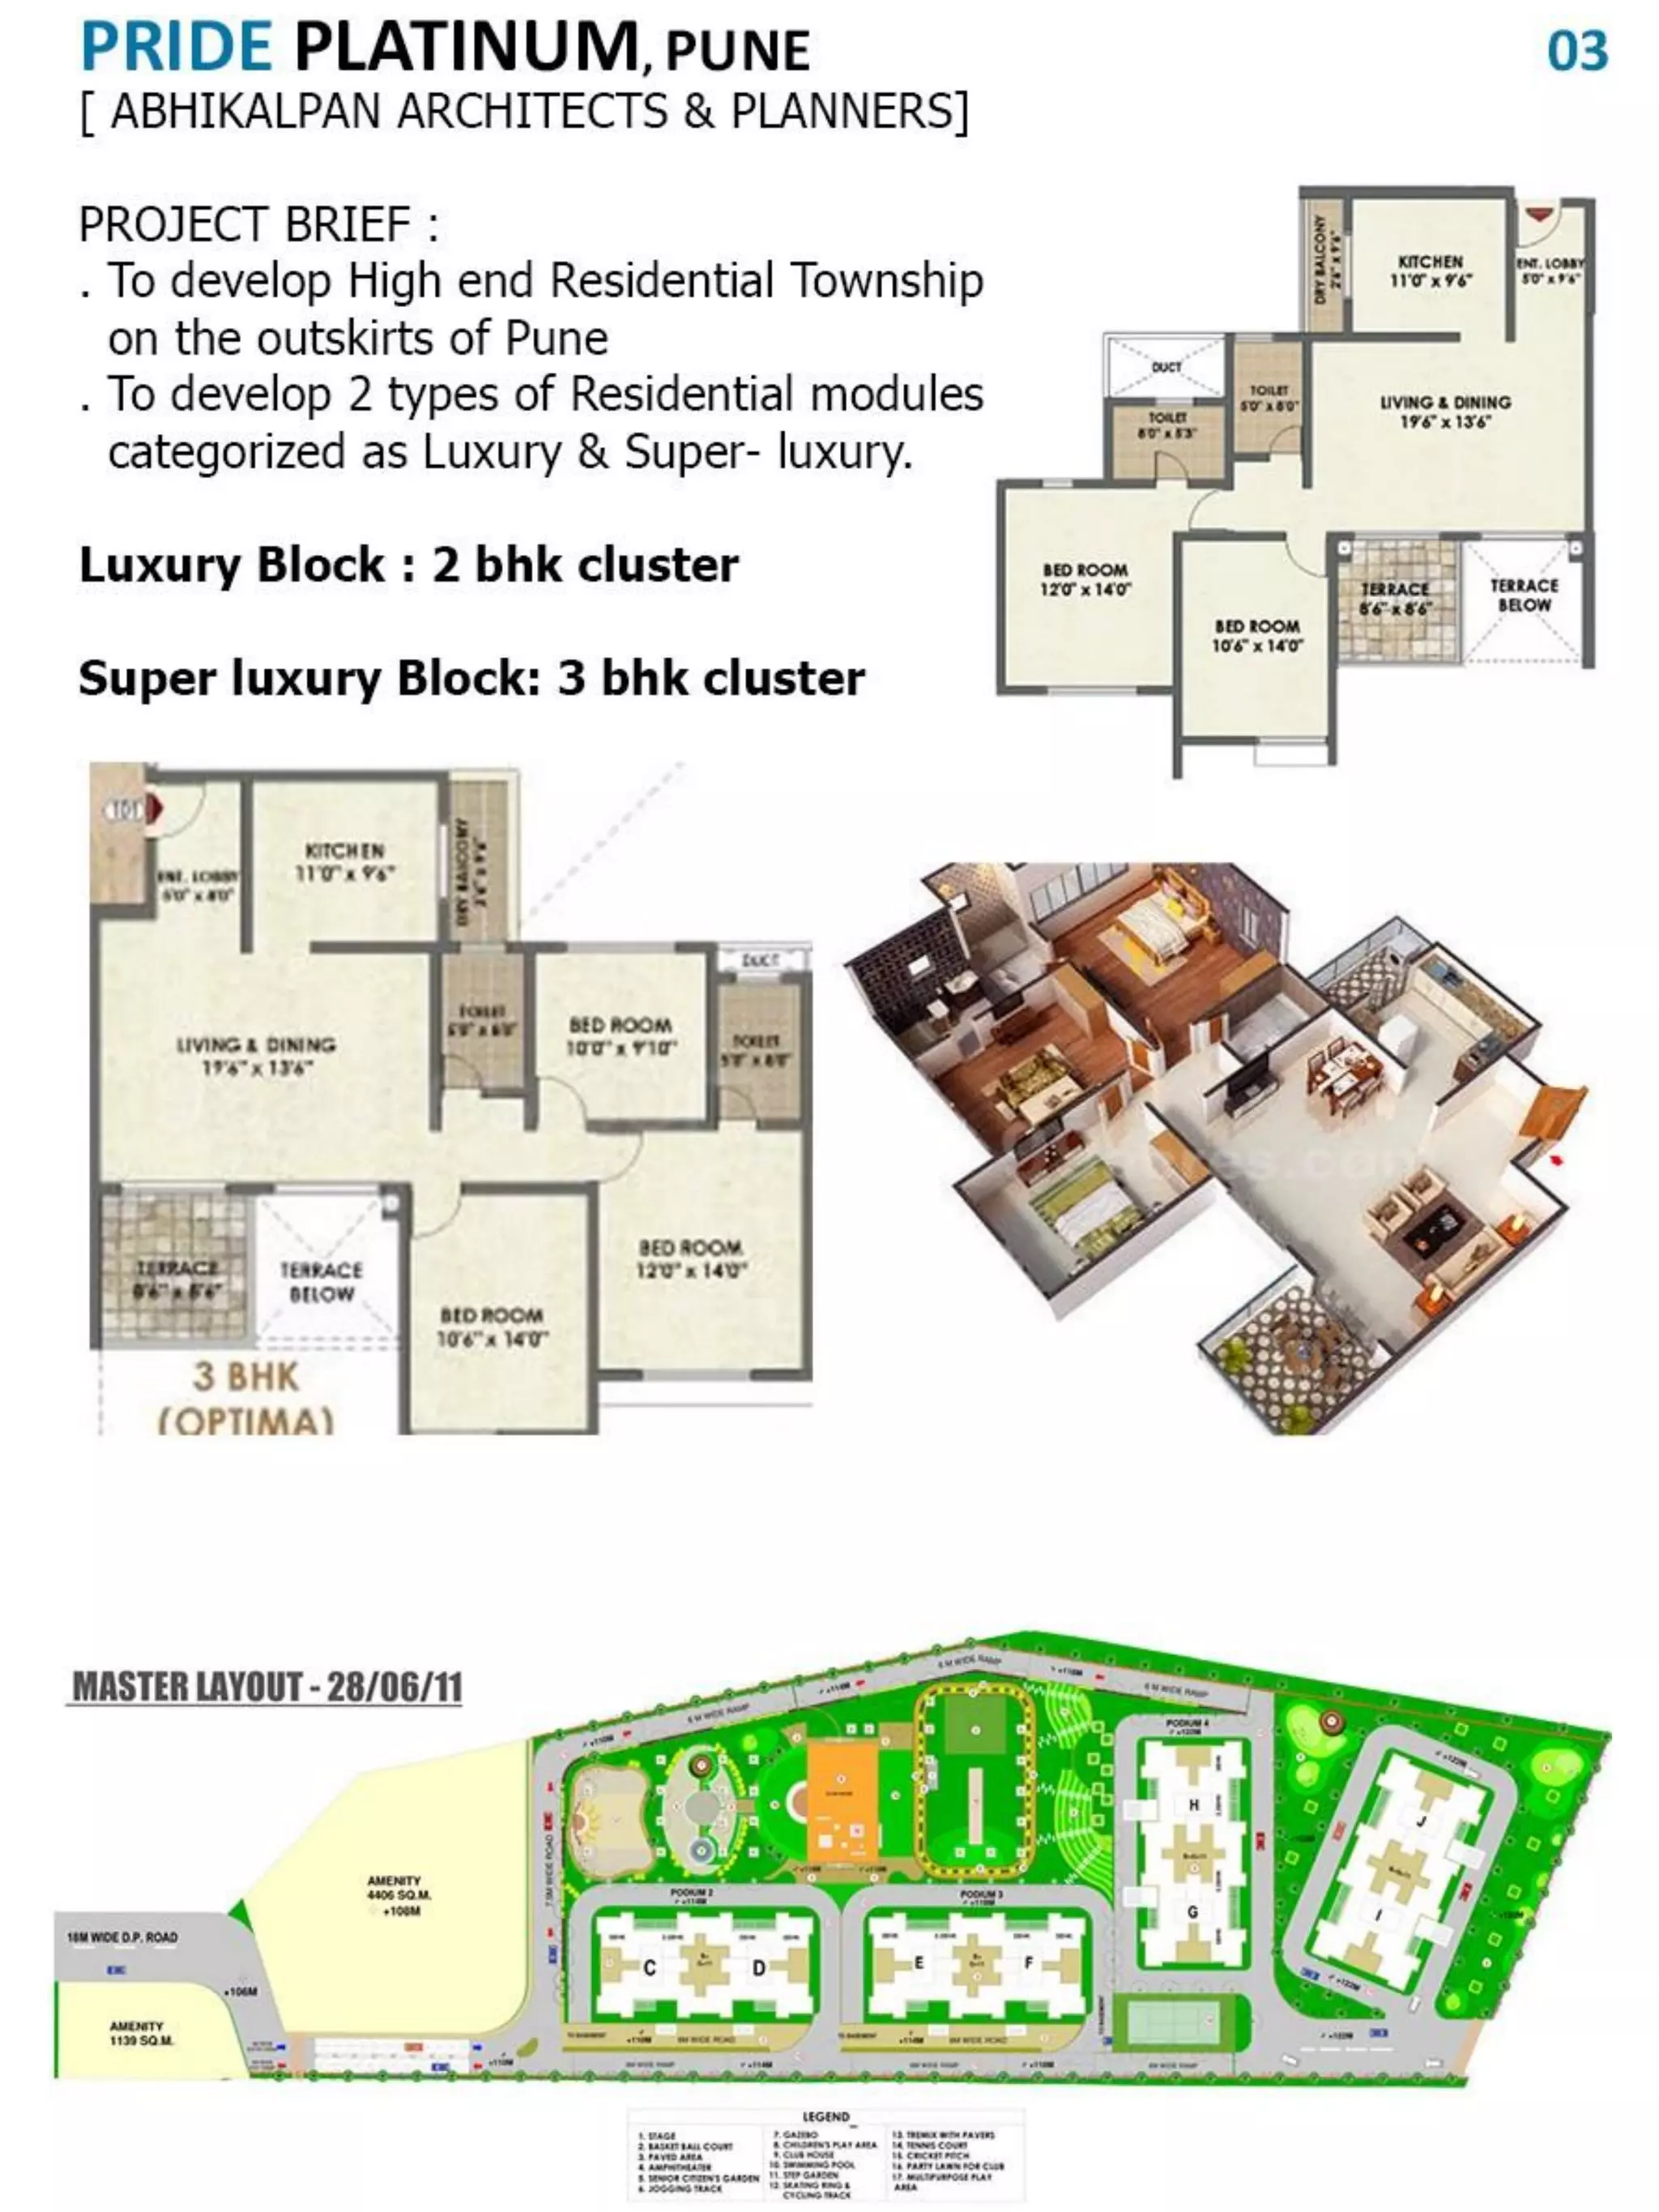
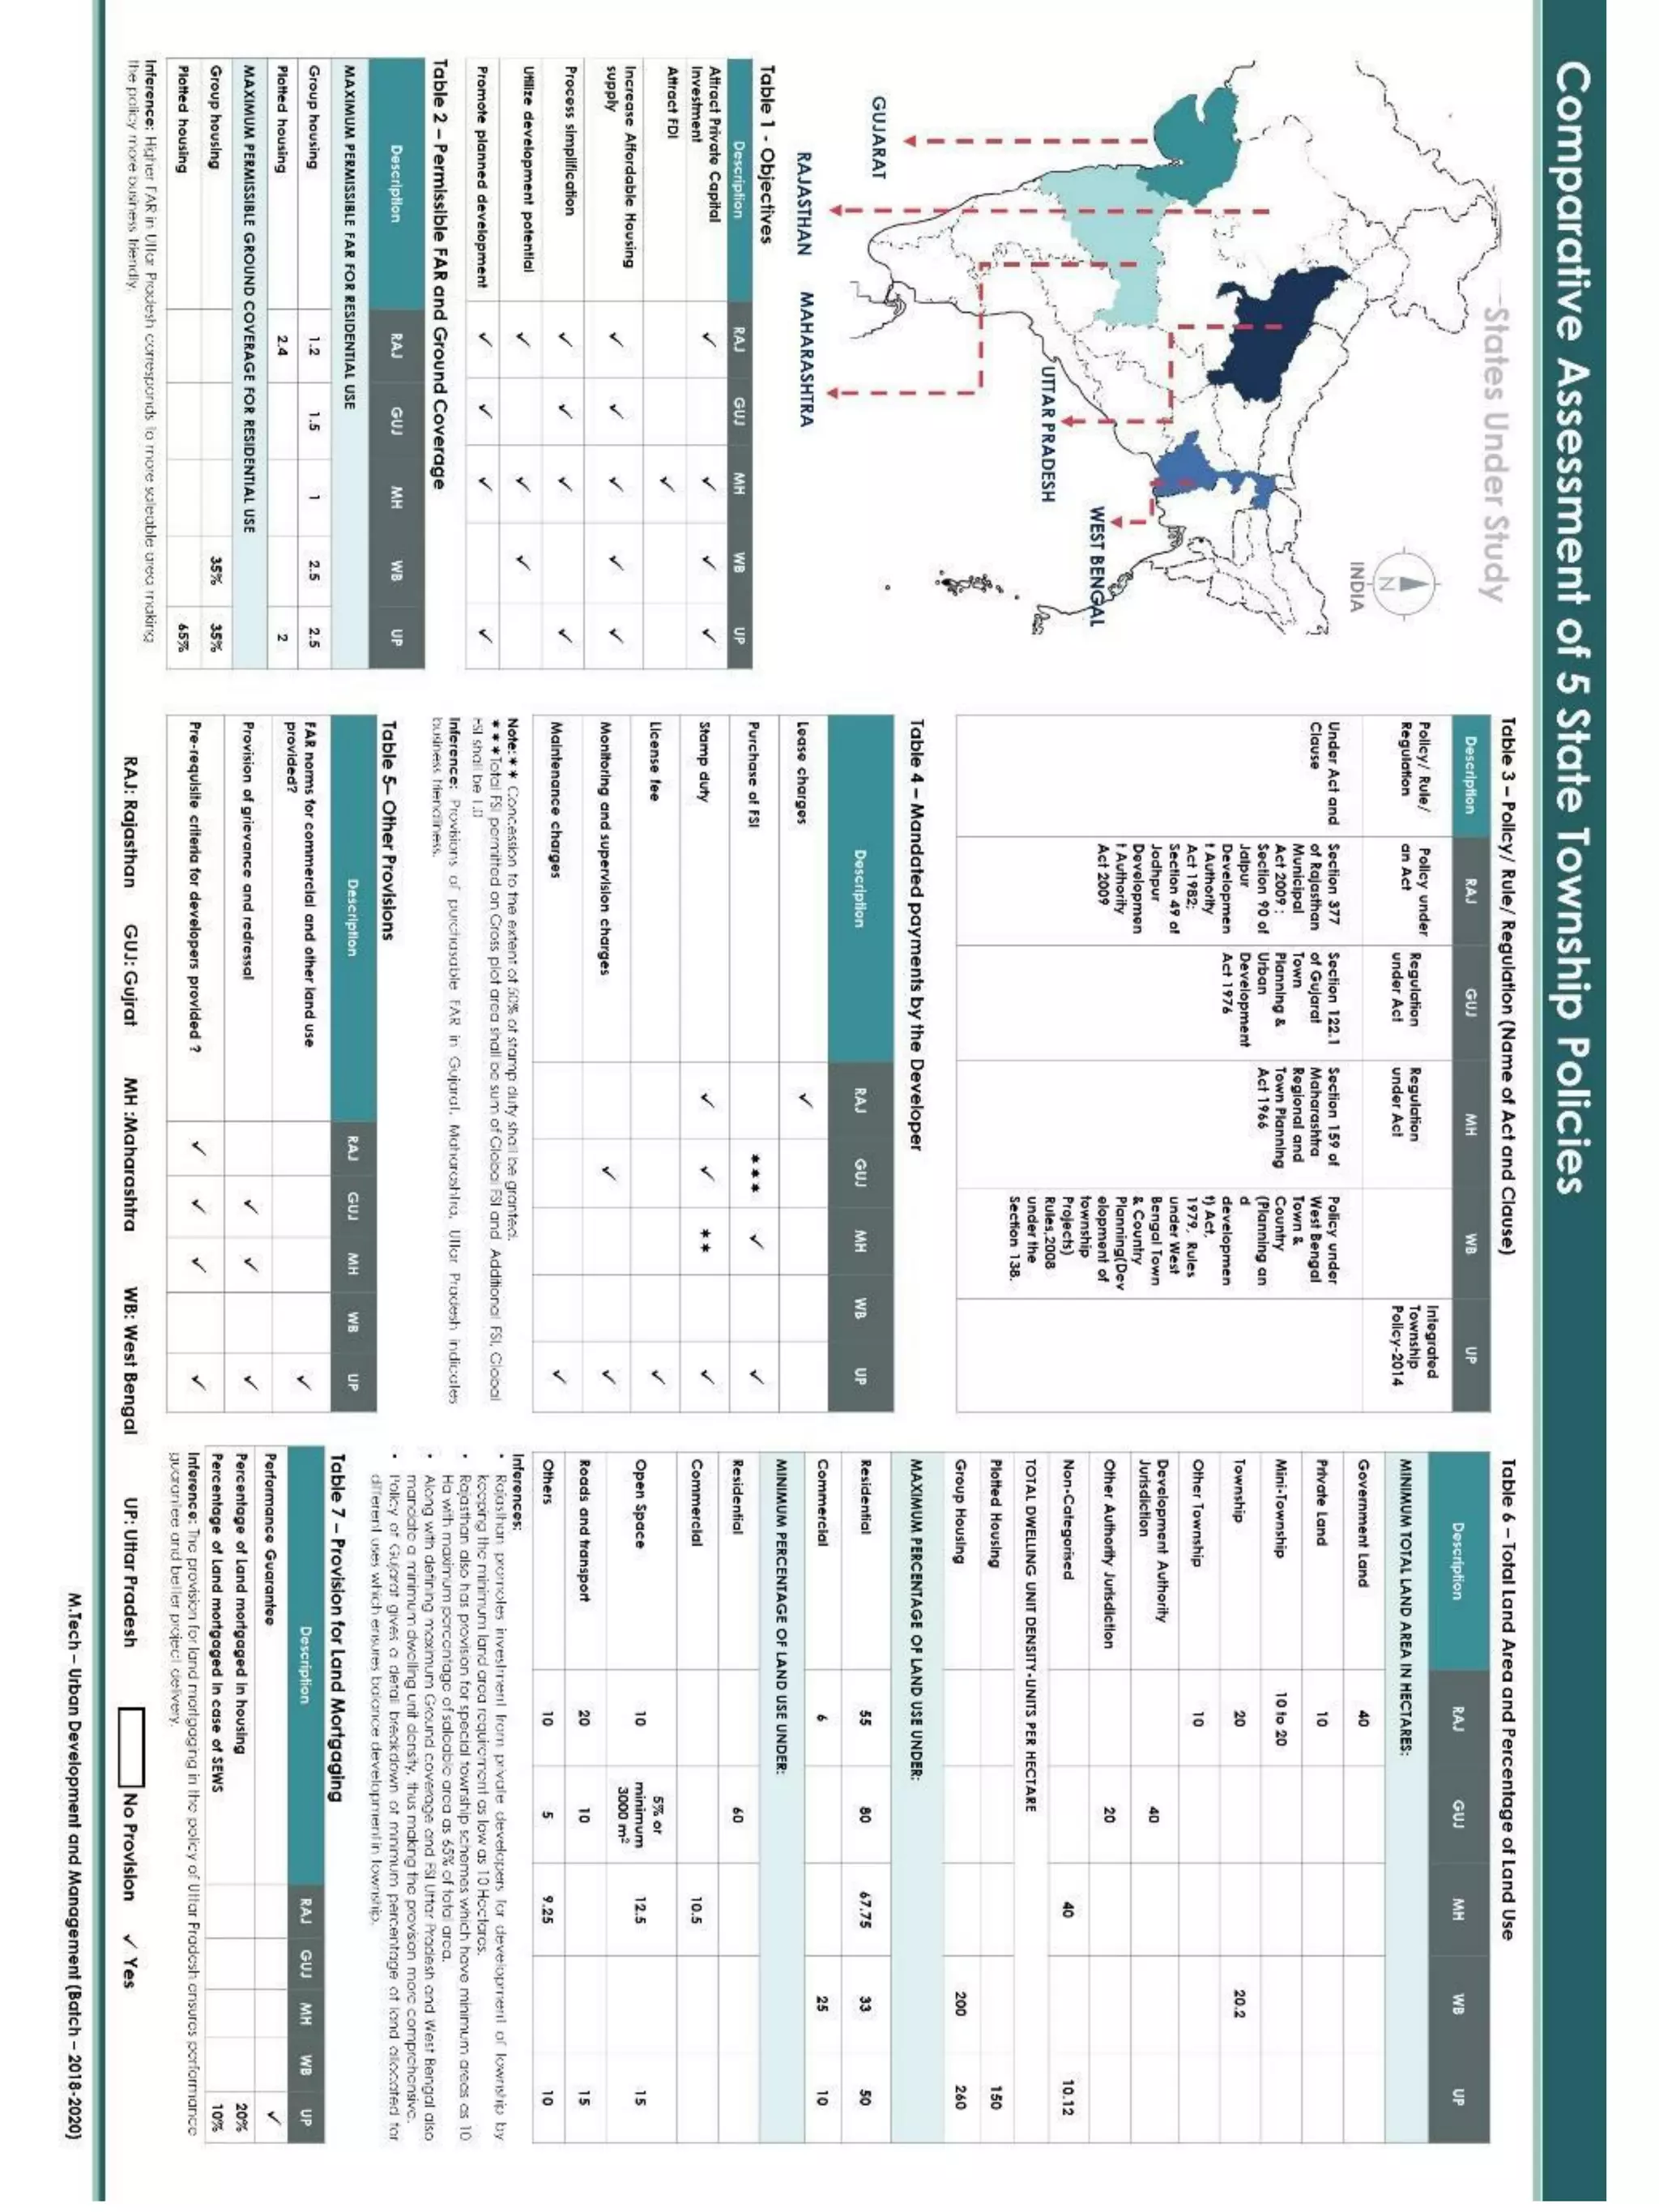
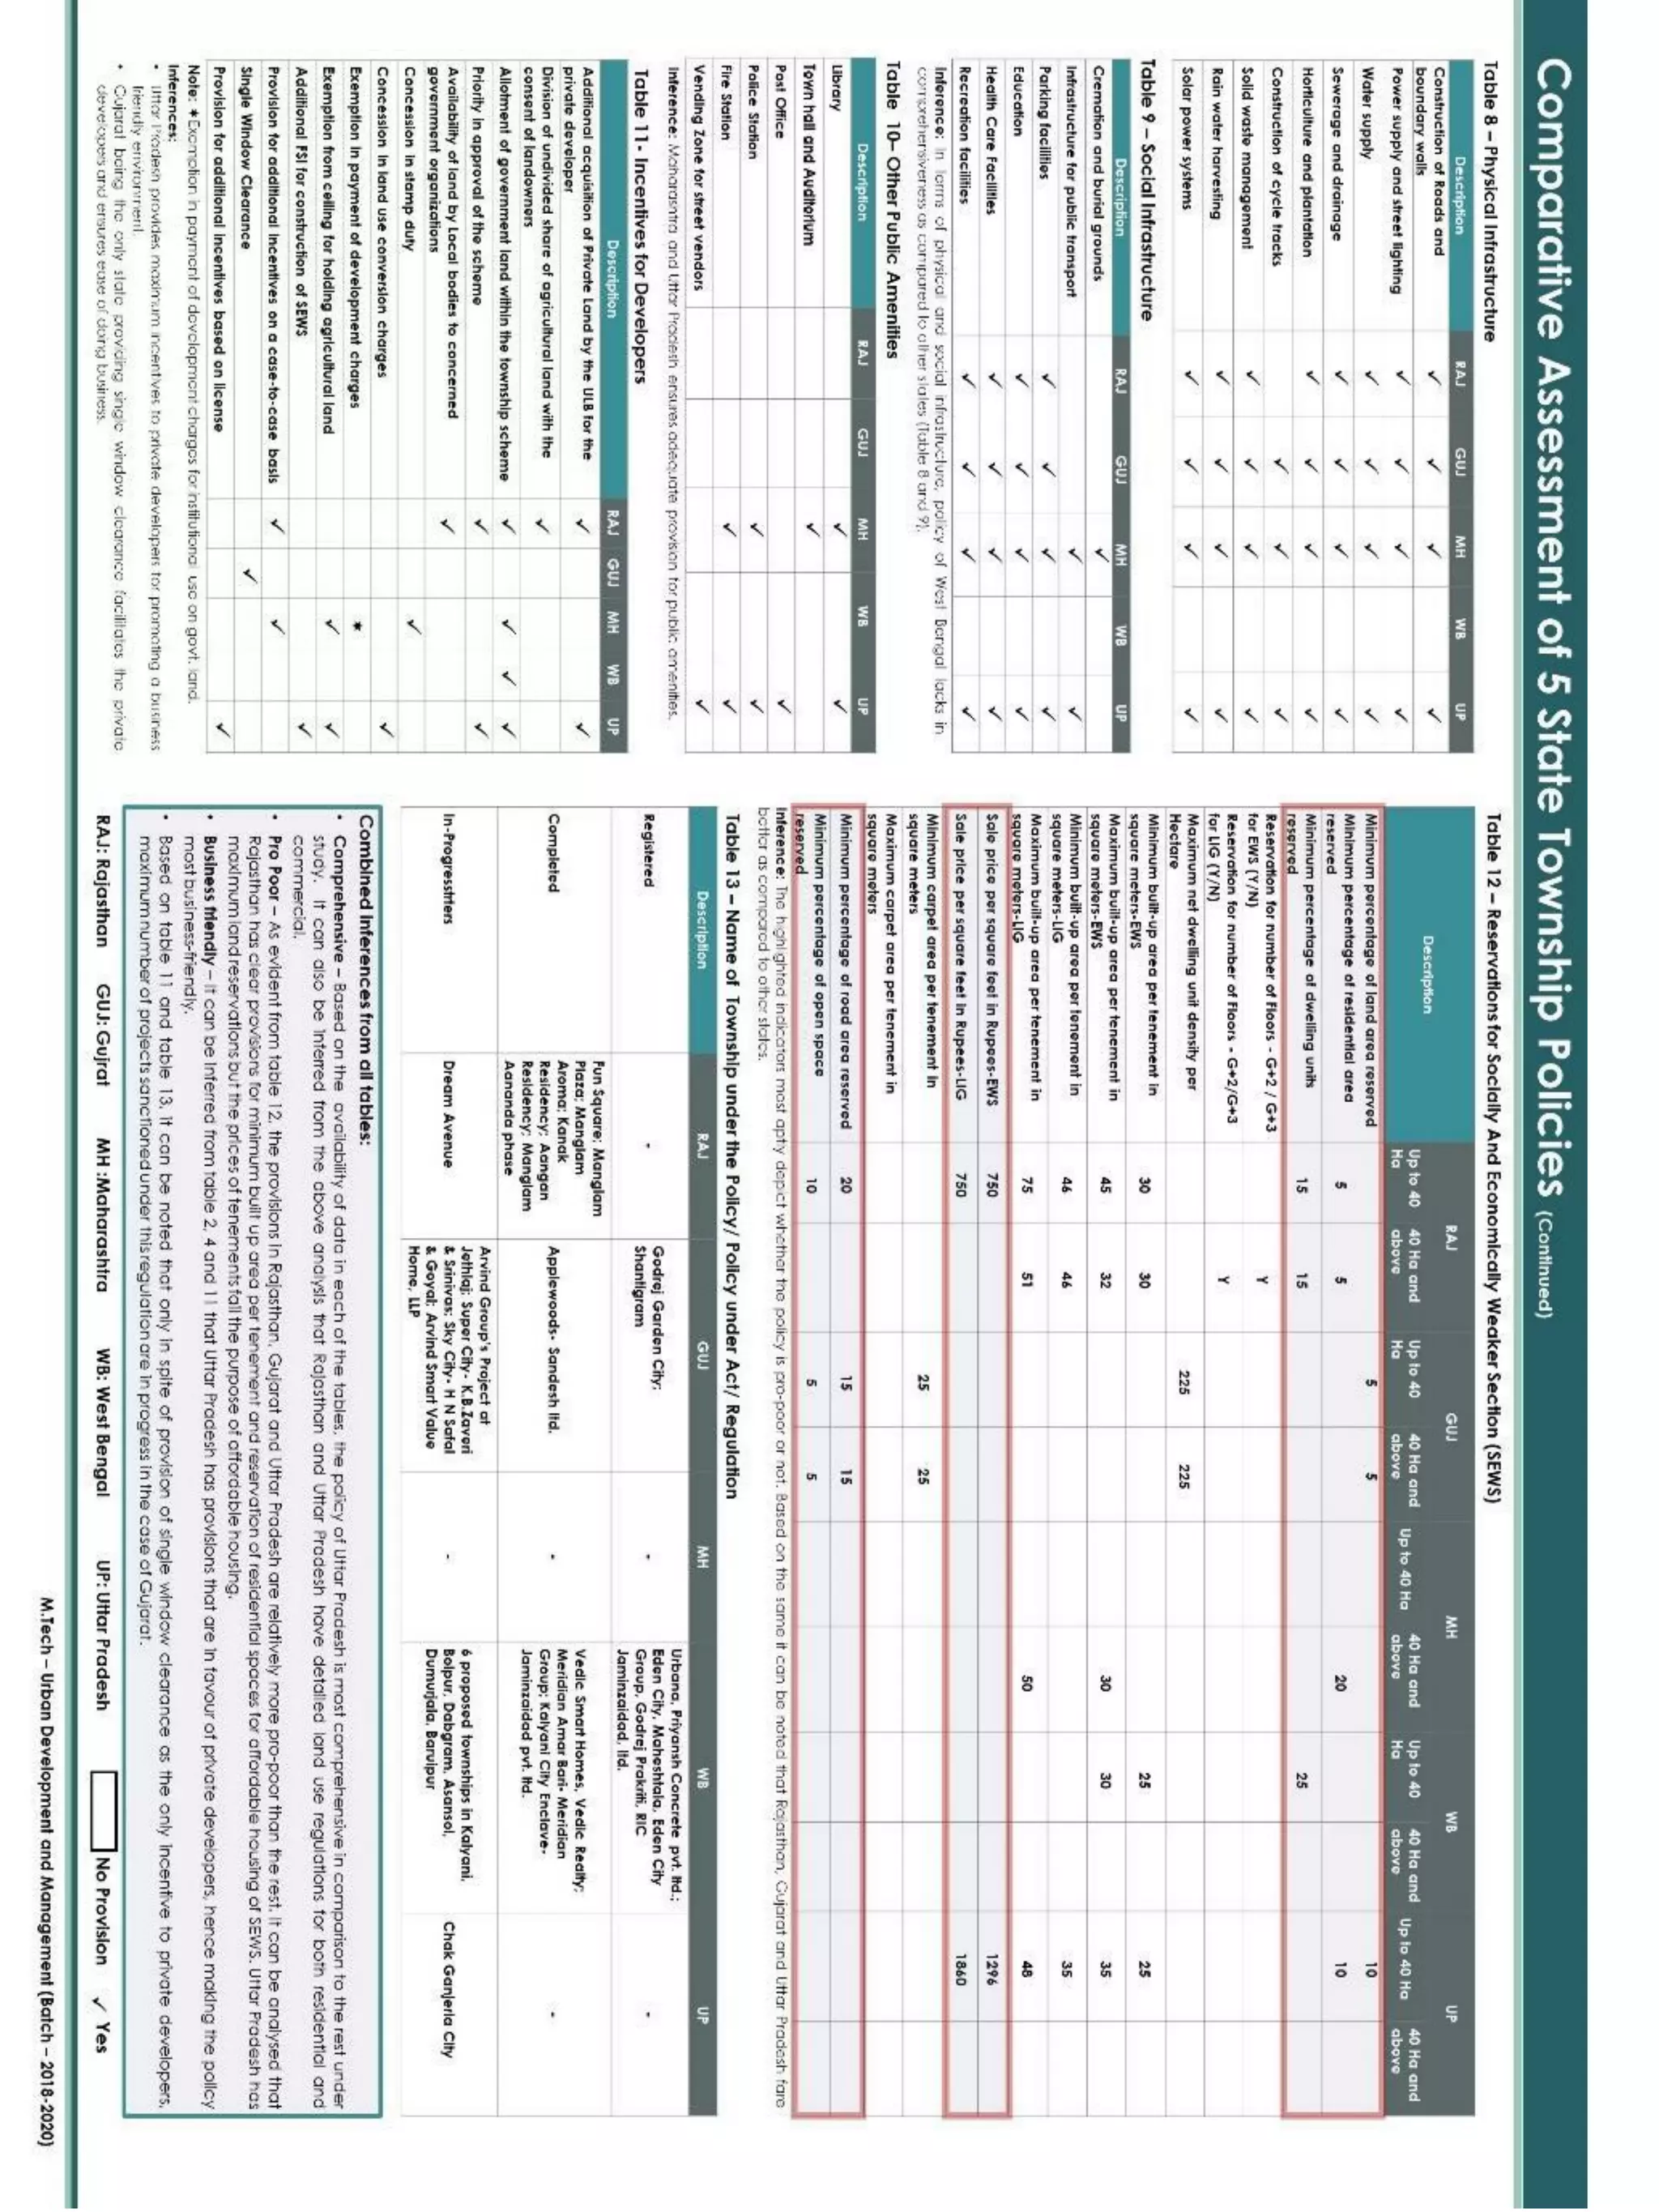
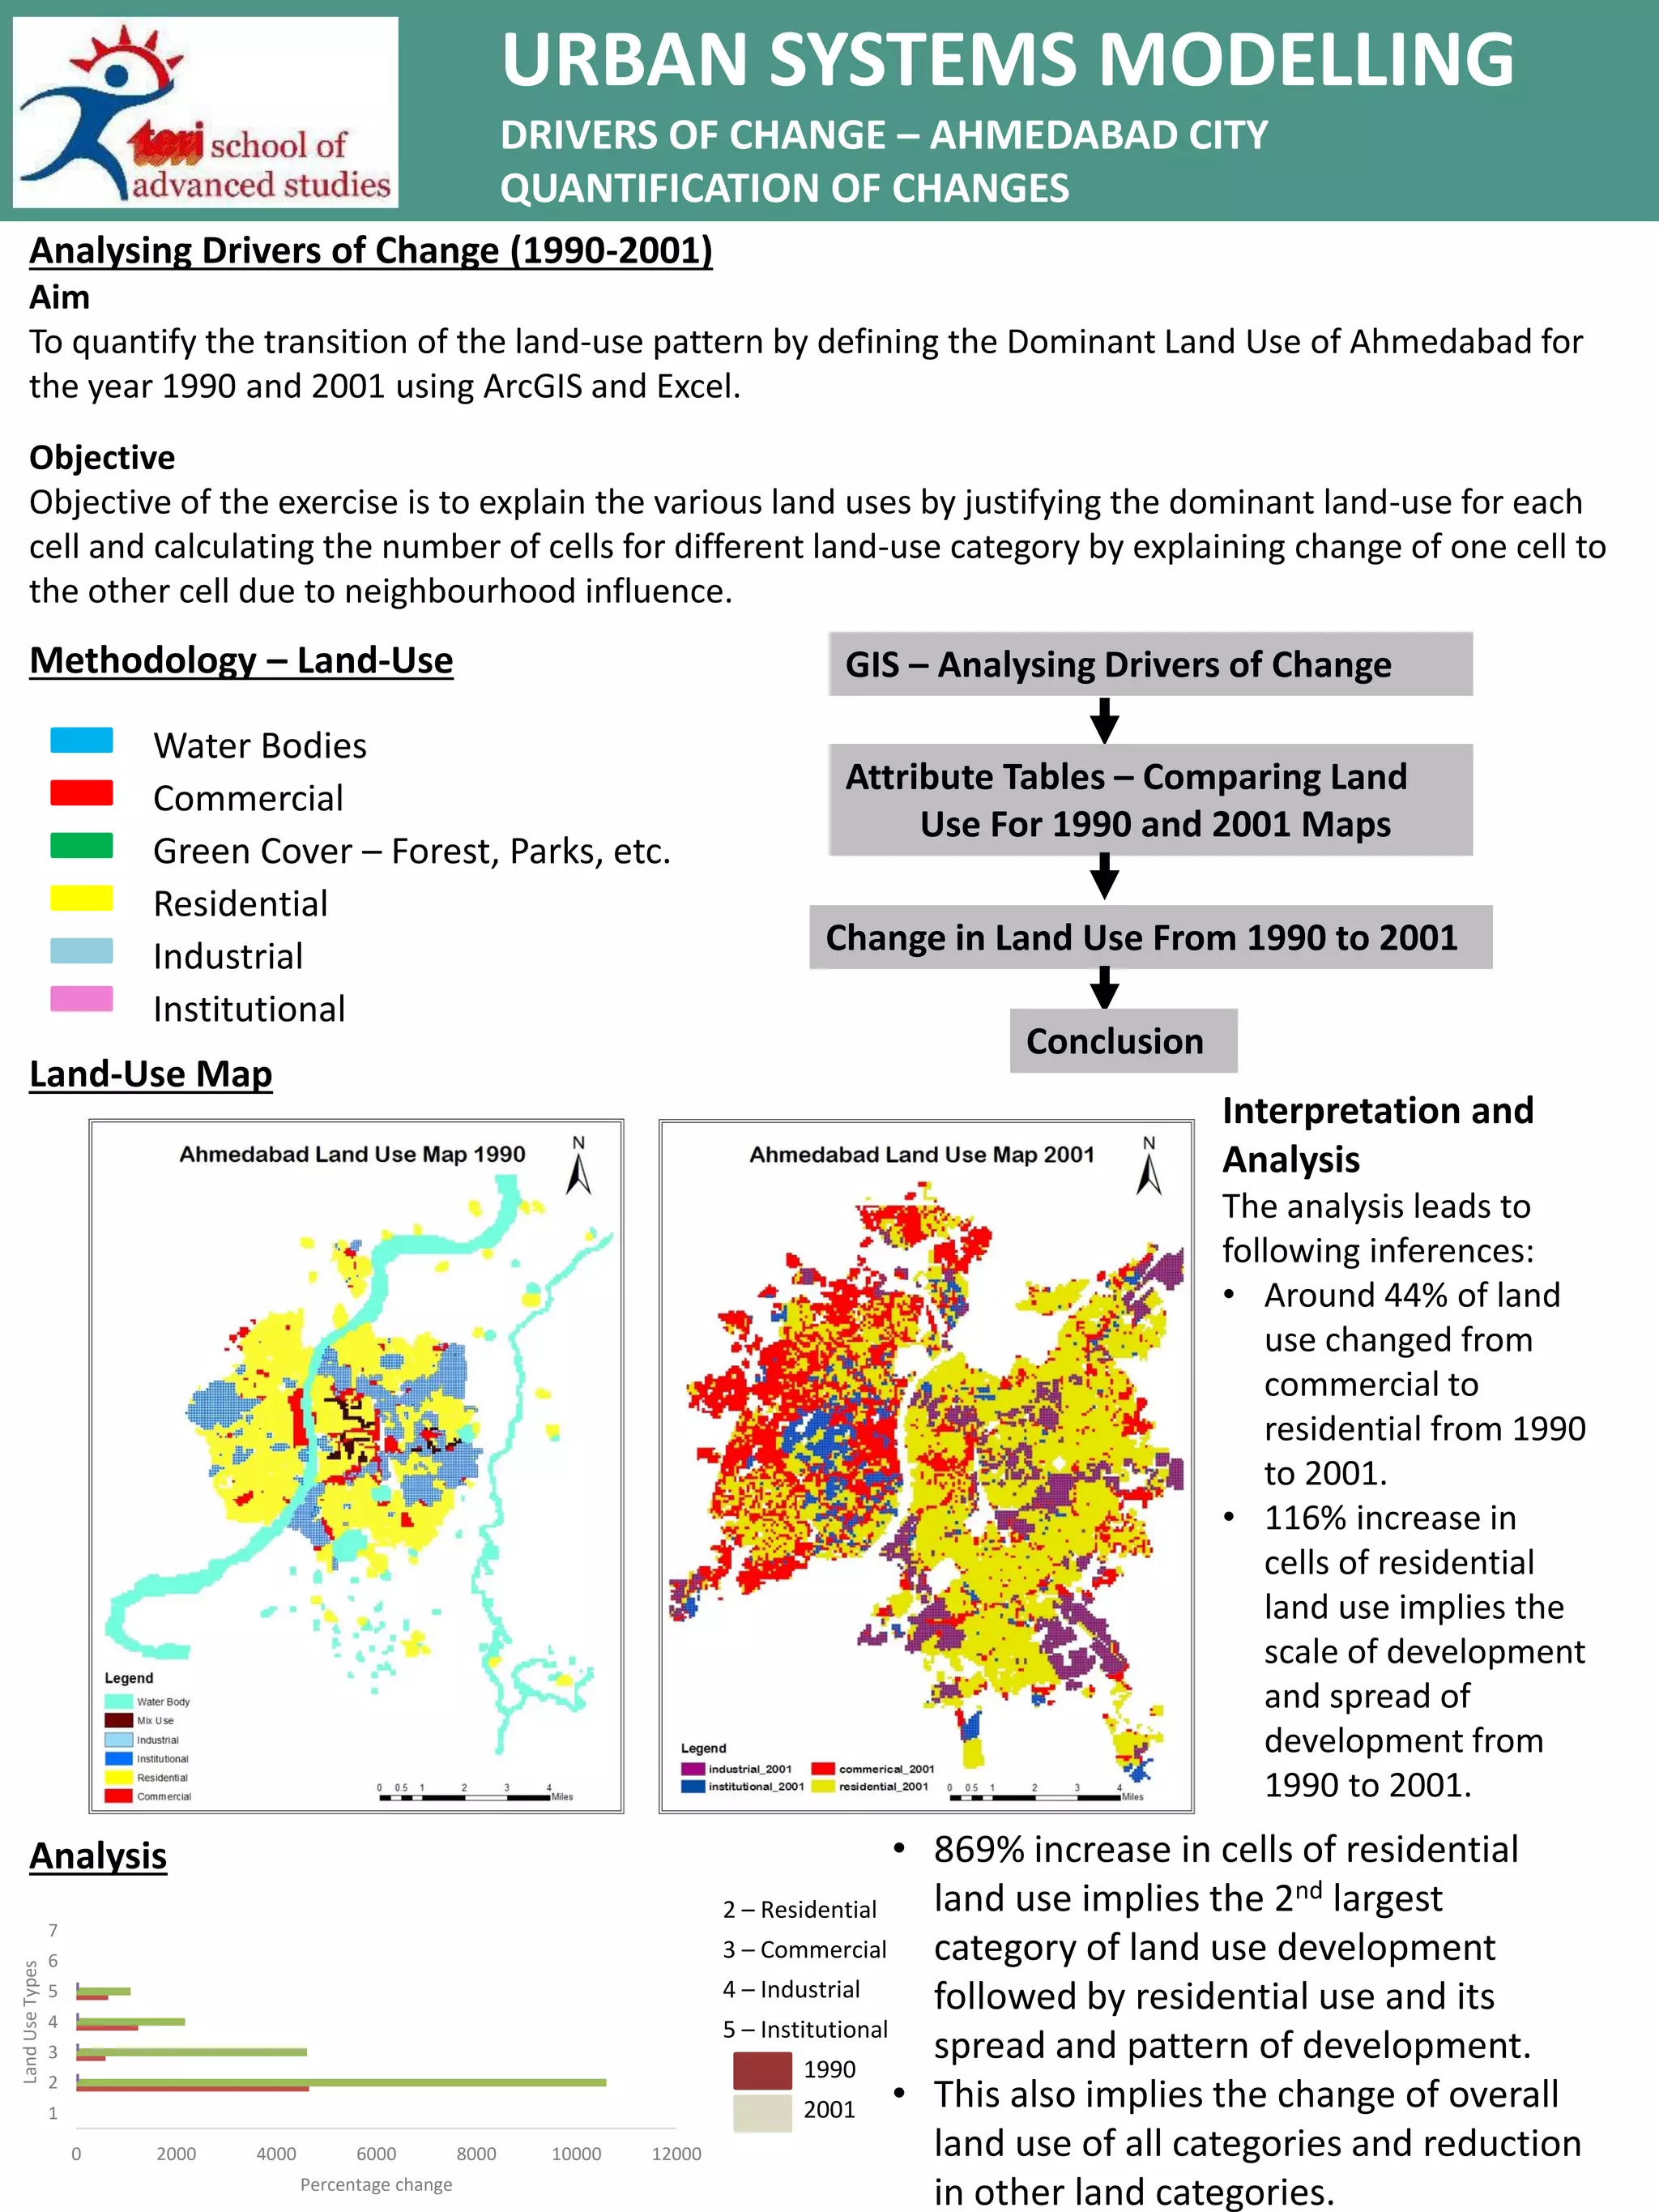
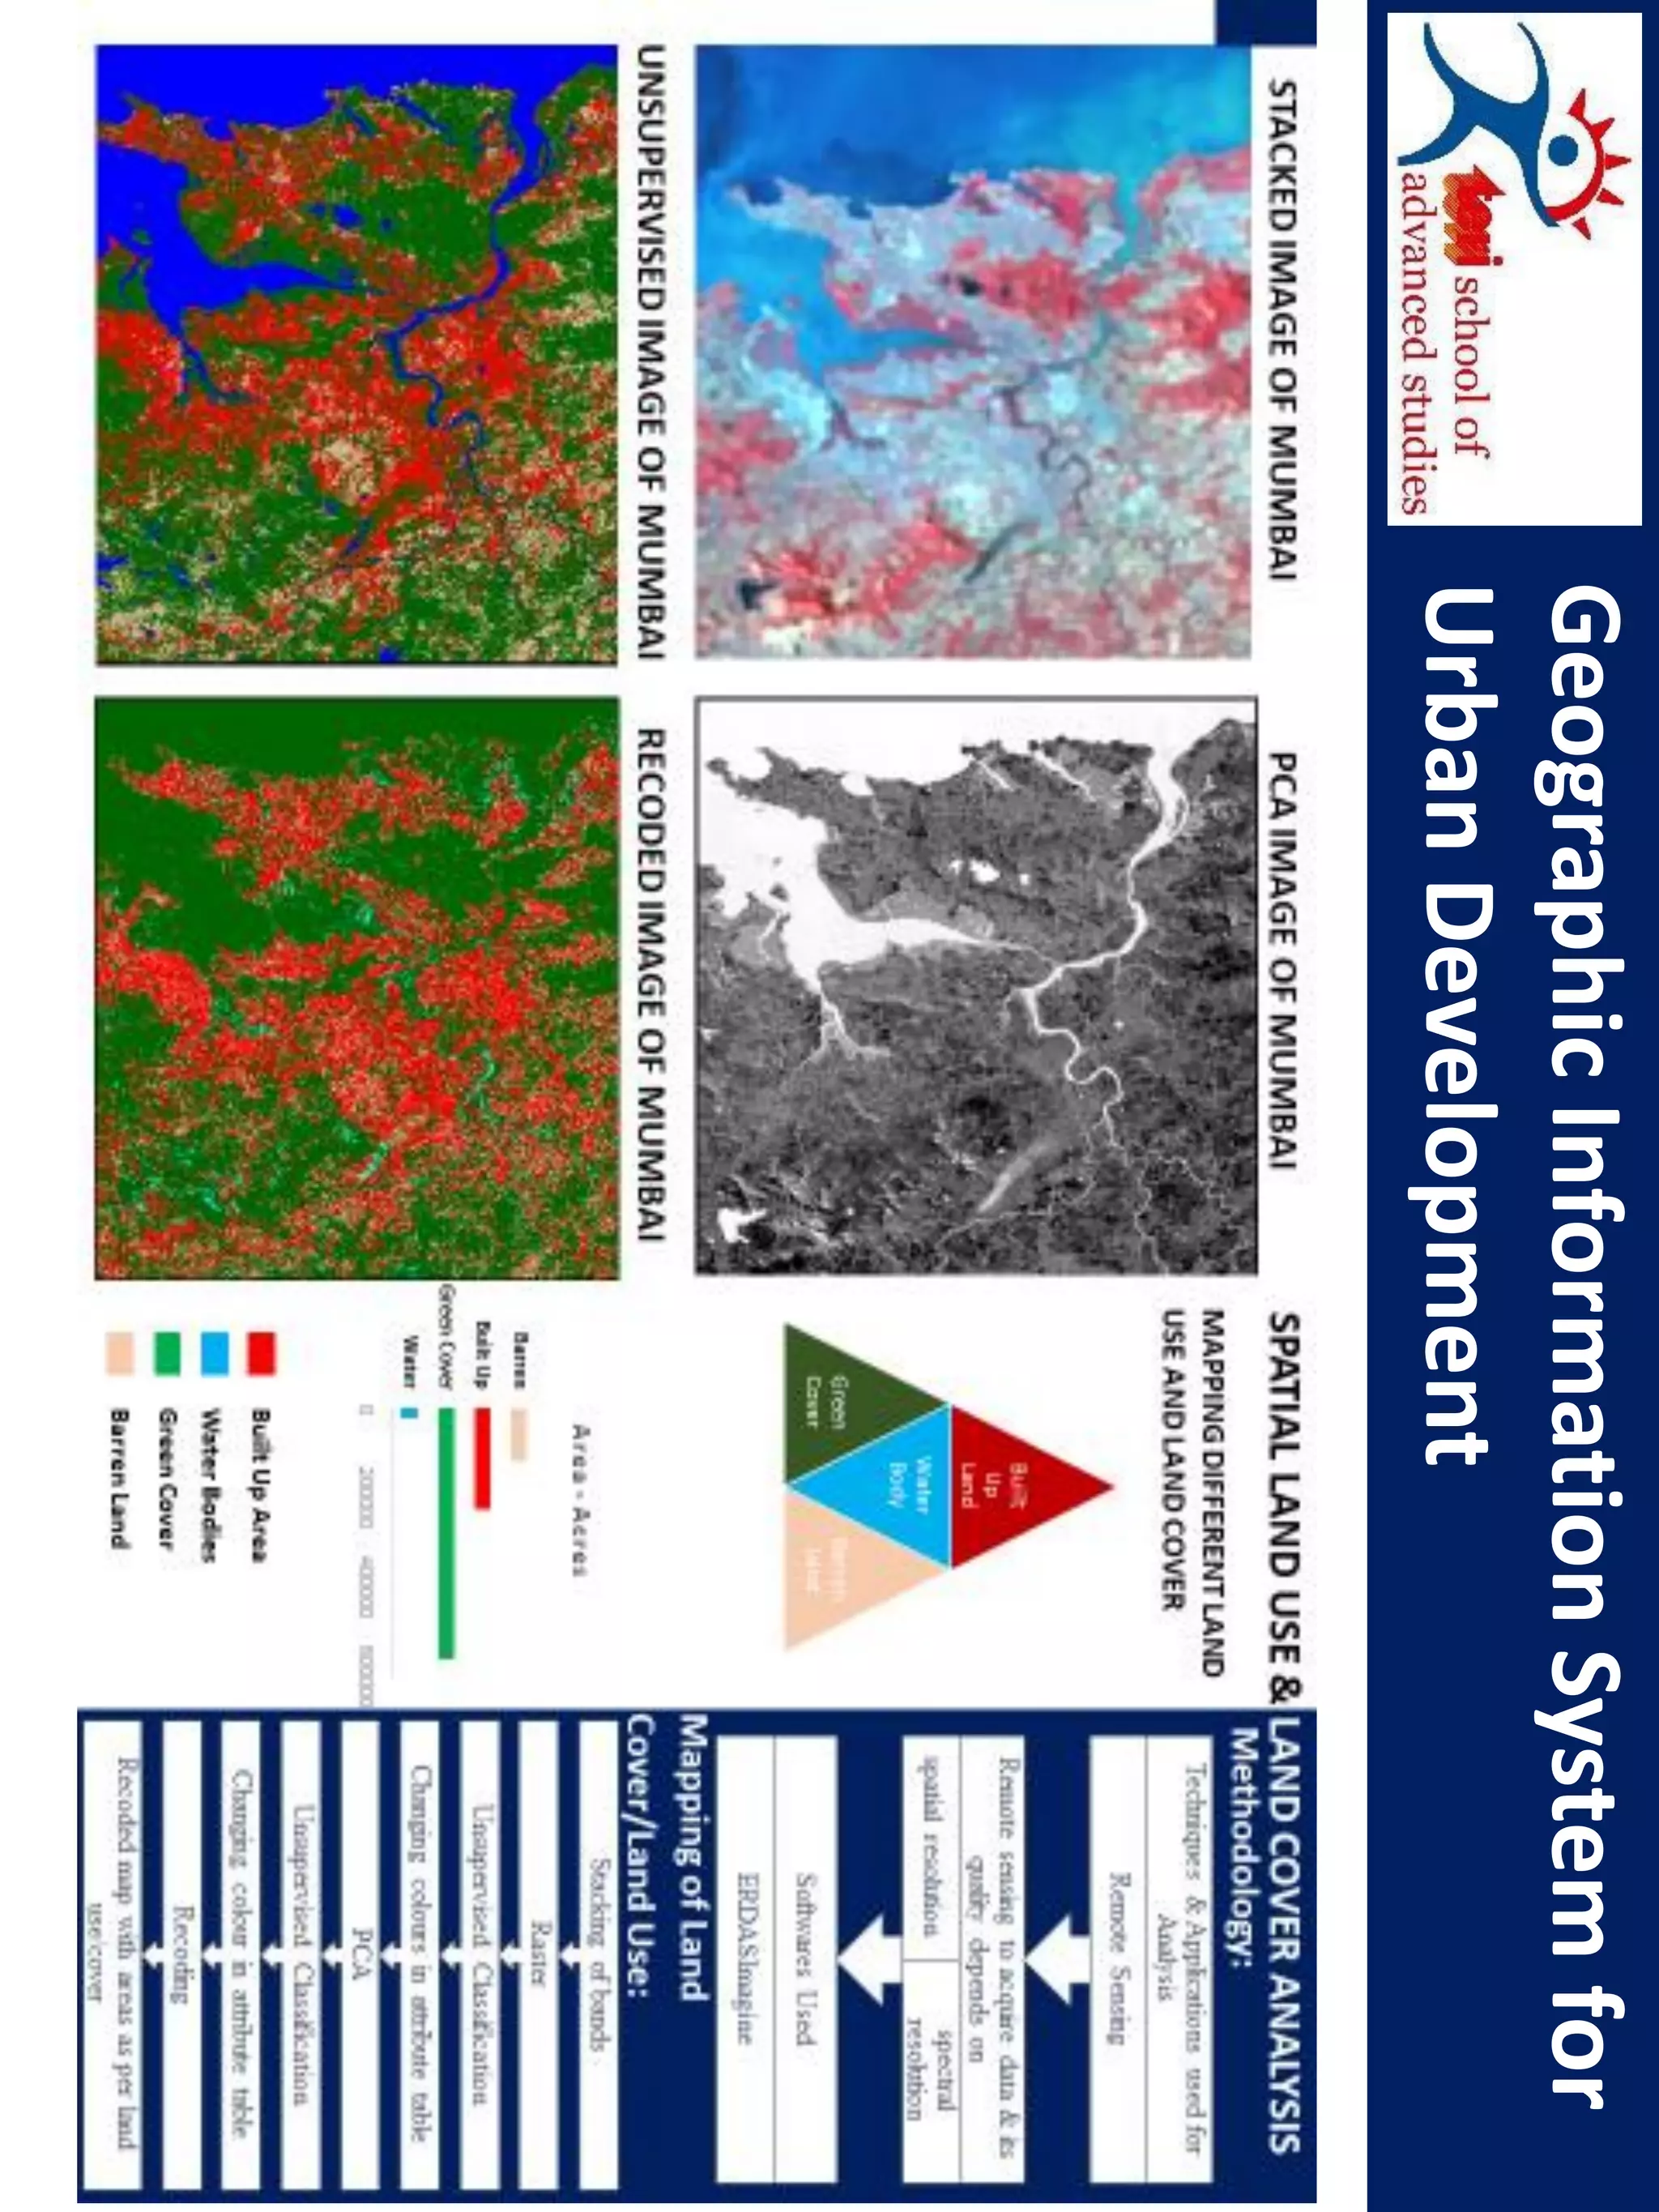
APURVA SINKAR
 P O R T F O L I O 
SELECTED ACADEMIC + PROFESSIONAL WORKS
APURVA SINKAR
TERI University – New Delhi
 Department of Energy & Environment
ADDRESS
Flat no. 3, Building no.1, Jupiter CHS, Vashi.
PHONE
7506633684, 9004255002
EMAIL
Apurva.sinkar@terisas.ac.in
apurvasinkar01@gmail.com
Table of Contents
01 115 HILL TOWN , Pune
02 Pride Soft City, Pune
03 Pride Platinum, Pune
04 Oriana Business Park, Thane
 PROFESSIONAL WORK  2012 – 2018
01 Study of Indore’s city profile
02 Study of Urban Development Authority Acts
03 Study of City Budgets
04 Use of Statistics for analysing use of
Electricity
05 Study of State Township Policies
06 Place-Making- Major Project Part-1
07 Land Use Mapping- ArcGIS and Excel
08 Land Use & Land Cover Analysis
 ACADEMIC WORK  2018-2020
URBAN SYSTEMS MODELLING
DRIVERS OF CHANGE – AHMEDABAD CITY
QUANTIFICATION OF CHANGES
Analysing Drivers of Change (1990-2001)
Aim
To quantify the transition of the land-use pattern by defining the Dominant Land Use of Ahmedabad for
the year 1990 and 2001 using ArcGIS and Excel.
Objective
Objective of the exercise is to explain the various land uses by justifying the dominant land-use for each
cell and calculating the number of cells for different land-use category by explaining change of one cell to
the other cell due to neighbourhood influence.
Methodology – Land-Use
Analysis
Land-Use Map
GIS – Analysing Drivers of Change
Attribute Tables – Comparing Land
Use For 1990 and 2001 Maps
Change in Land Use From 1990 to 2001
Conclusion
Water Bodies
Commercial
Green Cover – Forest, Parks, etc.
Residential
Industrial
Institutional
0 2000 4000 6000 8000 10000 12000
1
2
3
4
5
6
7
Percentage change
LandUseTypes
2 – Residential
3 – Commercial
4 – Industrial
5 – Institutional
1990
2001
Interpretation and
Analysis
The analysis leads to
following inferences:
• Around 44% of land
use changed from
commercial to
residential from 1990
to 2001.
• 116% increase in
cells of residential
land use implies the
scale of development
and spread of
development from
1990 to 2001.
• 869% increase in cells of residential
land use implies the 2nd largest
category of land use development
followed by residential use and its
spread and pattern of development.
• This also implies the change of overall
land use of all categories and reduction
in other land categories.
GeographicInformationSystemfor
UrbanDevelopment

Glimpse of my Educational and Professional work

  • 1.
    APURVA SINKAR  PO R T F O L I O  SELECTED ACADEMIC + PROFESSIONAL WORKS
  • 2.
    APURVA SINKAR TERI University– New Delhi  Department of Energy & Environment ADDRESS Flat no. 3, Building no.1, Jupiter CHS, Vashi. PHONE 7506633684, 9004255002 EMAIL Apurva.sinkar@terisas.ac.in apurvasinkar01@gmail.com
  • 3.
    Table of Contents 01115 HILL TOWN , Pune 02 Pride Soft City, Pune 03 Pride Platinum, Pune 04 Oriana Business Park, Thane  PROFESSIONAL WORK  2012 – 2018 01 Study of Indore’s city profile 02 Study of Urban Development Authority Acts 03 Study of City Budgets 04 Use of Statistics for analysing use of Electricity 05 Study of State Township Policies 06 Place-Making- Major Project Part-1 07 Land Use Mapping- ArcGIS and Excel 08 Land Use & Land Cover Analysis  ACADEMIC WORK  2018-2020
  • 15.
    URBAN SYSTEMS MODELLING DRIVERSOF CHANGE – AHMEDABAD CITY QUANTIFICATION OF CHANGES Analysing Drivers of Change (1990-2001) Aim To quantify the transition of the land-use pattern by defining the Dominant Land Use of Ahmedabad for the year 1990 and 2001 using ArcGIS and Excel. Objective Objective of the exercise is to explain the various land uses by justifying the dominant land-use for each cell and calculating the number of cells for different land-use category by explaining change of one cell to the other cell due to neighbourhood influence. Methodology – Land-Use Analysis Land-Use Map GIS – Analysing Drivers of Change Attribute Tables – Comparing Land Use For 1990 and 2001 Maps Change in Land Use From 1990 to 2001 Conclusion Water Bodies Commercial Green Cover – Forest, Parks, etc. Residential Industrial Institutional 0 2000 4000 6000 8000 10000 12000 1 2 3 4 5 6 7 Percentage change LandUseTypes 2 – Residential 3 – Commercial 4 – Industrial 5 – Institutional 1990 2001 Interpretation and Analysis The analysis leads to following inferences: • Around 44% of land use changed from commercial to residential from 1990 to 2001. • 116% increase in cells of residential land use implies the scale of development and spread of development from 1990 to 2001. • 869% increase in cells of residential land use implies the 2nd largest category of land use development followed by residential use and its spread and pattern of development. • This also implies the change of overall land use of all categories and reduction in other land categories.
  • 16.