Downloaded 110 times


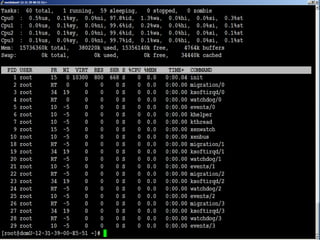
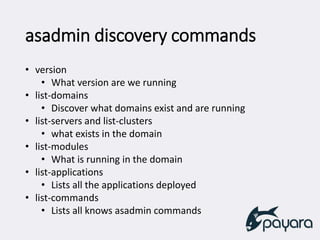

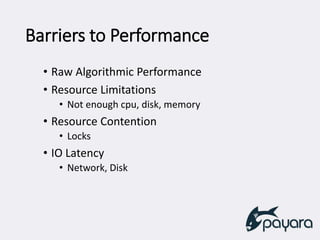
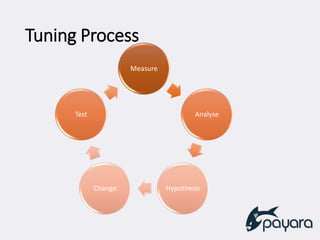

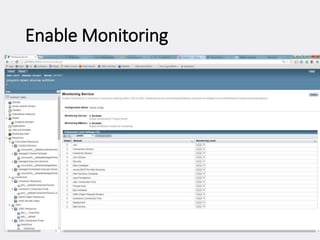
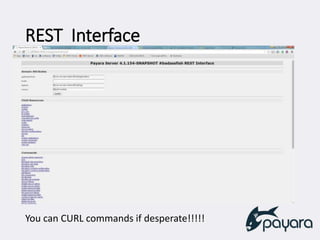


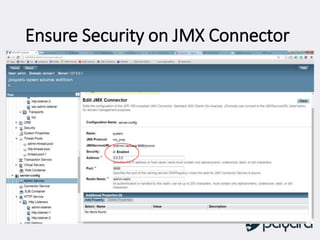
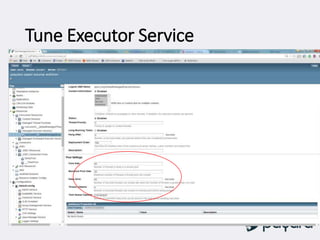
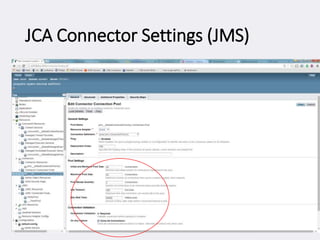


GlassFish Performance Tuning Tips: 1. Use asadmin commands to discover the GlassFish configuration and identify performance bottlenecks like resource limitations. 2. The tuning process involves measuring performance, analyzing the data to identify issues, generating hypotheses for fixes, changing configurations, and retesting. 3. Standard JVM tools and the GlassFish monitoring interface can be used to measure performance and identify issues like garbage collection delays. 4. Potential configuration changes include JVM tuning, modifying default settings, Grizzly HTTP tuning, logging reductions, and datasource optimizations.


![Rapid development tools for java ee 8 and micro profile [GIDS]](https://cdn.slidesharecdn.com/ss_thumbnails/rapiddevelopmenttoolsforjavaee8andmicroprofilegids1-180517150237-thumbnail.jpg?width=640&height=640&fit=bounds)


